Disruptive Technologies Threatening NMCA s Centralized Mapping
|
|
|
- Thomasina Fox
- 5 years ago
- Views:
Transcription

1 Disruptive Technologies Threatening NMCA s Centralized Mapping Juha Hyyppä, Anttoni Jaakkola, Antero Kukko, Harri Kaartinen, Xiaowei Yu, FGI CoE-LaSR Tero Heinonen, ArcticRed/FGI CoE-LaSR Laserscanning.fi
2 CoE-LaSR Vision Laser scanning is omnipresent and affecting positively the life of every citizen in modern information society by early 2020s In the next two decades, new mobile laser scanning systems are making laser scanning more ubiquitous in the same sense as the first personal computing was followed by ubiquitous computing. Even autonomous robots using point-cloud-generating perception sensors may be added to the ecosystem during this timeframe. What can be said for certain is that during the 2020s and 2030s, there will be a great number of laser scanners omnipresent in everyday life. Mobile Laser Scanning is also one of the main techniques to create local virtual reality. We are in the middle of disruptive technologies, multidisciplinary work 2


3 HERE & Google

4 Objective merging virtual and physical worlds
5 Industry revolution You are in a middle of the disruptive technologies NMCAs (National Mapping and Cadastre Agencies) shoud stimulate the process, but can hardly adapt to situation Mapping is done by major global ICT companies Tiny SMEs have technically the same capacity as NMCAs, but are more innovative Nokia acquired Navteq with 8B$ in 2007: Similar technology is in 2030 in 15% of all new cars (15-20M units) Intel acquired Mobileye for 15.3 B (turnover 71M$) 5

6 Industry will solve real-time, fully automated mapping in these conditions, how about you? 6

7 Mini-UAV-LS operational corridor mapping, Sept

8 Dear NMCA Leaders There is at least one person saying this to many of you! 8
9 Small examples of the technological developments
10 DEM automated by ALS Almost 90% reduction in error Costs 50% savings Significant reduction in personnel needed

11 National elevation models Quality of National DEMs after several hundred years of work 25x25 m
 2x2 m")
12 River Valley Forgetting all past work With the cost of 50% of updating old DEM, new DEM acquired with ALS (with very low point density) 2x2 m
13 Forest Inventory automated by LS National savings in Finland 20 M annually Accuracy improved Precision forestry allow more than 100M saving through electronic wood sale


14 This is how forest are traditionally measured /ha costs for standwise inventory; several hundreds for plots (few hundred m 2 ) cm Digital photos from single trees taken from South to West Pine Birch Alder Spruce Small spruce 4-6 m cm 27 cm 35.5 cm 29 m 26 cm 41 cm 34 cm 26 m cm m 29.5 cm 37 cm 47 cm 34.5 cm m 32.3 m 28 m 46 cm 34 cm 32.5 cm m m 30.3 m 35 cm 32 cm m 25 cm B 7 A cm m 26.5 m 32 cm cm cm m 28.2 m 29 cm 37.5 cm m cm 40.5 cm 33 cm 29 m 28 cm 31.5 m 28.5 m 32.5 cm m cm 25.5 m cm cm cm 31 cm 45 cm cm 27 cm 23 kaatunut 33 cm cm cm 14

15 Boreal forest data 15

16 16 Individual Tree Detection

17 Huge savings due to ALS DSM Crown Volume ndsm Tree Stems Near-Surface Vegetation DTM Electronic wood sale several 100M /year
18 Next steps in forestry and powerline monitoring Automated plot level inventory


19 Low-cost Backpack for Forestry 19

20 UAV breakthrough Velodyne VLP-16 PRF 300 khz Dual Return SF 5-20 Hz Range 100 m 16 profiles FOV ±15, 360 NovAtel IGM-S1 125 Hz Trajectory 20


21 Mini-UAV-LS operational corridor mapping, Sept


22 UAV-LS for Forestry 22

23 Virtual forests 23
24 Automated map updating Multispectral ALS allow near-automated map updating

25 Virtual Reality and gaming
")


26 LS in map updating Processing of a large area (6 km x 6 km) Implementation in Definiens software. Changes were made especially in the change detection method. Result: Kirsi Karila, FGI Data and buildings of the map: NLSF OK New Not found Classified as tree


27 Multispectral Airborne LS

28 TITAN Wavelength Sensitivities


29

30 Object-based analysis Segmentation of Titan height and intensity data. ecognition software used (Trimble Germany, Munich).

31 Land cover classification

32 32

33 Road mapping Accuracy: 81% of topographic database road centre lines classified as road 93% of road surface classified correctly into asphalt or gravel Figure and results: Kirsi Karila
34 Solves many basic problems Confusion matrix based on intensity features Predicted producer Pine Spruce Birch Reference Pine Spruce Birch user Overall = 86.81% 34 Confusion matrix based on point cloud and intensity features Predicted producer Pine Spruce Birch Reference Pine ,55 Spruce ,10 Birch ,43 user Overall = 88.36%
35 Change based national mapping: LS every 2-5 years


36 Change Based Mapping Yellow: 2003 Red: 1998 DSM 1998 DSM 2003 Hyyppä, J., Yu, X., Rönnholm, P., Kaartinen, H., and H. Hyyppä, Factors affecting laser-derived object-oriented forest height growth estimation, The Photogrammetric Journal of Finland, Vol. 18(2), Courtesy to Xiaowei Yu, FGI
37 This change monitoring capacity would cost in Finland 1 /person per year Construction Yu, X., Hyyppä, J., Kaartinen, H., and M. Maltamo, Automatic detection of harvested trees and determination of forest growth using airborne laser scanning. Remote Sensing of Environment, Vol. 90,
38 Indoors and GNSS denied environments

39 Indoor point cloud

40 Combination of PLS and Indoor TLS for seamless modeling 40
41 Citizens and small SMEs can have NMCA capacity
 and range image (right)")

42 Phone-based mapping Figure 1. RGB image (left) and range image (right) taken by Kinect sensor. Markers pinned on the trunk can be visually identified from the RGB image. 42

43 Personal laser scanning system Specilalized application of MLS GNSS-INS Positioning Ultra high speed laser scanner Mobility Suitability for many new applications 43

44 Point Cloud

45 Point cloud as topographic data base Kukko, Kaartinen, Hyyppä, Virtanen, Kurkela, Vaaja

46 Kukko, Kaartinen, Hyyppä, Virtanen, Kurkela, Vaaja


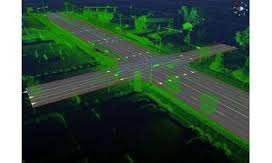
47 Autonomous Driving

48 Real-time data 48

49 Autonomous driving

50 UAV and MLS linkage Parking assistance UAV flying 100 m ahead UAV+MLS used for mapping


")
 CNN Money President")
 Selected International")
51 Robotbus project stack COE, SOHJOA, COMBAT National Decision Makers Zeit Online The Guardian International Decision Makers Trafi Board Xinhua News Minister Kai Mykkänen TechCrunch Peter Vesterbacka CNN Money President of Lithuania Dalia Grybauskaitė Selected International Media HKI, Pekka Sauri


52 We have the biggest robotics research group in Finland 52

53 Data used as Big Data?


54 Automated map updating The area inside the rectangle (red dashed line) contains the new buildings that were not presented in the old building map.
.")
55 Old Building Map and Extracted Lines The extracted lines (red and green) have been compared with the old building map (blue lines). Red lines correspond to extracted walls that do not match with the old building map: They indicate new buildings.
 Part of the street Espoonlahdenkatu as recorded on the reference video during data")

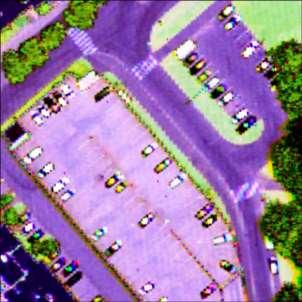
56 Car parkings Figure. a) Part of the street Espoonlahdenkatu as recorded on the reference video during data acquisition Drive 1. b) Raster representation of the car-based laser scanner data. The pixel value of each 0.3 m 0.3 m cell corresponds to the number of laser points inside the cell. Parked cars appear as L shaped clusters of bright pixels.
 and classification results (right) for Drives 1 (upper")

57 Figure x. Data (left) and classification results (right) for Drives 1 (upper row) and 2 (lower row). Parking places classified as free are shown in green and parking places classified as occupied are shown in red. Digitized boundaries of the parking places are shown in yellow.

58 Level 5 autonomous car data 58
59 What should NMCA do?
60 Action items Main issue from collaboration with companies Reasonable amount of current money allocated smartly to R&D of innovative SMEs capable to export will pay it back to the society with increased employment and taxes paid. With the current technology disruption this may even generate a new value adding service sector. National collaboration at ministry level may be needed National data acquisition programmes solving national problems (environment, built, traffic etc) Provide National Core Datasets Industry provides as subcontract, NMCA specifies Huge savings when large areas collected at the same time Open data or near-open data serving all citizens and Value-adding companies What about if National Topographic database = High-quality Point Cloud + Images (and basic products done with 95% automation) 60

61 61