MISTIK MANAGEMENT LTD. FOREST MANAGEMENT PLAN
|
|
|
- Mariah Atkinson
- 5 years ago
- Views:
Transcription
1 MISTIK MANAGEMENT LTD YEAR FOREST MANAGEMENT PLAN
2
3
4
5
6
7 Mistik 20-Year FMP Schedule 1. March 2006 Public Consultation Sessions Volume 1 Background Information 2. August 2006 Public Consultation Sessions Volume II Defining Sustainable Forestry (Forest Estate Modeling) 3. November 2006 Public Consultation Sessions Volume II Forest Management Plan (Implementation)
8 Volume II 20-Year Sustainable Forest Management Plan
9


10
11
12 1. Forest Characterization 2. Forest Yield 4. Wood Supply Analysis 5. Tactical Harvest Plan
13 1. Forest Characterization Define the excluded land base area Define the working forest area


14 1. Forest Characterization
15 1. Forest Characterization
16 1. Forest Characterization

17 1. Forest Characterization

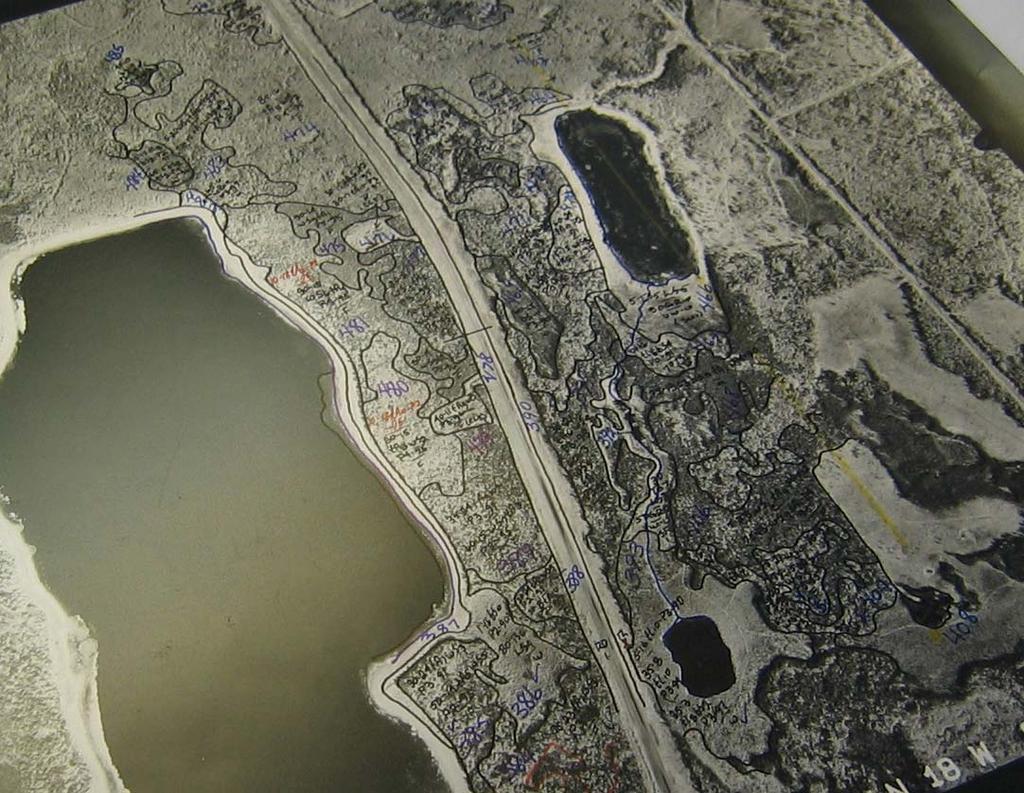
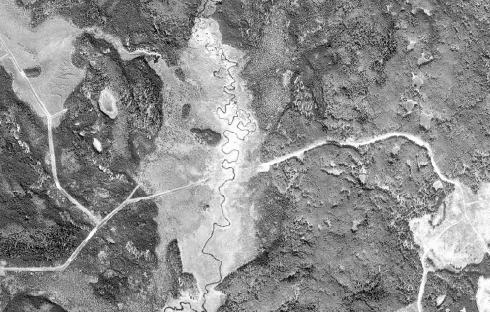
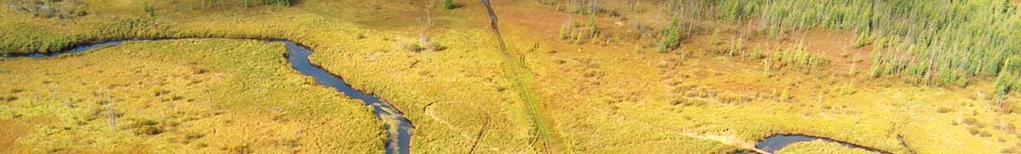
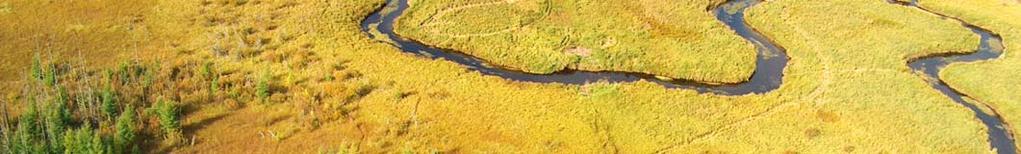
18 1. Forest Characterization Beauval Forks
19 1. Forest Characterization Land base netdown animation
20 1. Forest Characterization Total FMA land area = 1,831,964 ha Excluded land base area = 1,013,964 ha Working forest area = 818,000 ha 55% 45%
21 Questions or comments?
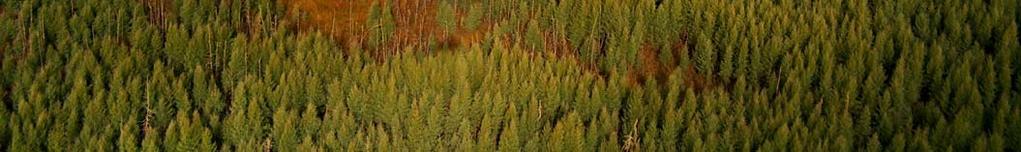
22 2. Forest Yield Within the working forest Define how much the forest grows

23 2. Forest Yield White spruce


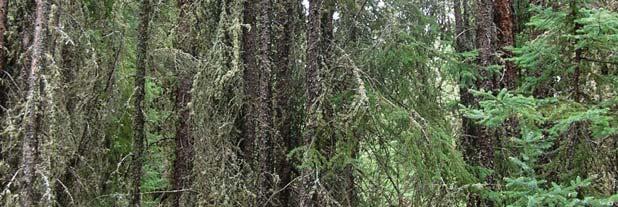
24 2. Forest Yield Black spruce

25 2. Forest Yield Jack pine


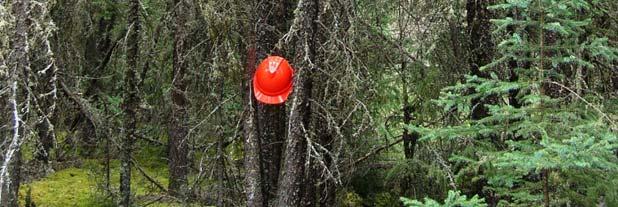
26 2. Forest Yield Mixedwoods ta/jp

27 2. Forest Yield Mixedwoods ta/ws

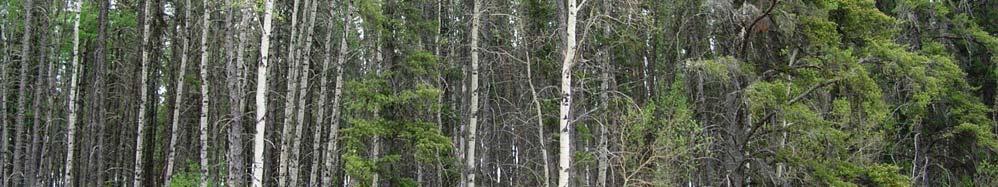
28 2. Forest Yield Aspen


29 2. Forest Yield


30 2. Forest Yield


31 2. Forest Yield


32 2. Forest Yield

33 2. Forest Yield > 1,000 forest stands, > 5,000 plots > 80,000 trees
34 2. Forest Yield On average, ~ 180 m 3 /ha ~ 35% softwood ~ 65% hardwood as low as 60 to 70 m 3 /ha for bs and jp forest types up to 250 to 300 m 3 /ha for some ta and ws forest types
35 2. Forest Yield Emphasis on maintaining natural forest succession and stand dynamics; No brushing, thinning, pruning, herbiciding; Harvest levels based on what natural forest growth will provide; Rotation ages ~ 80 to 120 yrs.
36 Questions or comments?
37 Define management style (indicators and targets) Planning Public consultation Harvesting and roading Forest renewal 38 SFM indicators
38 Mistik s s forest use principles: KNOW the land base and people UNDERSTAND forest ecosystem processes PROTECT sensitive forest ecosystem attributes MAINTAIN forest ecosystem integrity MINIMIZE impacts MITIGATE negative impacts

39 Protection of sites of biological or geological importance
40 Protection of sites of cultural importance


41 Maintenance of cultural / traditional use activities


42 Maintenance of aesthetic / scenery attributes
43 Maintenance of key ecological attributes old forest
44 Old forest retention Jack pine 5% Black spruce 5% White spruce 9% Mixedwood 10% Hardwood 14% Will take one rotation (~ 100 yrs) to achieve target for mixedwood and hardwood forest types

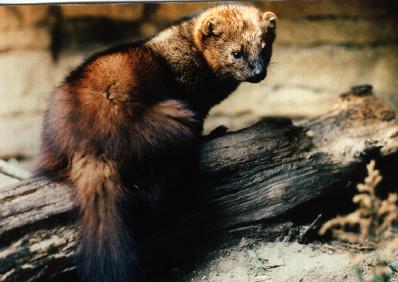
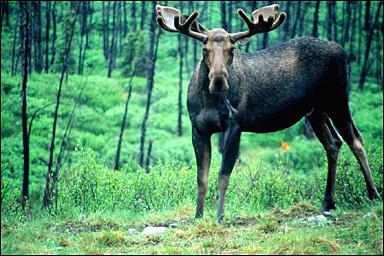
45 Maintenance of key ecological attributes wildlife
46 Limits within caribou ranges imposed on: total amount of forestry impact; rate of harvest impact; rate of decline of intact area ; road density; and maintenance of landscape-level level low-disturbance connectivity areas throughout the range of caribou in the FMA area.
47 Current and future habitat supply analyses have been completed for: woodland caribou; moose; fisher; marten; avian species.

48
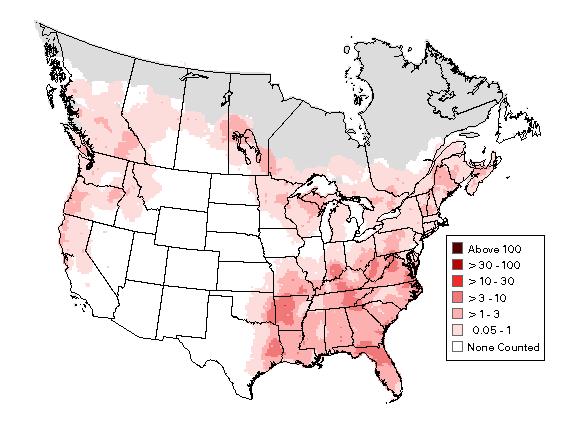
49
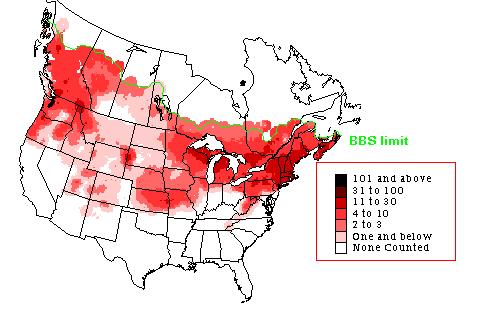
50

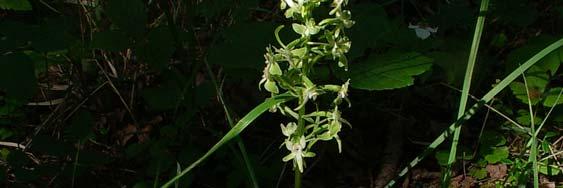
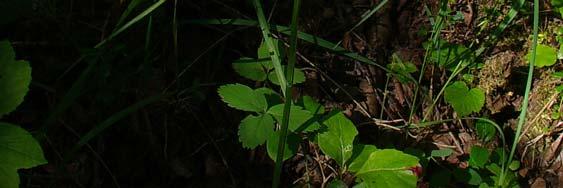

51 Maintenance of key ecological attributes plants
52 Maintenance of key ecological attributes water

53 Maintenance of values within High Conservation Value Forest areas
54 ~ 6 to 10% of all HCVF areas are protected from forestry disturbance; In most cases, the protected area exceeds 10% due to additional biological, topographical and social considerations; Mistik regularly incorporates harvest deferral areas and modifications to the rate of harvest in these zones.

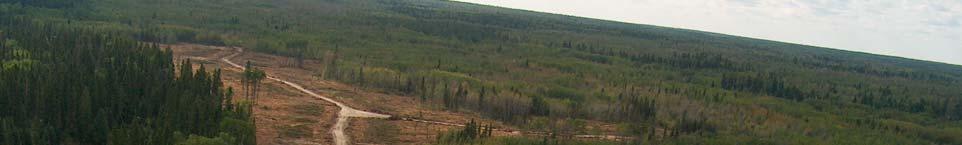
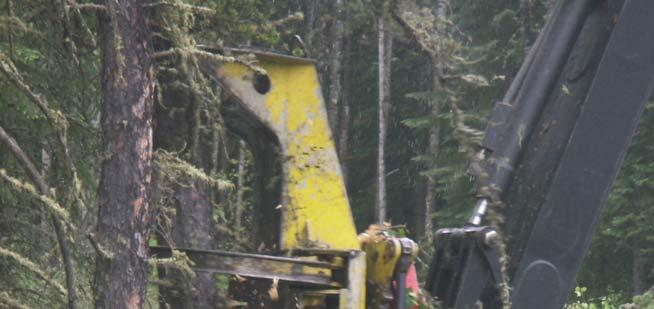
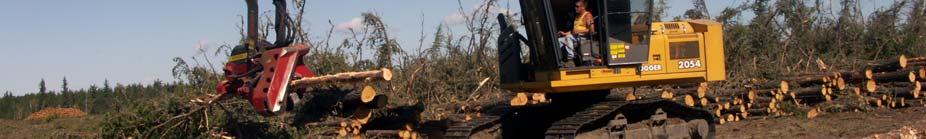
55 Minimize impact road construction
56 Estimated future road construction: Historic average of ~ 1 km per 17 ha of harvest area; Estimated harvest of 6,000 to 7,000 ha per year; ~ 350 to 400 km of road per year; Mostly Class 3 bush road.

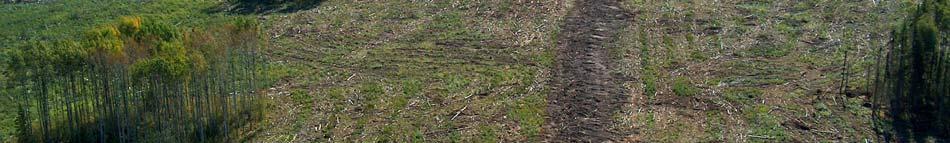
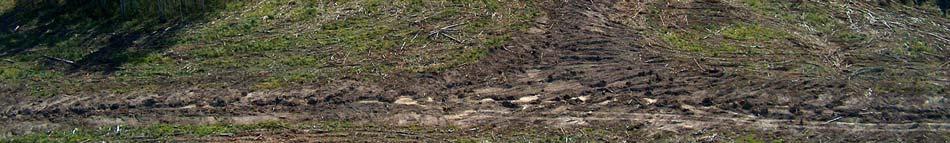
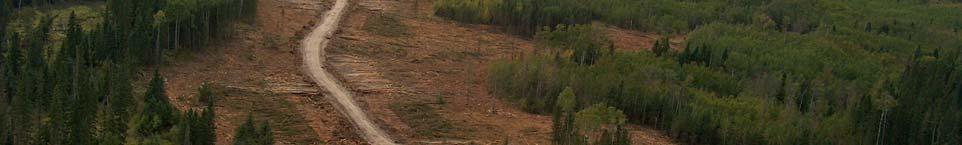
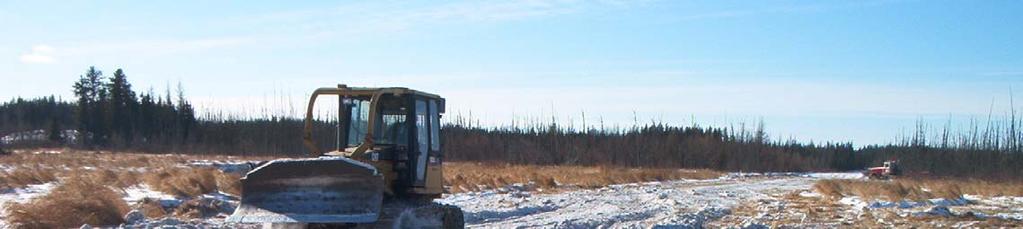
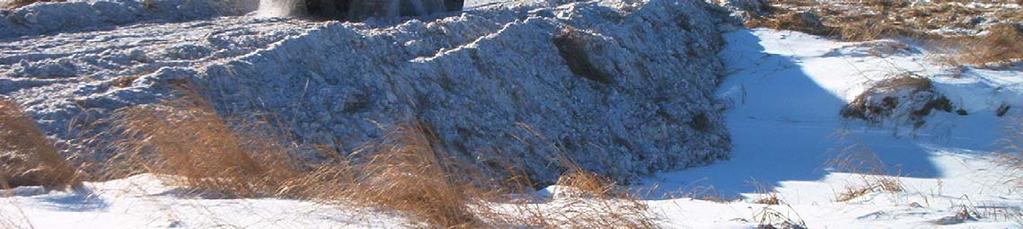
57 Minimize impact road reclamation
58 Estimated future road reclamation: Historic average of ~ 54% of total roads built; ~ 190 to 215 km of road reclamation per year; Entirely Class 3 bush road.
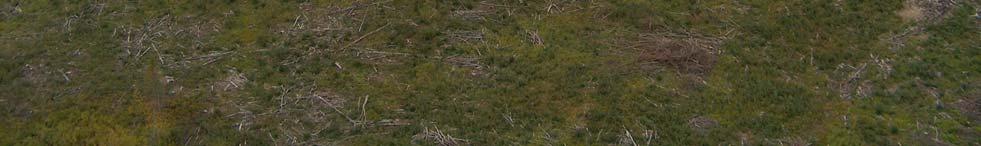
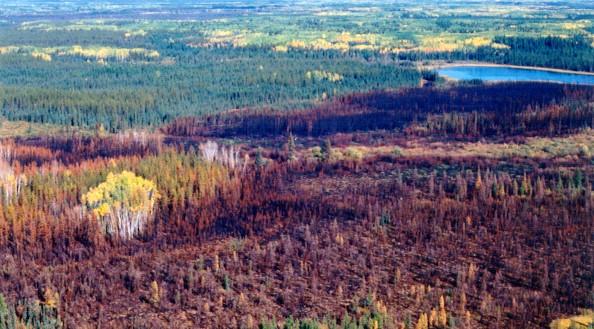
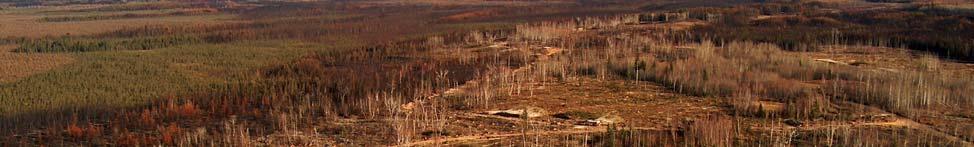
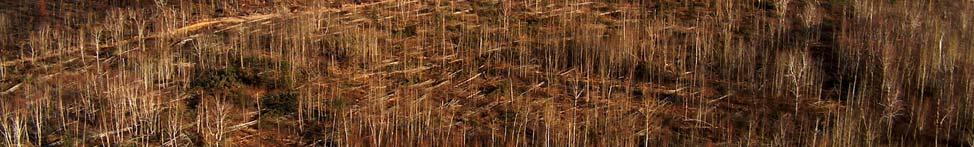
59 At any time, less than 2% of the working forest will be comprised of non-reclaimed (open) roads.

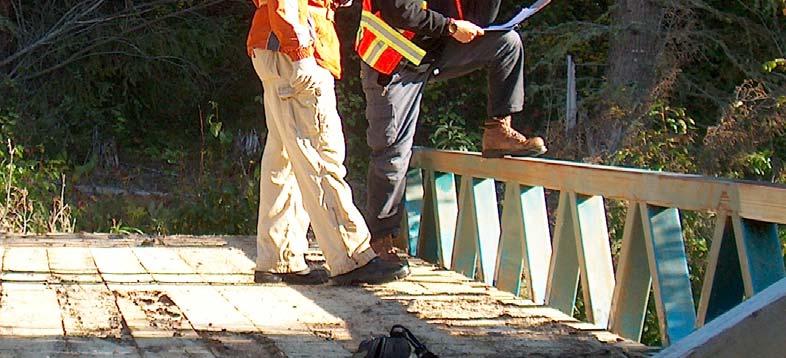
60 Minimize impact watercourse crossings


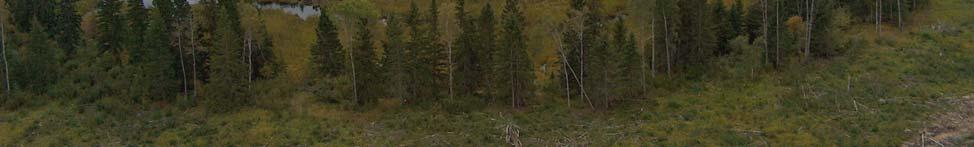
61 Minimize impact riparian buffers
62 15 m, 30 m and 90 m

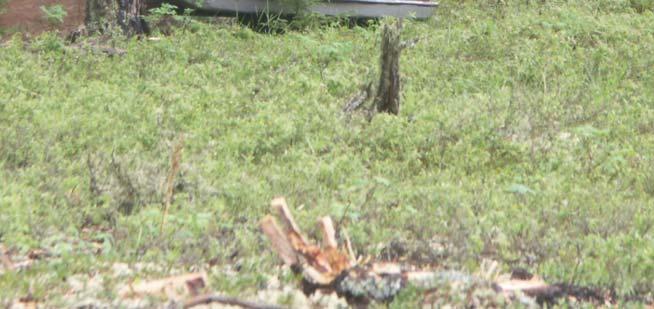
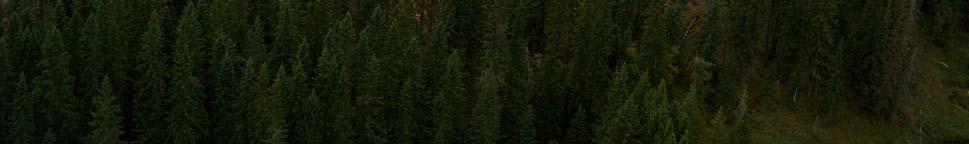
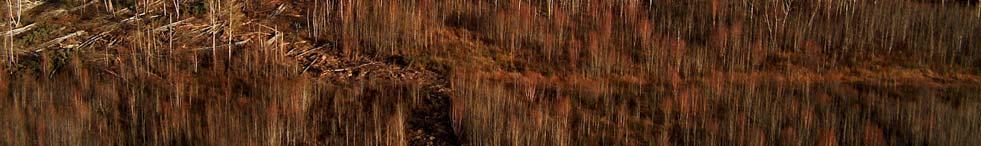
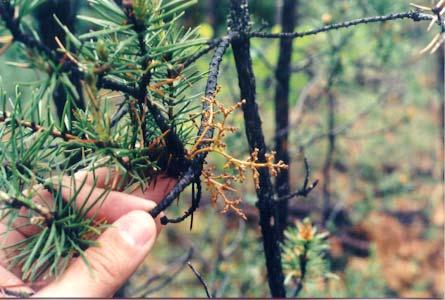
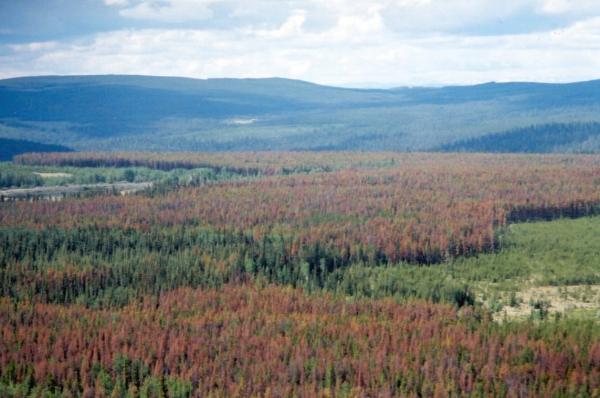
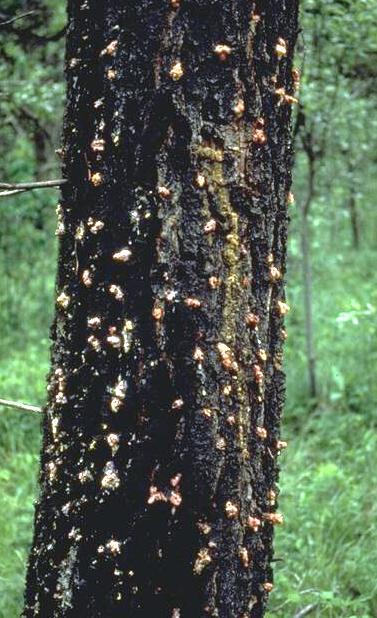
63 Minimize impact create natural landscape patterns
64

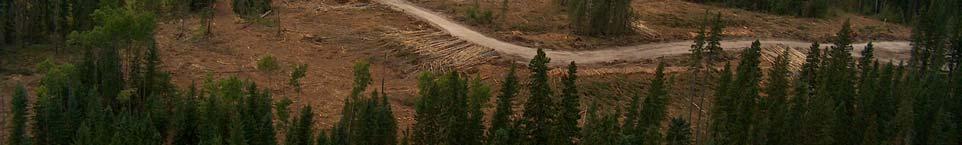
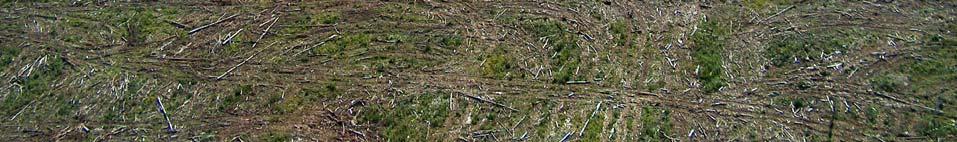
65 Minimize impact forest retention


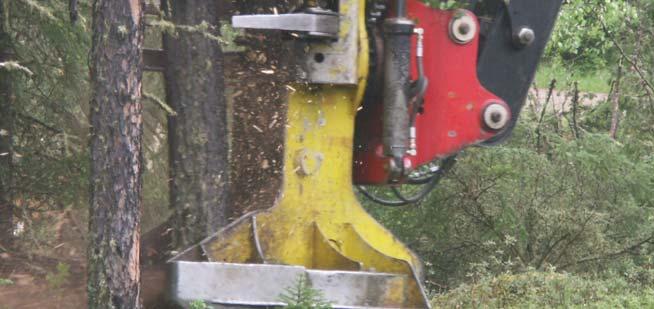
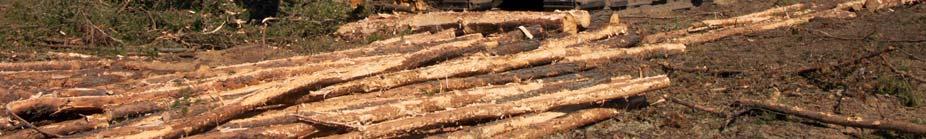
66 Minimize impact salvage harvest
67 Less than 75% of merchantable timber ( ( 15 m height) within any single fire will be harvested; Less than 50% of any single fire will be harvested; Less than 15% of the cumulative area of all fires since 1988 (commencement of FMA area) will be harvested.

68 Balanced harvest costs haul distance
69 Average haul distance to all operating areas of 168 km; Historic actual average volume-weighted haul distance of ~ 130 km (77% of theoretical average haul distance).
70 Forest Health making use of trees impacted by naturally- occurring tree diseases and insect attack ; and promoting the regeneration of disease-free forest stands post-harvest harvest.
71
72 Climate Change anticipating and responding to a range of potential environmental outcomes.

73
74 50% increase in aspen productivity; 20% increase in softwood productivity; Warmer winter temperatures; 5 to 10% increase in liquid water in soils during winter; Increased fire hazard particularly in northern MUs; Increased impacts due to insect outbreaks.

75
76
77

78
79


80 Ongoing distribution of benefits local employment


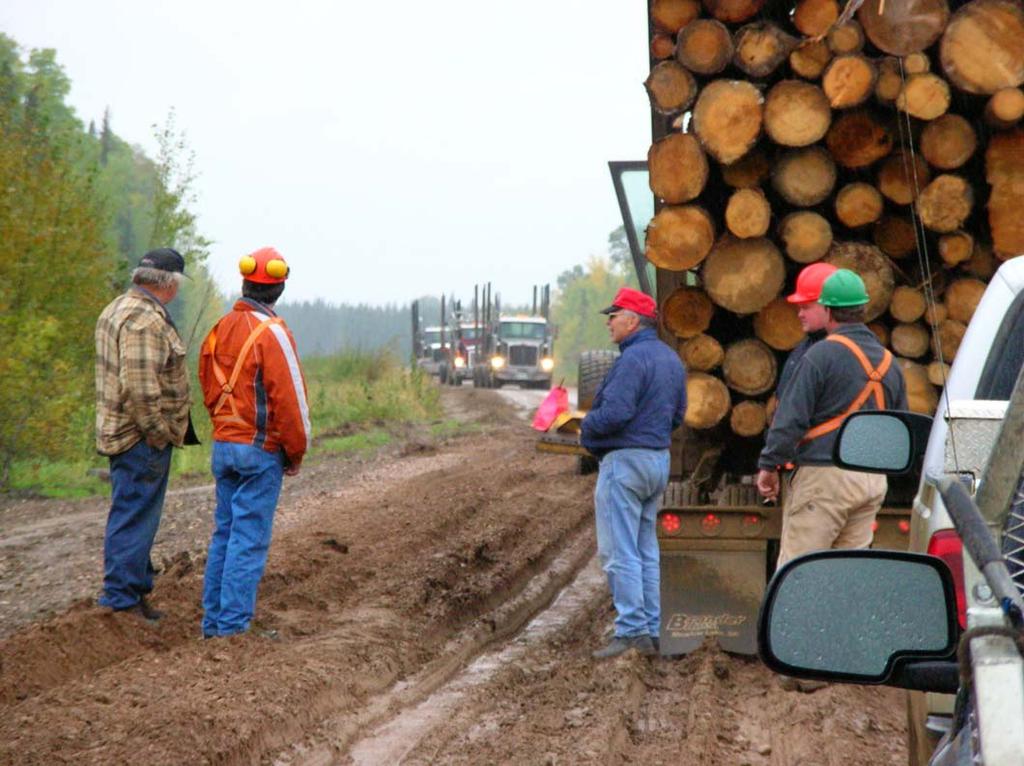
81 Ongoing promotion of safe and comfortable working conditions


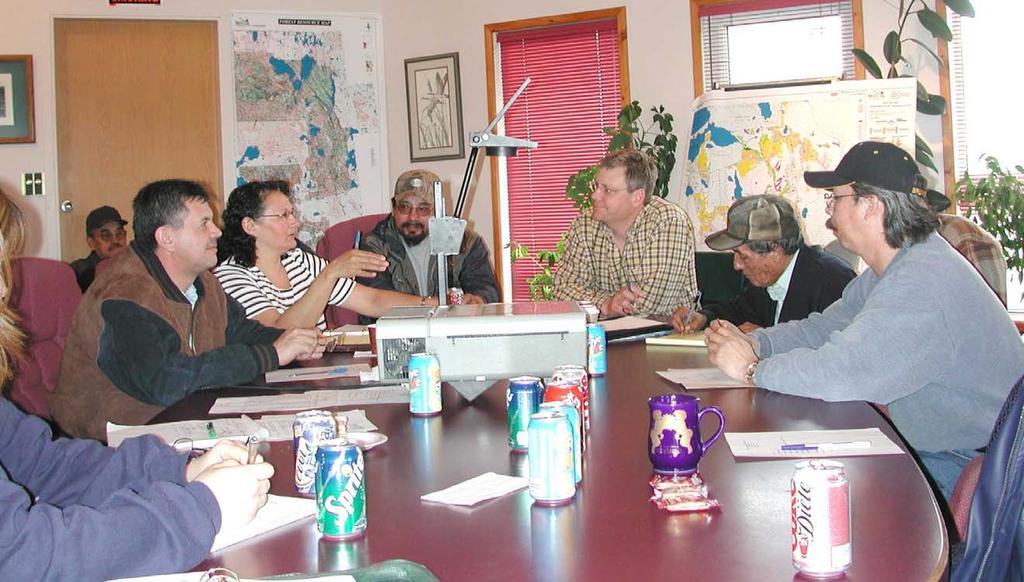
82 Ongoing public involvement
83

84 Ongoing regulatory and forest certification audits
85 Questions or comments?
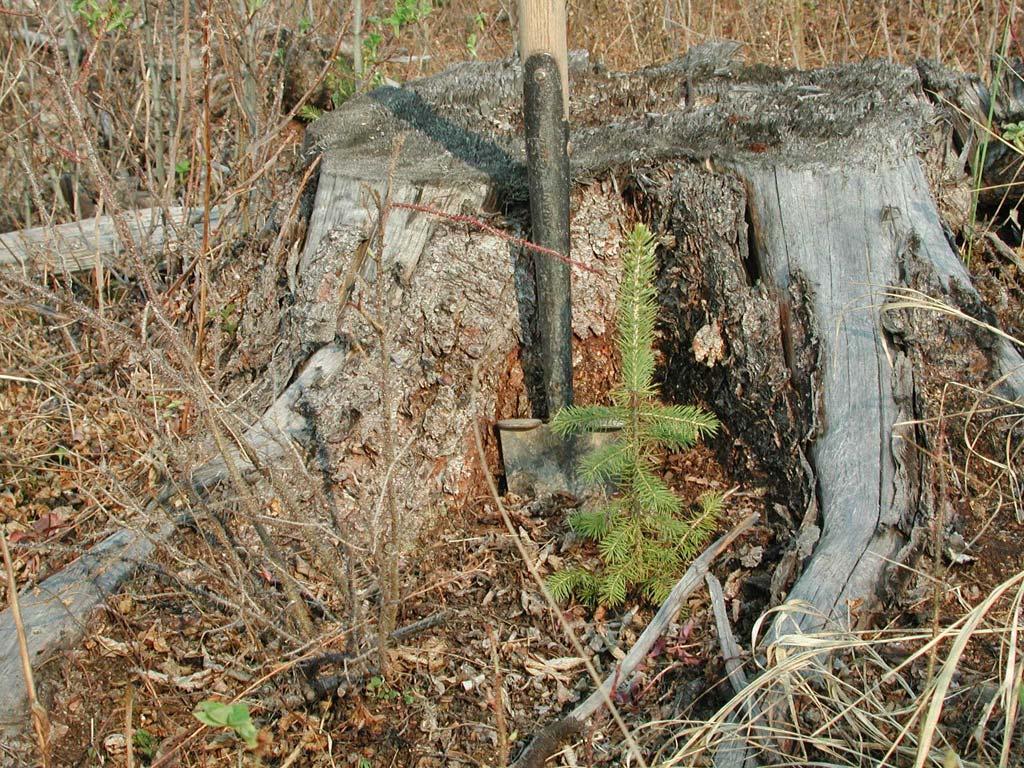
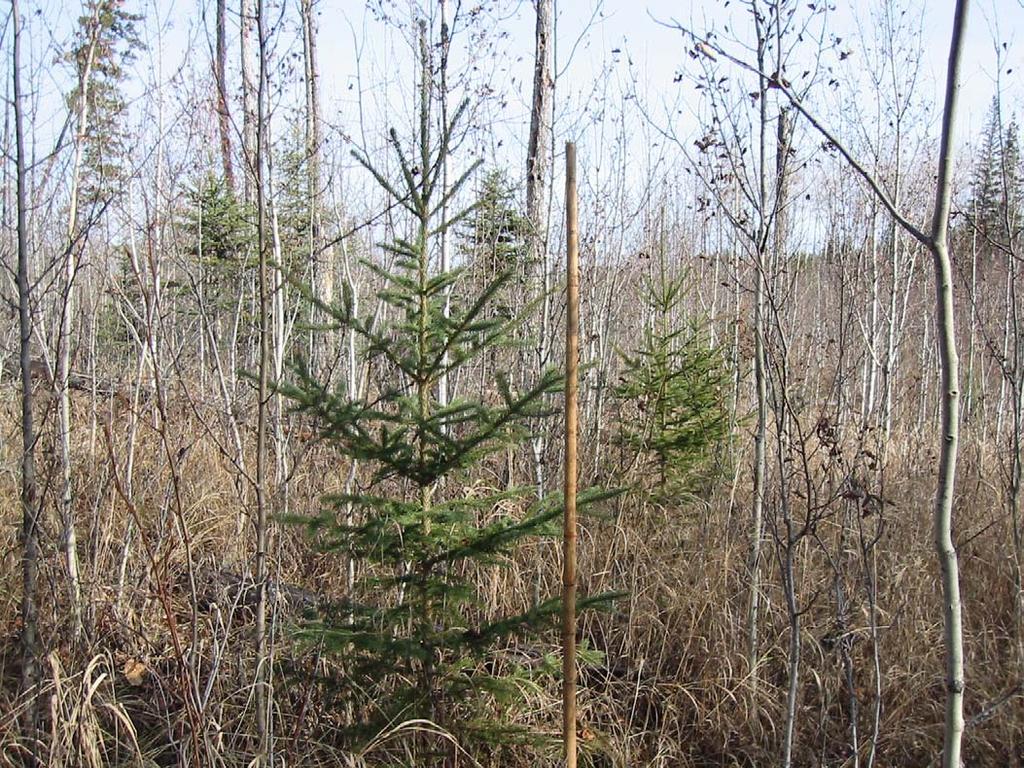
86 Silviculture Ground Rules (SGR) measuring forest renewal success and forecasting future forest condition How will mixedwoods grow (particularly white spruce types)?
87
88
89
90 Total Softwood Tree Height Frequency Distribution Summary of 17 harvest blocks (14 yrs after harvest) 30% Ht avg = 2.49 m 25% 20% 19% 25% 21% % of plots 15% 10% 11% 9% 11% 5% 0% 2% 0.5 m 0.51 to 1.0 m 1.1 to 1.5 m 1.51 to 2.0 m 2.1 to 2.5 m 2.51 to 3.0 m > 3.0 m Total softwood tree height class
91
92
93 Hardwood Density vs. Total Softwood Tree Height Summary of 17 harvest blocks (14 yrs after harvest) Total softwood tree height (m) y = -2E-05x R 2 = ,000 20,000 30,000 40,000 50,000 60,000 70,000 Hardwood density (sph) Total softwood tree height is highly variable across a broad range of hardwood densities.
94
95 35% Softwood Tree Height Increment Frequency Distribution Summary of 17 harvest blocks (14 yrs after harvest) Ht increment avg = 0.27 m 32% 30% 25% 23% 25% % of plots 20% 15% 10% 8% 10% 5% 0% 0.1 m 0.11 to 0.2 m 0.21 to 0.3 m 0.31 to 0.4 m 0.41 to 0.5 m > 0.5 m Softwood tree height increment class 2%
96 Hardwood Density vs. Softwood Tree Height Increment Summary of 17 harvest blocks (14 yrs after harvest) 0.70 Softwood tree height increment (m/yr) y = -2E-06x R 2 = 0.02 Softwood tree height increment is highly variable across a broad range of hardwood densities. 0 10,000 20,000 30,000 40,000 50,000 60,000 70,000 Hardwood density (sph)
97 Total Softwood Tree Height vs. Softwood Tree Height Increment Summary of 17 harvest blocks (14 yrs after harvest) Softwood tree height increment (m/yr) y = x R 2 = ~ 1.8 m Total softwood tree height (m) On average, once softwood trees reach ~ 1.8 m height, average annual height increment exceeds 0.2 m per year.
98 Softwood Tree Density Frequency Distribution Summary of 17 harvest blocks (14 yrs after harvest) 35% 30% 30% 27% % of plots 25% 20% 15% 10% 5% Softwood density avg = 3,281 sph 17% 9% 4% 14% 0% 1,001 to 2,000 sph 2,001 to 3,000 sph 3,001 to 4,000 sph 4,001 to 5,000 sph > 5,000 sph Softwood tree density class

99
100 Hardwood Tree Density Frequency Distribution Summary of 17 harvest blocks (14 yrs after harvest) 30% Hardwood density avg = 11,896 sph 27% 25% 22% 22% % of plots 20% 15% 10% 5% 17% 6% 3% 3% 0% 5,001 to 10,000 sph 10,001 to 15,000 sph 15,001 to 20,000 sph 20,001 to 25,000 sph 25,001 to 30,000 sph > 30,000 sph Hardwood tree density class


101 Free-to-grow Harvest block avg of: 2.0 m tall 0.2 m annual growth by year 14
102 Total Softwood Tree Height Growth Trajectory Block (14 yrs after harvest) 30.0 Total softwood tree height (m) yrs Years from harvest (yrs)
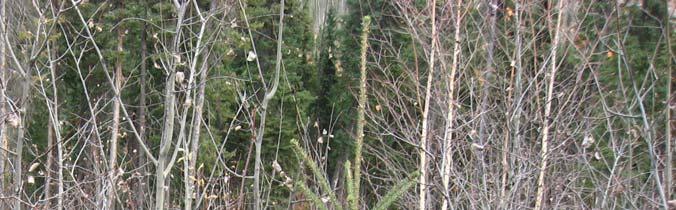
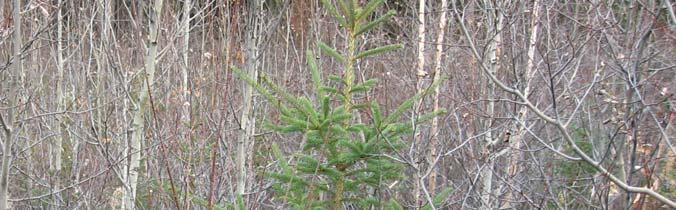
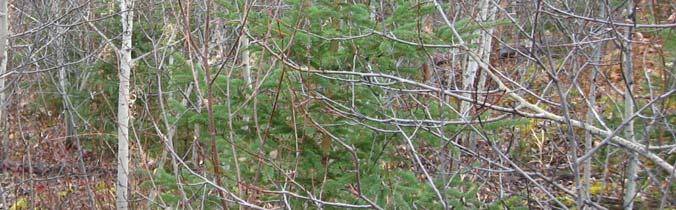
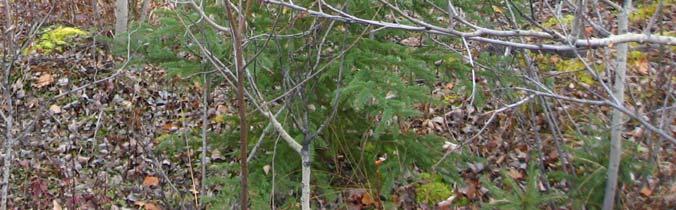
103 Mixedwood animation
104 Questions or comments?
105 4. Wood Supply Analysis YOU BE THE EXPERT! (in three minutes or less)
106 4. Wood Supply Analysis 1. Working forest area = 818,000 ha 2. Rotation age = 80 to 120 (~ 90 yrs) 3. Volume / ha at rotation age ~ 180 m 3 /ha
107 4. Wood Supply Analysis Approximate harvest area per year 1. Working forest area = 818,000 ha 2. Rotation age = 80 to ,000 ha / 80 yrs = 10,225 ha/yr 818,000 ha / 120 yrs = 6,817 ha/yr A harvest area between 6,800 to 10,200 ha / year is sustainable.
108 4. Wood Supply Analysis Approximate harvest volume per year Volume / ha at rotation age ~ 180 m 3 /ha 6,800 ha/yr x 180 m 3 /ha = 1,224,000 m 3 /yr 10,200 ha/yr x 180 m 3 /ha = 1,836,000 m 3 /yr Softwood (35%) Hardwood (65%) 428,000 m 3 /yr 796,000 m 3 /yr (lower) 643,000 m 3 /yr 1,193,000 m 3 /yr (upper) 535,000 m 3 /yr 994,000 m 3 /yr (avg)
109 4. Wood Supply Analysis Softwood Sustainable Harvest Volume Upper Limit 0.72 million Feasible Solution 0.69 million Minimum Estimate 0.6 million Current Softwood Commitments 602,000 (624,500)*
110 4. Wood Supply Analysis Hardwood Sustainable Harvest Volume Upper Limit 1.2 million Feasible Solution 1.1 million Minimum Estimate 0.9 million Current Hardwood Commitments 804,690 (809,490)*
111 4. Wood Supply Analysis Theoretical scenarios what is the range of outcomes? Softwood lower limit: Softwood upper limit: 586,000 m 3 718,000 m 3 Hardwood lower limit: 922,000 m 3 Hardwood upper limit: 1,249,000 m 3 Sustainable harvest w/ management considerations Softwood target: Hardwood target: ~ 600,000 m 3 ~ 950,000 m 3
112 4. Wood Supply Analysis Management Unit 01-Divide 02-Pierceland 03-Big Island 12-Murray Bay 20-Beaver River 04-Waterhen Softwood 65,000 44,000 15,000 24,000 5,000 70, ,000 Hardwood 180, ,000 40,000 50, , , Beauval 08-Canoe Lake 09-Ile a la Crosse 10-Buffalo Narrows 11-Dillon 21-Peter Pond 45,000 55,000 35,000 40, ,000 75, ,000 50,000 60,000 20,000 55, , , ,000
113 Questions or comments?
114 5. Tactical Plan FLEXIBILITY + ADAPTABILITY = VIABILITY Adapt or go extinct
115 5. Tactical Plan Windthrow Fires Climate Change Weather Roads Economics Employment Markets Mills Public


116 5. Tactical Plan Tactical Plan built around the need for flexibility
117 5. Tactical Plan T1 = years 1 to 5 (2007 to 2011) T2 = years 6 to 10 (2012 to 2016) Active time period T3 = years 11 to 15 (2017 to 2022) T4 = years 16 to 20 (2022 to 2026) Future intent T1 T FMP T3 T4
118 5. Tactical Plan T1 = first five years of plan (~ 10 yrs of harvest planned) T2 = second five years of plan (~ 10 yrs of harvest planned) Annual harvest plans are drawn from the pool of potential harvest areas in T1 and T2 Tactical Plan area ~ 2X actual harvest area
119 5. Tactical Plan The planned harvest area for 2007 to 2016 (T1 + T2) represents 9% of the total FMA area and 20% of the working forest area Tactical Plan 9% Remaining FMA area 91%
120 5. Tactical Plan Distribution of harvest?
121 5. Tactical Plan Not furblock or MU based Balanced approach across the FMA area Minimize impact to wildlife habitat Optimal maintenance & viability of contractors Location of merchantable timber Balanced haul distance Optimize truck fleet operations Optimize summer vs. winter ground opportunities *Salvage operations
122 Harvest animation
123 5. Tactical Plan How much harvest?
124 5. Tactical Plan Business as usual for the short term Harvest volume (m 3 ) 1,000, , , , , , , , , ,000 0 Sustainable harvest levels 445,000 Softwood Product type Ongoing harvest levels 850,000 Hardwood
125 5. Tactical Plan Currently exploring a variety of roundwood and wood residue utilization opportunities
126 THANK YOU Questions and Comments?