LiDAR/SAR-based mapping of savannahs forests in Southern Africa
|
|
|
- Alison Sharp
- 5 years ago
- Views:
Transcription


1 Joint GFOI / GOFC-GOLD / CONABIO / SilvaCarbon R&D Expert and Capacity Building workshop on: Regional solutions to forest type stratification and characterising the forest state for national forest monitoring and carbon emissions reporting LiDAR/SAR-based mapping of savannahs forests in Southern Africa Renaud Mathieu 1, Konrad Wessels 2, Russell Main 1, Laven Naidoo 1 1 Earth Observation Research Group, CSIR-NRE 2 Remote Sensing Research Unit, CSIR-Meraka CONABIO, Mexico City June 7-10, 2016


, 35% (1.")
,")


2 Forested landscapes in South Africa Commercial Albany Indigenous Savannahs thicket: and dense plantation: 2.6% woodlands: forests: (3.2M 1.0% 0.4% ha), 35% (1.2M (0.5M dense (42M ha), impenetrable ha), mostly cover pine, ranging vegetation eucalyptus, from 20-70%, with and spiny, acacia biomass often < succulent 50T ha -1 trees and shrubs, height < 5m

 Lack of national spatial information to manage woody resources National Forests Act (84 of 1998) caters for woodlands and recognizes them explicitly as renewable")

3 Context: Some information needs Drastic vegetation changes: management needs Bush encroachment affects M ha in SA, 5-6% tree cover increase per decade food security vs energy security Woody alien invasive affects additional 10 M ha in SA & Lesotho land productivity / water security Carbon stock assessment, legal international reporting obligation (UNFCC) Impact of bush encroachment? (1/3 of C sink in US, (Houghton et al. 1999) Lack of national spatial information to manage woody resources National Forests Act (84 of 1998) caters for woodlands and recognizes them explicitly as renewable energy source. The Act makes provision for research, monitoring, dissemination of information and reporting. Dept. Forestry has legally to report every three years on the status of woodlands to the minister. Medium Term Strategic Framework Outcome 10 led by Dept. Env. Affairs Net deforestation to be maintained at no more than 5% woodlands by 2020 Undertake provincial and national forest resource assessment programs
 is the above increasing or decreasing")
4 Some information needs Drastic vegetation changes: management needs Bush encroachment affects M ha in SA, 5-6% tree cover increase per decade food security vs energy security Woody alien invasive affects additional 10 M ha in SA & Lesotho land productivity / water security Carbon stock assessment, legal international reporting obligation (UNFCC) is the above increasing or decreasing ABG stocks? Focus on national mapping of continuous variables Woody cover, height and biomass Forest types largely (but not only) related to structure, cover / height
: plantation, mountain forests, savannahs 2: Duku Duku area &")
: thicket 4: Alguhlas Plains (Western Cape): alien woody")
5 Geographical context Aim to approaches scalable at national level R&D pilot sites (GFOI) 1: Lowveld, KNP (Mpumalanga, Limpopo): plantation, mountain forests, savannahs 2: Duku Duku area & isimangaliso Wetland Park (KZN): plantation, coastal forests, savannahs, mangrove 3: Addo Elephant Park area (Eastern Cape): thicket 4: Alguhlas Plains (Western Cape): alien woody vegetation, fynbos 4

6 General methods LiDAR/SAR for mapping structure


 / Non")


7 Development of national / regional EO-based woody & forest products JAXA LiDAR ALOS savannas PALSAR Forest (>10% cover) / Non Forest product CSIR locally cal/val ALOS PALSAR (>10% cover) / Non Forest product 2015 R2=0.76 RMSE=11.7% LiDAR indigenous forests LiDAR plantations
 Method: integration of airborne")
 Estimated AGB (Mg.ha -1 ) In situ AGB (Mg.")


8 Biomass mapping in South Africa 2010 CSIR above ground biomass map in Lowveld (75m) Method: integration of airborne LiDAR and ALOS PALSAR using machine learning algorithm (Random Forest) Estimated AGB (Mg.ha -1 ) In situ AGB (Mg.ha -1 ) Le Toan & team 2005/2010/2015 CESBIO-CSIR above ground biomass map in SA forest belt; method: semi empirical methods, use SA National small Carbon number Atlas of above cal plots, ground MIPERS biomass SAR map simulator in Lowveld (forest/ (1km) Method: Combination env parameters), of global water GLAS cloud LiDAR models and & MODIS Bayesian VCF inversion products


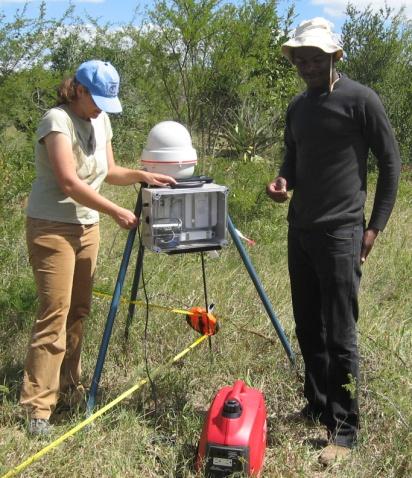
9 Field sampling effort above ground biomass 1 ha square plots (cal/val LiDAR & SAR) Height & DBH Species ~ 100 plots over various veg types Allometric equations SAR scale LiDAR scale Savannahs Plantations Indigenous forests
 Field cover (25x25m plots) Field biomass (25x25m plots) 1.6 T/ha 8 16 32 48 160 T/ha Biomass = 9.")
10 LiDAR cal/val & product development Assessment of accuracy of LiDAR products, development and validation of above ground woody biomass products SAR upscaling LiDAR height LiDAR cover LiDAR biomass Field woody height (single plants) Field cover (25x25m plots) Field biomass (25x25m plots) 1.6 T/ha T/ha Biomass = 9.8 x Mean Woody Height x Canopy Cover + 32 LiDAR-based biomass allometric equations
 Many datasets are collected in SA (and Namibia, Zambia) Power utilities Plantation company National and provincial parks Cities, mines Etc.")
11 National (and SADC) LiDAR database development LiDAR inventory, storage and processing Main stream discrete LiDAR instruments are available (Southern Mapping Company) Many datasets are collected in SA (and Namibia, Zambia) Power utilities Plantation company National and provincial parks Cities, mines Etc.

: volume component does not improve on co-pol HV SAR better predict woody volume")

12 Multi-temporal, polarimetric C-band Radarsat-2 & woody cover in savannahs Season: Winter >> summer > autumn, multi-season improves slightly the model Polarization: HV (best) Scale: optimum around 1ha (100m) Polarimetric decomposition (Freeman, Van Zyl): volume component does not improve on co-pol HV SAR better predict woody volume > cover Settlements Fire break Fire scar Bush clearing Riparian zones Mathieu et al. 2013, Remote Sensing of the Environment Mathieu et al, 2013, Remote Sensing of the Environment


: volume component does not improve on co-pol HV 25m")

13 Multi-temporal, polarimetric L-band PALSAR & woody cover in savannahs Season: Winter >> summer > autumn Polarization: HV & HH during dry season, HV during wet season Scale: optimum around ha (50-100m) Polarimetric decomposition (Freeman, Van Zyl): volume component does not improve on co-pol HV 25m 50m Winter: tree leaf-off, dry grass Summer: tree leaf-on, green grass Autumn: tree leaf-on, dry grass 125m 200m Urbazaev et al. 2015, Remote Sensing of the Environment
 >> C- band (RADARSAT-2) >>> X-band (TerraSAR-X) Random forest > ANN > Decision trees > linear reg SAR better predict woody volume > cover = biomass Woody")

14 Multi-frequency SAR (X, C, L) modelling of woody cover, biomass, and volume in savannahs Woody biomass Winter dual-pol datasets Combined L&C&X-band > L-band (ALOS PALSAR) >> C- band (RADARSAT-2) >>> X-band (TerraSAR-X) Random forest > ANN > Decision trees > linear reg SAR better predict woody volume > cover = biomass Woody volume X-band C-band Woody cover Predicted woody cover (SAR) R² = 0.32 RMSE = t/ha SEP = % R² = 0.78 RMSE = 6.05 t/ha SEP = % L-band R² = 0.60 RMSE = 7.81 t/ha SEP = % X+C+L-band band R² = 0.83 RMSE = 5.20 t/ha SEP = % Naidoo et al, 2014, IS Photogrammetry & Remote Sensing Observed woody cover (LiDAR)

 0.45 0.4 0.")

15 Combined L-band SAR and optical Landsat datasets Scenarios R² RMSE (%) SEP (%) Green woody canopy, dry grass Green woody canopy, green grass Leaf-off woody canopy, dry grass Autumn Spring Summer wet Summer Winter All Four Seasons L-band SAR only L-band SAR and Summer Reflectance Naidoo et al, in Press, International Journal of Applied Earth Observation and Geoinformation Enhanced Vegetation Index (EVI) CSIR 2014 Landsat Reflectance Winter dry L-band SAR and Summer Reflectance

 Main et al 2014, IGARSS Woody cover map ASAR C- band 20 winter summer images 75 m, ASAR hypertemporal")
16 Hypertemporal C-band time series C-band ENVISAT-ASAR WS: 75 m, HH; preparation for Sentinel-1 (free, already large database) Random Forest + = linear regression; temporal filter improves modelling results ASAR predicts woody volume > woody cover; dry > wet, but both improve modelling results ASAR C-band HH produces similar results to ALOS L- band between 6-10 images (mostly acquired in winter) Main et al 2014, IGARSS Woody cover map ASAR C- band 20 winter summer images 75 m, ASAR hypertemporal C-band
, need")
")
17 System design & processing System development, critical for large scale applications Large datasets (spatial & temporal), need maximize automation of processing Framework for testing methodological approach and developing research question (e.g. model, sample selection)


18 National Carbon Atlas 1 km of carbon stocks and flux modelled with uncertainty / GIS & remote sensing data Scholes, Wessels, et al.
19 1. Satellite data requirements Firstly L-band SAR, dual pol, single scene Systematic acquisition of winter season Complement with Landsat / Sentinel-2 Sentinel-1 time series 2. Operational status of the existing technology (R&D, pre-operational, operational) Woody cover: pre-operational Above ground biomass: R&D Woody height: R&D 3. Are your IT/infrastructure needs met? Combined commercial software (GAMMA), and developed script High computing environment
20 1. Describe the obstacles to operational use (challenges) Reduce errors in low biomass & cover environment Mapping gradual change / uncertainty assessment (error propagation, field-to-satellite and changes) Development (funding) of long-term calibration / validation infrastructure Deal with variable phenological status Species mapping Last not least: institutional support 2. Indicate the nature of the R&D required to advance the methods to operational use Interferometry coherence analysis (height assessment and biomass) LiDAR-based AGB modelling 3. What are the timelines for completing the R&D? 3-5 years 4. Describe your satellite data needs for R&D 1. Data for height estimates, interferometry? 2. Long term access to L-band data


21 Int. Symposium of Remote Sensing of Environment May 2017 Pretoria Invitation for special session on forest / carbon applications Suggestion welcome Contact: Renaud Mathieu rmathieu@csir.co.za


22 Acknowledgement Thank you