Using FPInterface to Estimate Availability of Forest-Origin Biomass in British Columbia: Prince George TSA
|
|
|
- Priscilla Carroll
- 5 years ago
- Views:
Transcription


1 Using FPInterface to Estimate Availability of Forest-Origin Biomass in British Columbia: Prince George TSA Technical Report no. 5 - January, 2018 Charles Friesen, Senior Researcher, Fibre Supply Non-restricted Distribution fpinnovations.ca
2 FPInnovations is a not-for-profit worldleading R&D institute that specializes in the creation of scientific solutions in support of the Canadian forest sector s global competitiveness and responds to the priority needs of its industry members and government partners. It is ideally positioned to perform research, innovate, and deliver state-of-the-art solutions for every area of the sector s value chain, from forest operations to consumer and industrial products. Its R&D laboratories are located in Québec, Montréal, and Vancouver, and it has technology transfer offices across Canada. For more information about FPInnovations, visit: Follow us on: Abstract Based on inventory information and a 20-year harvest queue, estimates of the amount of biomass available from forest harvest residues are estimated in $10 increments of delivered cost. For the Prince George Timber Supply Area, 155,000 odt/year is projected to be available at $60/odt at six delivery points in the TSA. Acknowledgements The author thanks Albert Nussbaum of the MFLNRO for supporting this project and removing hurdles to its realization. Barry Snowdon of the MFLNRO was invaluable in providing access to data. His timeliness, thoroughness, and careful explanations made the data useable for this project. Reviewers Andrew Goodison, Manager, Business Intelligence Janet Mitchell, Associate Research Leader, Fibre Supply Stu Spencer, Senior Researcher, Fibre Supply Contact Charles Friesen Senior Researcher Fibre Supply, Forest Operations (604) charles.friesen@fpinnovations.ca 2017 FPInnovations. All rights reserved. Unauthorized copying or redistribution prohibited. Disclosure for Commercial Application: If you require assistance to implement these research findings, please contact FPInnovations at info@fpinnovations.ca.
3 Table of contents 1. Executive summary Introduction Objectives Methods... 6 Overall process... 6 Data acquisition... 6 Data transformation... 6 Biomass equations... 6 FPInterface parameters... 7 Tree species associations... 7 Road classes... 7 General parameters... 8 Topping diameter... 8 Utilization of lodgepole pine and mountain pine beetle-attacked wood: considerations... 9 Time frame... 9 Mill locations... 9 Biomass calculations Results and discussion Summary key results Base case Residue cost calculator, by mill Issues and improvements since the Quesnel TSA analysis Conclusions References Appendix I Residue cost calculator, by delivery point Appendix 2 Output maps and cost-availability tables FPInnovations Page 3
4 List of figures Figure 1. Recoverable biomass, Prince George TSA: 10-year harvest base case Figure 2. Cost of delivered biomass from point of origin, in increments of $10/ODT Figure 3. Cost availability of biomass in the Prince George TSA: 10-year base case Figure 4. Snip of Residue cost calculator, by delivery point List of tables Table 1. Tree species associations... 7 Table 2. Road class associations... 8 Table 3. Utilization of mountain pine beetle-affected stems... 9 Table 4. Harvest availability for bioenergy, by delivery point and cost per ODT: 10-year base case Table 5. Harvest availability for bioenergy, by delivery point and cost per ODT: 20-year base case Table 6. FPInterface parameters: base case Table 7. Cost-availability, delivery to receiving points in the Prince George TSA: 10-year base case.. 15 FPInnovations Page 4
5 1. Executive summary In 2011 FPInnovations used FPInterface to develop and demonstrate a method for estimating available forest-origin biomass in British Columbia s Timber Supply Areas: the test case was the Quesnel TSA. In 2012 the method was refined and applied to the Williams Lake TSA. The method was subsequently applied to the Prince George TSA, and the results from that analysis are reported here. The biomass inventory was based on 20-year harvest and road network plans for Crown land (excluding Woodlot Licenses, Tree Farm Licenses, Community Forest Agreements, and First Nations tenures) provided by the British Columbia Ministry of Forests, Lands and Natural Resources. Delivery points for biomass (i.e., possible bioenergy mill sites) were designated at Prince George, Bear Lake, Dunkley, Vanderhoof, Fort St James, and Fraser Lake. Additionally, the town of Burns Lake, which is actually in the Lakes TSA but is just outside the boundary of the Prince George TSA, was designated as a mill site to see if any volume would logically flow there for least cost. All planned blocks were assumed to be clearcut harvested, processed at roadside, and accessible to comminution operations. The total biomass delivered to the seven delivery points over Years 1 to 10 was projected to be 8.8 million ODT. About 1.5 million ODT (or approximately, ODT/year) were available at $60/ODT. The amount of biomass available in Years 11 to 20 was about ODT/year at $60/ODT. If the acceptable price of delivered biomass rises to $90/ODT, then available biomass would be about three times greater. More than half the available volume at $60/ODT in Years 1 to 10 is available at Fort St James. As the price rises, more volume becomes available at each location. Prince George, Dunkley, and Bear Lake, in particular, receive much more volume in Years 11 to 20 than in the first. 2. Introduction In order to progress toward full implementation of a bioeconomy in British Columbia a key piece of information is needed i.e., a detailed inventory of economically available biomass. To address this need, in 2011 FPInnovations undertook a project in partnership with the Inventory Branch of the British Columbia Ministry of Forests, Lands and Natural Resource Operations (MFLNRO). The specific goals of the project were to develop a process for calculating biomass inventories in Timber Supply Areas in the Central Interior. The projections of biomass availability were based on 20-year harvest and road network plans for Crown land (excluding Woodlot Licenses, Tree Farm Licenses, Community Forest Agreements, and First Nations tenures) provided by the British Columbia Ministry of Forests, Lands and Natural Resource Operations (MFLNRO). In 2011 FPInnovations developed a method for estimating available forest-origin biomass in British Columbia s Timber Supply Areas (TSA), using FPInterface: the test case was the Quesnel TSA (Friesen & Goodison, 2011). In 2012 this method was refined and applied to the Williams Lake TSA (Friesen, 2012), and also to the Prince George TSA, for which the outcomes are reported here. The aim in providing this information is to help decision makers better understand biomass availability when preparing industrial proposals. FPInnovations Page 5
6 Detailed introductory statements describing the background and rationale of this project and the greater project as a whole are in Friesen & Goodison (2011). 3. Objectives As abridged from the report about the Quesnel TSA (Friesen & Goodison, 2011) the objectives were: Calculate biomass supply for volume based tenures in the Prince George Timber Supply Area (TSA). The desired outputs are: a. A map showing delivered cost of biomass from point of origin by cost gradation b. A table showing the amount of biomass delivered at different price points The market value of 1 oven-dried tonne (ODT) of biomass is not clear, but $60 was set as the agreedupon threshold at which to determine commercial biomass availability. 4. Methods Overall process The basic methodology was established during analysis of the Quesnel TSA (Friesen & Goodison, 2011), which was the first TSA to be examined, which was then modified for the Williams Lake TSA analysis (Friesen, 2012). Any differences or points of particular saliency are noted in the Methods section below. Data acquisition Data layers for the Prince George TSA (excluding Woodlot Licenses, Tree Farm Licenses (TFL), Community Forest Agreements, and First Nations tenures), including Vegetation Resources Inventory polygons with attributes and road linework with attributes, were acquired from MFLNRO. The MFLNRO also supplied a 20-year harvest raster. The harvest raster for the Prince George TSA was in four 5-year periods and not in twenty 1-year periods, which was the case for the Quesnel TSA. Data transformation See the report regarding the Quesnel TSA (Friesen & Goodison, 2011) for details about the datatransformation process. Biomass equations FPInterface species are tied to biomass equations. In the analysis of the Quesnel TSA (Friesen & Goodison, 2011), these equations are based on the Canadian national tree above-ground biomass equations (Lambert et al. 2005). Although this equation set included trees from all across Canada, including western and northern Canada, there were very few samples from British Columbia. More recently Ung et al. (2008) have released tree equations for British Columbia (accepted by the MFNRLO) and these were incorporated into FPInterface for the analyses that were undertaken for the Williams Lake, Prince George, and Burns Lake TSAs. FPInnovations Page 6
7 FPInterface parameters Tree species associations Because of the new set of British Columbia tree above-ground biomass equations that were now available in FPInterface, species not previously well represented could be associated with dedicated equations. The species associations for the Prince George analysis are listed in Table 1. Table 1. Tree species associations Vegetation resources inventory cottonwood trembling aspen subalpine fir western redcedar white birch Douglas-fir western hemlock tamarack western larch lodgepole pine spruce white spruce Engelmann spruce Sitka spruce hybrid spruce black spruce FPInterface biomass equation other poplars trembling aspen alpine fir western redcedar white birch Douglas-fir (Interior) western hemlock western larch western larch lodgepole pine white spruce white spruce white spruce white spruce white spruce white spruce Road classes Unlike the data provided for the analysis of the Quesnel TSA, the road data set for the Prince George TSA contained no road classes. However, FPInterface has the ability to assign road classes based on the amount of volume hauled over each section of road. The volume hauled is for merchantable volume, as calculated by FPInterface. The volumes and speeds associated with each road class were assigned according to Table 2. FPInnovations Page 7
8 Table 2. Road class associations FPInterface road class Volume Minimum (m 3 ) Maximum (m 3 ) Road speed Posted speed (km/h) Empty haul a (km/h) Paved Class Class 1 (off highway) Class Class Class Class 4 (operational) Class 5 (winter) a 95% of posted speed. b 85% of posted speed. Loaded haul b (km/h) General parameters The price of fuel can have significant impacts on the model s results. Some equipment in the model can use diesel while other equipment is eligible for marked fuel. A price of $1.25/L was assigned, which was near to commercial rates for diesel at this time but was slightly higher than the current price of marked fuel. The program s default values for productivities and costs of forestry equipment rely on a long history of FPInnovations studies and on other information gathered by FPInnovations. If an operator has specific values or costs they wish to apply to any phase or machine, these can be used instead of the defaults. For this project the default values were used. To verify their suitability the default values were compared with machine costs listed in the Interior Appraisal Manual and were found to be close approximates. Based on a terrain classification system developed by the Canadian Pulp and Paper Association (CPPA) (Mellgren, 1980), average slope for the Prince George TSA was assigned to CPPA Class 3 (20 to 32%). Ground strength was rated as CPPA Class 2 (good), and ground roughness was rated as CPPA Class 2 (slightly even). Topping diameter Although British Columbia regulations require a topping diameter of 10 cm for most merchantable species, the Quesnel TSA analysis (Friesen & Goodison, 2011) used 12.5 cm to reflect more common industrial practise. Rounding in FPInterface meant the topping diameter was set at 13 cm for the Quesnel TSA analysis. Refinements to the program allowed the topping diameter to be set to 12.5 cm for the Prince George TSA analysis. FPInnovations Page 8
9 Utilization of lodgepole pine and mountain pine beetle-attacked wood: considerations As for Quesnel, harvesting standing trees for biomass purposes is not generally considered economic in British Columbia because their recovery must cover full costs of planning, developing and harvesting stands, in addition to costs for biomass recovery operations. However, because of mortality due to mountain pine beetle some whole logs were included for biomass chipping. Although the THLB (timber harvesting land base) proportion attribute includes mortality attributed to mountain pine beetle, because of continuing attack by the beetle and degradation of mountain pine beetle logs, 30% of lodgepole pine volume was removed from availability as merchantable volume. Half of this (15% of total lodgepole pine volume) was estimated to become available for whole log chipping or grinding at roadside and the remainder was counted as loss (Table 3). Table 3. Utilization of mountain pine beetle-affected stems Stems converted to merchantable logs (%) Stems converted to biomass (%) Stems unutilized (%) Time frame The data identified 20 years of harvest. As in the analysis of the Quesnel TSA, an examination of the merchantable output showed a falldown projected for Years 11 to 20. Therefore, and to be consistent with the methodology used for the Quesnel TSA, the base case was considered to be the 10-year harvest, although results for both the 10-year scenario and the 20-year scenario are included here. Mill locations With the largest population in the TSA, Prince George is an obvious location for reception of biomass. Additionally, the communities of Bear Lake, Dunkley, Vanderhoof, Fort St. James, and Fraser Lake were selected for their population sizes, existing mills, relative dispersion, or potential for future development. Additionally, Burns Lake, which is actually in the Lakes TSA but just outside the boundary of the Prince George TSA, was designated as a delivery point to see if volume near there would flow there at least cost. Biomass transport was optimized in the program for whichever delivery point was closest (least cost) to a given block. Biomass calculations The biomass calculations in FPInterface produce an amount of total available biomass once merchantable roundwood has been removed. For this project only biomass transported to roadside was considered recoverable, and biomass likely to remain at the stump was not. Once it is transported to roadside, some biomass becomes unavailable due to handling and technical losses. The remainder is considered recovered biomass. Figure 2 shows this breakdown for the base case 10-year harvest. FPInnovations Page 9

10 Figure 1. Recoverable biomass, Prince George TSA: 10-year harvest base case. 5. Results and discussion Summary key results Key results from the base case runs for 10 and 20 years of harvest are summarized in Tables 4 and 6. More detailed results are in Appendix 2. Table 4. Harvest availability for bioenergy, by delivery point and cost per ODT: 10-year base case Delivery point At $60/ODT (ODT) At $75/ODT (ODT) At $90/ODT (ODT) At $105/ODT (ODT) Yearly at $60/ODT (ODT) Prince George mill Dunkley mill Vanderhoof mill Fraser Lake mill Fort St. James mill Bear Lake mill Burns Lake proxy Total FPInnovations Page 10
11 Table 5. Harvest availability for bioenergy, by delivery point and cost per ODT: 20-year base case Delivery point At $60/ODT (ODT) At $75/ODT (ODT) At $90/ODT (ODT) At $105/ODT (ODT) Yearly At $60/ODT (ODT) Prince George mill Dunkley mill Vanderhoof mill Fraser Lake mill Fort St. James mill Bear Lake mill Burns Lake proxy Total More than half the available volume at $60/ODT in Years 1 to 10 is available at Fort St James (Table 5). As the price rises, more volume is available at each location. Prince George, Dunkley, and Bear Lake, in particular, receive much more volume (at $60/ODT) in Years 11 to 20 (Table 5) than in Years 1 to 10 (Table 4). Given that the available residue biomass consisted of a large percentage of lodgepole pine about 56% in Years 1 to 10 and 41% over both decades and that much of the standing mature pine forest had been attacked by mountain pine beetle, production was checked for falldown in Years 11 to 20. These results reflect the harvest plan and show that the biomass harvest in Years 11 to 20 is only 56% of the first: however, the distribution of biomass means that there is no falldown in availability at the $60/ODT price point. Further, in Years 1 to 10 44% of planned harvest is from non-pine stands, but in Years 11 to 20 80% is from non-pine stands. The lodgepole pine harvest in Years 11 to 20 is 25% of that in Years 1 to 10 in the harvest queue. The base case run showed that a total of 1.5 million ODT would be available at the seven delivery points in Years 1 to 10 at a cost of no more than $60/ODT (Table 4). The available amount nearly triples to 4.8 million ODT at $90/ODT. The total amount of biomass available at any price from the 10- year base case is 8.9 million ODT. Annualized, the base case shows that approximately ODT/year from harvest residue (at $60/ODT) could become available at the seven delivery points during Years 1 to 10 (Table 4), provided it is not already fully or partially allocated. During Years 11 to 20, a slightly lesser amount of ODT/year would be available (Table 5), although the location of the availability increases significantly in the eastern portion of the TSA at Prince George, Dunkley, and Bear Lake. The biomass ratio (the ratio of recovered biomass to recovered merchantable roundwood) for the base case is 37%. This is slightly higher than is usually predicted for harvest residues, partially because 15% of the lodgepole pine stems were designated for biomass. If only slash (harvest residues, no stems) is used to produce biomass, the biomass ratio becomes 21%. Based on other FPInnovations studies, this is a typical number for roadside harvesting in the Central Interior. FPInnovations Page 11
12 Base case Some of the more significant settings in FPInterface for the base case are listed in Table 6. The topping diameter is discussed above in section In the analysis of the Quesnel TSA, the harvest system was set to full tree and then processing activities were set to occur at roadside. However, FPInterface has a harvest setting called full tree with roadside processing that is backed with a different set of data points, and which was used for runs subsequent to the Quesnel run. The change produces a very small variation in results (>2%), so it was decided to use this new setting because it more accurately describes operations typical to Interior British Columbia. Figure 2 presents an isometric map of biomass costs, and Table 7 presents cost-availability data. The Merchantable volume column is biomass from mountain pine beetle stems and the Residues column is biomass from tops and branches. The Residues are cheaper because the costs of harvest are applied to merchantable stems. For biomass from Merchantable volume all costs of harvest are applied to biomass (instead of being written off against roundwood) making this biomass much more expensive. The table shows that purpose-harvested wood for biomass is expensive and is not economic below $100/ODT. The output report for the base case (Appendix 1) shows that comminution costs average $31.80/ODT. For the forest residues (slash) component, the remainder of the costs are transport costs. For the full stem (merchantable stems) component, the average harvest cost is $69.35/ODT 1, comminution costs are $31.80/ODT, and transport costs make up the balance. In Figure 3 the graph of available biomass shows bimodal (two-hump) distribution. The first mode is biomass from forest residues, while the second mode reflects full stems from mountain pine beetleaffected lodgepole pine (merchantable volume). 1 $24.63 x / FPInnovations Page 12
13 Table 6. FPInterface parameters: base case a Run descriptor Base case run name PG10yr-19mar output name PG10yr-19mar-28base transfer yards PG, BearL, VH, FSJ, DU, FL, BurnsL year(s) analyzed 1-10 species attribute linking BC haul speeds graduated haul speeds at 95% / 85% of posted y transport shifts / day 1 transport hours / shift 10 transport days / year 180 transport fuel price / litre $1.25 average slope slash used for biomass y full stem used for biomass n Pl utilization of THLB merch timber (%) 70 Pl unutilized merch used for biomass (%) 15 Pl stems for biomass chipped where? roadside Pl merch stemwood for biomass directed where closest yard chips destination closest yard topping diameter (cm) 12.5 truck used for chips 3-axle truck used for logs B-train harvesting fuel price / litre (x3) $1.25 harvesting shifts / day (x3) 1 harvesting hours / shift (x3) 10 harvesting days / yr (x3) 180 harvesting system full tree with roadside processing on site biomass treatment (roadside) comminution recovery season winter slash freshness fresh slash pre-piled at roadside y grinder size type horizontal 600 kw biomass fuel price / litre (x2) $1.25 biomass hours / shift (x2) 10 biomass shifts / day (x2) 1 biomass days / yr (x2) 180 indirect costs - biomass ($ value) $0.00 indirect costs - harvesting ($ value) $0.00 a The parameters highlighted in yellow indicate differences from those used for the analysis of the Quesnel TSA (Friesen & Goodison, 2011). FPInnovations Page 13
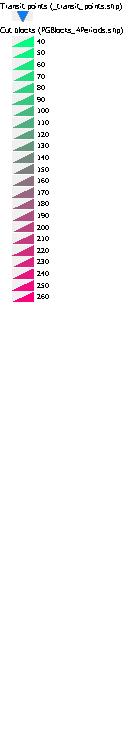
14 Figure 2. Cost of delivered biomass from point of origin, in increments of $10/ODT: 10-year base case. L to R: Burns Lake, Fraser Lake, Fort St James, Vanderhoof, Prince George, Bear Lake, and Dunkley. The cost of biomass from roadside residues is averaged with the cost of residue obtained from mountain pine beetle stems. Blocks closest to the delivery points have the lowest delivered costs and are the greenest in colour. Blocks furthest from the mills are the most expensive and the reddest. FPInnovations Page 14


15 Table 7. Cost-availability, delivery to receiving points in the Prince George TSA: 10-year base case a a The amount of biomass delivered is divided into $10 increments based on delivered cost FPInnovations Page 15
 Figure 3.")
16 Available biomass (ODT) 10,000,000 9,000,000 8,000,000 7,000,000 6,000,000 5,000,000 4,000,000 3,000,000 2,000,000 1,000,000 - Harvest residues MPB full stem Cost availability ($/ODT delivered to nearest mill) Figure 3. Cost availability of biomass in the Prince George TSA: 10-year base case Residue cost calculator, by mill Based on the Excel output from FPInterface, it was now possible to see how much biomass was available at each delivery point at a price point specified by the user. Appendix 1 of this report consists of an Excel workbook, Residue Cost Calculator, by Delivery Point. A snip of the sheet can be seen in Figure 4. The amount of ODT available at a particular price point was determined for each delivery point (labelled transfer yards ). This calculator shows the available biomass from residues only. Because full stem biomass (15% of lodgepole pine volume) does not become available until prices are above $100/ODT, amounts up to $100/ODT also reflect total biomass available. Calculators for both the 10-year base case and the 20-year scenario are included in Appendix 1. Figure 4. Snip of Residue cost calculator, by delivery point FPInnovations Page 16
17 Issues and improvements since the Quesnel TSA analysis Some of the issues encountered during the runs for the Quesnel TSA (Friesen & Goodison, 2011) were addressed and evolved toward resolved during the analyses of the Williams Lake TSA (Friesen, 2012) and the Prince George TSA. The structure of the Vegetation Resources Inventory data is essentially unchanged. The sorting of species into columns by leading species, second species, etc., in a data set was not made available, but FPInnovations developed a way to perform this task that minimized processing time. Similarly, the block aggregation process, which was necessitated by the immense size of the data set that proved too unwieldy for productive run processing and scenario-building in FPInterface, was brought into a manageable time frame through experience and repetition. This aggregation process could still be codified and, if possible, automated for future projects. The MFLNRO s road data set contained many unjoined road intersections and overly long segments that required extensive data cleaning. This proved very time-consuming. As much as possible, road snapping should be accomplished before new projects are undertaken. Perhaps a protocol for snapping can be established. The road snapping completed by FPInterface was targeted, i.e., not all roads in the data set were snapped. In order to speed processing, many roads were eliminated from the dataset. It is possible that sub-optimal paths resulted and estimated costs for delivery were too high, although much effort was directed to avoiding this. A significant improvement was made to FPInterface in that targeted British Columbia biomass equations are now available in the program. These equations, in combination with other minor improvements to the program, should have improved the accuracy of the predicted results. The multiple delivery point function, allowing blocks to be delivered to the nearest mill, which had not been working for the Quesnel runs, was repaired. This allowed the Residue Cost Calculator, by Delivery Point to be constructed; the isometric map showing colour-coded costs to each delivery point by block of origin is now produced directly in FPInterface. Continued enhancement of the program is encouraged in order shorten the model s run time in future projects. 6. Conclusions We developed a method for estimating available forest-origin biomass for British Columbia Timber Supply Areas, using the Quesnel TSA as a test case (Friesen & Goodison, 2011). Based on that experience, estimates were made for the Williams Lake TSA (Friesen 2012) and the Prince George TSA. The biomass inventory was based on 20-year harvest and road network plans for Crown land (excluding Woodlot Licenses, Tree Farm Licenses, Community Forest Agreements, and First Nations tenures) that were provided by British Columbia Ministry of Forests, Lands and Natural Resources. Delivery points for biomass (possible bioenergy mill sites) were designated at Prince George, Bear Lake, Dunkley, Vanderhoof, Fort St James, and Fraser Lake. Additionally, the town of Burns Lake which is just outside of the TSA, was designated as a mill site to see if any volume would logically flow FPInnovations Page 17
18 there for least cost. All planned blocks were assumed to be clearcut harvested, processed at roadside, and accessible to comminution operations. The total biomass delivered to the seven delivery points for Years 1 to 10 was projected to be 8.8 million ODT, of which 1.5 million ODT, or approximately, ODT/year, is available for $60/ODT. The amount of biomass available in Years 11 to 20 was projected to be about ODT/year at $60/ODT. If the acceptable price of delivered biomass rose to $90/ODT, then available biomass would be about three times greater. More than half the available volume at $60/ODT in Years 1 to 10 is available at Fort St. James. As the price rises, more volume becomes available at each location. Prince George, Dunkley, and Bear Lake, in particular, receive much more volume in Years 11 to 20 than in Years 1 to 10. Improvements to the method that was devised using the Quesnel TSA as a test case centered around the use of British Columbia-specific biomass equations and efforts to speed up the transformation of MFLNRO data into a format that was usable by FPInterface. Since then, enhancements have led to improvements in results handling and presentation. Data cleaning associated with the roads layer (road snapping) proved to be very time consuming, so further enhancements related to this are still needed. Run time would be faster if polygon data could be acquired from the MFLNRO in a format more easily digestible by FPInterface. Generally, further enhancement and development of FPInterface are encouraged, in order to speed up the run time of future projects. 7. References Friesen, C. (2012). Using FPInterface to estimate available forest-origin biomass in British Columbia: Williams Lake TSA (Technical Report). Vancouver, British Columbia: FPInnovations. Friesen, C., & Goodison, A. (2011). Using FPInterface to estimate available forest-origin biomass in British Columbia: Quesnel TSA (Technical Report). Vancouver, British Columbia: FPInnovations. Lambert, M-C., Ung, C-H., & Raulier, R. (2005). Canadian national tree aboveground biomass equations. Canadian Journal of Forest Research 35: Mellgren, P.G. (1980) Terrain classification for Canadian forestry. Woodlands Section, Canadian Pulp and Paper Association (CPPA). Ung, C.-H., Bernier, P., & Guo, X.-J. (2008). Canadian national biomass equations: New parameter estimates that include British Columbia data. Canadian Journal of Forest Research 35: FPInnovations Page 18
19 8. Appendix Appendix 1 Residue cost calculator, by delivery point FPInnovations Page 19
20 Appendix 2 Output maps and cost-availability tables Year Base Case Year Base Case FPInnovations Page 20
21 Summary report Biomass [PG10yr-19mar] Territory: Sector: Cut block: Unknown territory Unknown sector <Multiple selection> Statistics - Selected Items Area 213,236.4 ha Number of cut blocks 767 Recovered biomass 8,863,190.0 odt Recovery rate 41.6 odt/ha Biomass odt / Merchantable m³ odt/m³ Delivered products Chips Bundles Trunks and Residues Energy balance Available energy Fuel consumption 100 % 0 % 0 % 32 : 1 32,575,515 MWh 13.0 L/odt Cost Harvesting Biomass recovery Transfer yard Transportation Stumpage fees Road network - Maintenance Indirect costs Total $/odt $/odt 0.00 $/odt $/odt 0.00 $/odt 0.81 $/odt 0.00 $/odt $/odt Revenue Sale value Silvicultural discount 0.00 $/odt 0.00 $/odt Net Profit $/odt 28/03/2012 5:22:39 PM Page 1 of 5
22 Summary report Biomass [PG10yr-19mar] Flow Total 41,404,166.7 odt Merch. vol. harvested 24,170,960.0 odt 60,525,932.3 m³ Available biomass 12,963,401.5 odt Uncut trees 4,269,805.1 odt Natural losses 44,154.3 odt Residue retention 20 % 576,354.1 odt At the stump 2,305,416.2 odt Not recovered 2,305,416.2 odt Technical availability 0.0 odt Roadside 10,037,477.0 odt Not recovered 1,174,286.9 odt Recovery / Available 68.4 % Recovered biomass 8,863,190.0 odt Recovery / Total 21.4 % Products Product name odt odt/m³ odt/ha Lodgepole pine-biomass 3,147, Lodgepole pine (residues) 2,655, Spruce (residues) 1,776, Lodgepole pine-biomass (residues) 569, Trembling aspen (residues) 337, Abies lasiocarpa (Ba (residues) 191, Douglas fir (residues) 149, Paper birch (residues) 15, Western hemlock (residues) 14, Western redcedar (residues) 4, Western larch (residues) ,863, /03/2012 5:22:39 PM Page 2 of 5
![Summary report Biomass [PG10yr-19mar] 767 selected site(s) / 767](/docs-images/90/103044898/images/23-1.jpg "Area covered: 213,236 ha / 213,236 ha 28/03/2012 5:22:39 PM Page 3")
23 Summary report Biomass [PG10yr-19mar] 767 selected site(s) / 767 Area covered: 213,236 ha / 213,236 ha 28/03/2012 5:22:39 PM Page 3 of 5
24 Summary report Biomass [PG10yr-19mar] Recovery summary Volume(odt) Area(ha) Number of cut blocks Biomass recovery location At the stump Roadside 0.0 8,863, , Recovery season Summer Winter 0.0 8,863, , Residue freshness Fresh Brown Brittle 8,863, , Supply summary Recovered biomass to Merchantable volume (odt) Residues (odt) Total biomass (odt) 10 $/odt $/odt $/odt $/odt $/odt , , $/odt 0.0 1,503, ,503, $/odt 0.0 2,960, ,960, $/odt 0.0 4,263, ,263, $/odt 0.0 4,817, ,817, $/odt 0.0 5,382, ,382, $/odt 15, ,537, ,553, $/odt 230, ,600, ,830, $/odt 1,239, ,638, ,877, $/odt 2,063, ,660, ,724, $/odt 2,638, ,667, ,305, $/odt 2,982, ,672, ,655, $/odt 3,077, ,692, ,770, $/odt 3,099, ,696, ,795, $/odt 3,109, ,701, ,810, $/odt 3,123, ,709, ,832, $/odt 3,130, ,712, ,843, $/odt 3,133, ,713, ,847, $/odt 3,136, ,713, ,849, $/odt 3,139, ,715, ,855, $/odt 3,143, ,715, ,859, /03/2012 5:22:39 PM Page 4 of 5
25 Summary report Biomass [PG10yr-19mar] 260 $/odt 3,146, ,715, ,861, $/odt 3,146, ,715, ,861, $/odt 3,146, ,715, ,861, $/odt 3,147, ,715, ,862, $/odt 3,147, ,715, ,862, $/odt 3,147, ,715, ,863,190.0 Maximum cost $/odt $/odt 28/03/2012 5:22:39 PM Page 5 of 5
26 Summary report Biomass [PG20yr-23mar] Territory: Sector: Cut block: Unknown territory Unknown sector <Multiple selection> Statistics - Selected Items Area 356,064.2 ha Number of cut blocks 1606 Recovered biomass 13,825,935.5 odt Recovery rate 38.8 odt/ha Biomass odt / Merchantable m³ odt/m³ Delivered products Chips Bundles Trunks and Residues Energy balance Available energy Fuel consumption 100 % 0 % 0 % 32 : 1 49,895,367 MWh 12.8 L/odt Cost Harvesting Biomass recovery Transfer yard Transportation Stumpage fees Road network - Maintenance Indirect costs Total $/odt $/odt 0.00 $/odt $/odt 0.00 $/odt 0.72 $/odt 0.00 $/odt $/odt Revenue Sale value Silvicultural discount 0.00 $/odt 0.00 $/odt Net Profit $/odt 23/03/2012 1:41:22 PM Page 1 of 5
![Summary report Biomass [PG20yr-23mar] Flow Total 67,648,767.8 odt Merch. vol. harvested 41,429,772.7 odt 105,241,495.4 m³ Available biomass 20,810,209.4 odt Uncut trees 5,408,785.](/docs-images/90/103044898/images/27-1.jpg "7 odt Natural losses 88,078.0 odt Residue retention 20 % 990,437.6 odt At the stump 3,961,750.6 odt Not recovered 3,961,750.6 odt Technical availability 0.0 odt Roadside 15,769,943.")
27 Summary report Biomass [PG20yr-23mar] Flow Total 67,648,767.8 odt Merch. vol. harvested 41,429,772.7 odt 105,241,495.4 m³ Available biomass 20,810,209.4 odt Uncut trees 5,408,785.7 odt Natural losses 88,078.0 odt Residue retention 20 % 990,437.6 odt At the stump 3,961,750.6 odt Not recovered 3,961,750.6 odt Technical availability 0.0 odt Roadside 15,769,943.2 odt Not recovered 1,944,007.7 odt Recovery / Available 66.4 % Recovered biomass 13,825,935.5 odt Recovery / Total 20.4 % Products Product name odt odt/m³ odt/ha Lodgepole pine-biomass 4,004, Spruce (residues) 3,819, Lodgepole pine (residues) 3,315, Lodgepole pine-biomass (residues) 710, Abies lasiocarpa (residues) 672, Trembling aspen (residues) 592, Douglas fir (residues) 509, Paper birch (residues) 89, Western hemlock (residues) 59, Western redcedar (residues) 51, Western larch (residues) ,825, /03/2012 1:41:22 PM Page 2 of 5
28 Summary report Biomass [PG20yr-23mar] 1606 selected site(s) / 1606 Area covered: 356,064 ha / 356,064 ha 23/03/2012 1:41:22 PM Page 3 of 5
29 Summary report Biomass [PG20yr-23mar] Recovery summary Volume(odt) Area(ha) Number of cut blocks Biomass recovery location At the stump Roadside ,825, , ,606 Recovery season Summer Winter ,825, , ,606 Residue freshness Fresh Brown Brittle 13,825, , , Supply summary Recovered biomass to Merchantable volume (odt) Residues (odt) Total biomass (odt) 10 $/odt $/odt $/odt $/odt $/odt , , $/odt 0.0 3,048, ,048, $/odt 0.0 5,894, ,894, $/odt 0.0 7,909, ,909, $/odt 0.0 8,868, ,868, $/odt ,419, ,419, $/odt 33, ,631, ,664, $/odt 279, ,696, ,976, $/odt 1,420, ,724, ,145, $/odt 2,444, ,760, ,205, $/odt 3,382, ,771, ,154, $/odt 3,720, ,799, ,519, $/odt 3,916, ,807, ,724, $/odt 3,945, ,810, ,756, $/odt 3,959, ,814, ,773, $/odt 3,974, ,818, ,792, $/odt 3,984, ,820, ,804, $/odt 3,986, ,820, ,806, $/odt 3,987, ,821, ,809, $/odt 3,993, ,821, ,814, $/odt 3,997, ,821, ,819, /03/2012 1:41:23 PM Page 4 of 5
30 Summary report Biomass [PG20yr-23mar] 260 $/odt 3,999, ,821, ,821, $/odt 4,001, ,821, ,823, $/odt 4,002, ,821, ,824, $/odt 4,003, ,821, ,825, $/odt 4,003, ,821, ,825, $/odt 4,003, ,821, ,825, $/odt 4,004, ,821, ,825,935.5 Maximum cost $/odt $/odt 23/03/2012 1:41:23 PM Page 5 of 5
31
32

 630-4100 Vancouver 2665 East")
 224-3221 Québec 319 rue Franquet")
33 Head Office Pointe-Claire 570 Saint-Jean Blvd. Pointe-Claire, QC Canada H9R 3J9 T (514) Vancouver 2665 East Mall Vancouver, BC Canada V6T 1Z4 T (604) Québec 319 rue Franquet Québec, QC Canada G1P 4R4 T (418)