Tree mortality associated with severe drought and bark beetles in southern California
|
|
|
- Laurence Knight
- 5 years ago
- Views:
Transcription

1 Tree mortality associated with severe drought and bark beetles in southern California Tom W. Coleman Forest Entomologist USDA Forest Service, Forest Health Protection, San Bernardino, CA


2 Bark beetle outbreaks in California and the southwestern U.S. are primarily driven by drought Southern CA Western pine beetle, Ips pine engravers, fir engraver killed ponderosa pine, Jeffrey pine, white fir, respectively AZ and NM Ips pine engravers killed pinyon pine and ponderosa pine

3 2001 to 2004 drought in southwestern U.S. Tree mortality concentrated in areas experiencing extreme to exceptional drought
 Limited data collected during the outbreak Aerial and ground")
4 2003 San Bernardino NF ~3.5 million trees killed (Walker et al. 2005) Limited data collected during the outbreak Aerial and ground survey data

5 Previous drought events in California million acres killed From 1978 California Forest Pest Conditions: Tree mortality was associated with concentration of beetle attacks on weakened or low vigor trees or stands resulting from the drought and adverse growing conditions -site factors (shallow soils, steep slopes on south to west facing aspects), stand conditions (overstocking, over-age), diseases (mistletoes, root decays), man-caused disturbances (recent logging, road and home construction and thinning with inadequate slash disposal) :

6 2012 to 2015 drought in California Four years of consecutive drought primarily impacting central and southern California Exceptional drought conditions

7 2012 to 2015 drought in California Estimated 12.5 million trees killed during aerial surveys in southern California and the Southern Sierra Nevada Mountains ~2 million trees killed mostly on the Los Padres NF Figure 3. Map of area surveyed depicting tree mortality and other damage.

8 Santa Barbara RD, Los Padres NF

9 Mt. Pinos RD, Los Padres NF

10 Los Angeles RD, Angeles NF

11 Mt. Pinos RD, Los Padres NF

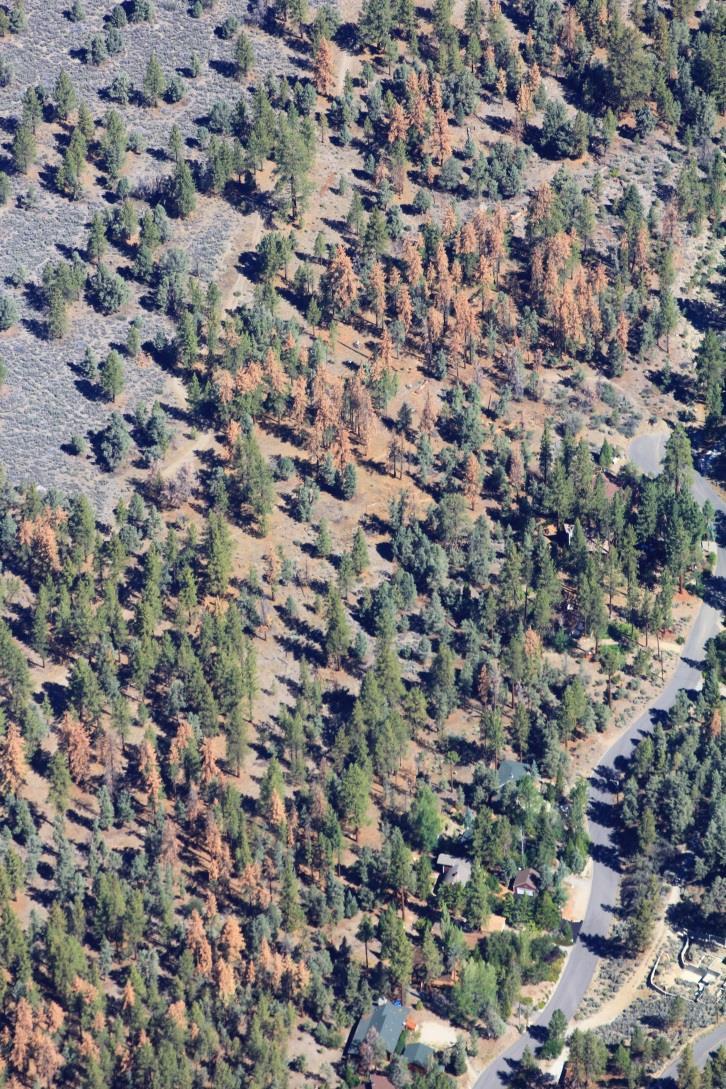
12 Mt. Pinos RD, Los Padres NF

13 Descanso RD, Cleveland NF

14 Tehachapi Mountains

15 Risk of bark beetle-caused tree mortality following various forest management regimes Are bark beetle prevention thinning treatments meeting our objectives??
16 Yes. In summary: We surveyed thinned stands, wilderness areas, recently unmanaged areas, and stands in the Sierra San Pedro Martir NP, N. Baja California, Mexico Thinned stands have significantly lower stand density (198 ha -1 / 80 TPA), basal area (31 m 2 ha -1 / 135 ft 2 ac -1 ), and stand density index (~180) than areas than that haven t recently been thinned and wilderness areas Thinned stands are comparable to stands in the Sierra San Pedro Martir National Park Basal area for thinned/baja stands is (31 m 2 ha -1 / 135 ft 2 /ac) Higher mortality from bark beetles when ponderosa pine basal m 2 ha -1 / ft 2 ac -1 ) (Sanchez-Martinez and Wagner 2002) Bark beetle risk begins ~17 m 2 ha -1 / 74 ft 2 ac -1 ; high risk at 26 m 2 ha -1 /113 ft 2 ac -1 (Negron et al. 2009, Negron and Popp 2004, Bark beetle risk m 2 ha -1 / ft 2 ac -1 with Ips pine engravers in ponderosa pine (Kolb et al. 1998) Thinned and Baja stands are under 200 SDI where bark beetle risk begins

17 Impact of bark beetles during a severe drought Objectives: Determine the level of tree mortality associated with bark beetles across various forest stand conditions and assess interacting tree and site factors Is tree mortality occurring primarily in thinned, unthinned, or wilderness areas? Limited impact data available for southern California (but see Walker et al. 2005)

18 Methods In , areas of tree mortality identified from aerial and ground surveys Forest stand characteristics collected along a transect that bisects the tree mortality. Plots established every 30 m
 fixed plots Basal area (living/dead) with prism plots (10 BAF) Data collected from individual trees: DBH (cm) of individual dead trees, tree species, and bark beetle species Keen")
19 Methods 121 sites identified 624 stands surveyed Stand density (living/dead) with 10 th ac (0.04 ha) fixed plots Basal area (living/dead) with prism plots (10 BAF) Data collected from individual trees: DBH (cm) of individual dead trees, tree species, and bark beetle species Keen s crown class rating (A-D) and mistletoe infection rate (Hawksworth Scale 0-6) PROC GLM in SAS
20 Preliminary results Tree species count Jeffrey pine 910 Coulter pine 605 Ponderosa pine 610 White fir 68 Monterey x knobcone pine 24 Knobcone pine 18 Sugar pine 12 Singleleaf pinyon 11 Gray pine 4 From 2014 to tree species identified 2,262 individual trees surveyed in the impacted areas 12,458 trees surveyed in the prism plots


21 Preliminary results Bark beetle species Bark beetle species surveyed: 6 species identified Tree count California fivespined ips 1,522 Western pine beetle 583 Fir engraver 68 Jeffrey pine beetle 50 Pinyon ips 11 Orthtomicus sabinana 4 Mean percent tree mortality in stands with injury 44% of the stand density killed 49% of the stand basal area killed From in southern CA, 39% white fir mortality 23% pine mortality (Walker et al. 2005) From in AZ, 7-21% in ponderosa pine mortality, but highly variable (Negron et al. 2009)
22 Tree count Preliminary results From , most tree mortality was 73.5 cm (>29 ) for Coulter and ponderosa pines (Walker et al. 2005) DBH class (cm ) Dead tree distribution 82% of the surveyed trees occurred in the 12.7 to 63.5 cm (5 to 25 ) DBH range

 infected White fir had the")
23 Percent mistletoe infection Mistletoe infection rank Preliminary results Jeffrery pine Coulter pine Ponderosa pine White fir Jeffrey pine Coulter pine Ponderosa pine White fir Mistletoe infection Mistletoe infection was very low on dead trees Most infections were mostly light (<2 rank) infected White fir had the highest mistletoe infection rates
 A to D (1 to 4) scale Most trees killed possessed full, continuous")
24 Percent of total trees Preliminary results Jeffrey pine Coulter pine Pondersoa pine Keen's Crown Rating Keen s crown class ranking for Ponderosa pine (1936) A to D (1 to 4) scale Most trees killed possessed full, continuous crowns
25 Tree density/ha Basal area (m^2/ha) Preliminary results 320 t 185 =2.23, P= t 190 =1.77, P= ac ft 2 ac ft 2 ac ac stands with mortality stands with no mortality Tree density and basal area were lower in stands without tree mortality But, tree density and basal area weren t exceptionally high in stands with tree mortality 0 stands with mortality stands with no mortality
26 Basal area (m^2/ha) DBH (cm) Preliminary results F 3,93 =1.03, P= Percent mortality class F 3,115 =2.49, P=0.06 A A A B Percent mortality class Tree mortality (%) was higher in the smaller DBH classes Basal area was lower in sites with higher tree mortality Younger plantations
27
28 Tree density/ha Elevation (m) Preliminary results F 3,52 =0.39, P= Percent mortality class Tree mortality (%) was higher in the lower elevation stands, but not significant F 3,109 =2.28, P= Percent mortality class Stand density was lower in sites with higher tree mortality Younger plantations

29 Preliminary results Generally, more trees died in the smaller diameter classes in low density/basal area stands at lower elevation sites younger plantations


30 Aerial surveys FHP conducts annual aerial detection surveys (ADS) Map damage category, tree species, damage agent, and number of trees killed (TPA or count) Aerial data was ground checked (~100 sites)
 Assessed ADS individually by year Included aspect, elevation, slope, and TPA killed as variables 2012")
31 Aerial surveys Obtained 2012, 2014, and 2015 ADS data Conifer mortality attributed to bark beetles Extracted slope, aspect, and elevation from mapped polygons Number of polygons in analysis 2012: : : 844 Principal components analysis (PC ORD) Assessed ADS individually by year Included aspect, elevation, slope, and TPA killed as variables 2012
32 Preliminary results 2012: Eigenvalues: Axis 1: 1.217, Axis 2: 1.33 Percent variance explained 1 st and 2 nd Axes: 58.7% Axis 1: elevation, TPA killed Axis 2: slope, aspect P< : Eigenvalues: Axis 1: 1.134, Axis 2: Percent variance explained 1 st and 2 nd Axes: 52.4% Axis 1: aspect, elevation Axis 2: TPA killed, slope 2015: Eigenvalues :Axis 1: 1.13, Axis 2: Percent variance explained 1 st and 2 nd Axes: 53.8% Axis 1: aspect, elevation Axis 2: slope, TPA killed
 low NE")
33 Elevation high Preliminary results Slope flat low steep TPA killed high Aspect SW (drier) low NE (moister)
34 Preliminary results Higher tree mortality steeper, drier sites at lower elevation
35 Summary Impact of bark beetles and drought: Bark beetles killed 44% of the trees in impacted stands in southern CA CA fivespined ips was the most active bark beetle No relationship among dead trees with mistletoe infection and Keen s crown class rating Bark beetle-caused tree mortality was more prevalent in the smaller diameter size classes Density and basal area were greater in stands with mortality (but not strong) Tree mortality was more prevalent early in the drought on steeper, drier stands found at lower elevation sites What did bark beetles and drought teach us: Don t plan trees off-site and reduce your tree stocking even more Future work: Continue surveys Assess growth of living trees and trees killed by bark beetles and site characteristics Changes in fuel loading associated with the recent tree mortality event Jeffrey pine, ponderosa pine, and singleleaf pinyon in southern CA and southern Sierra Nevada Mtns
36 Acknowledgements My technicians: Adrian Poloni, Mathew Kellenberger, Benjamin Lehan, Courtnay Pogainis, Michael Jones, Daniel Betancourt, Kalee Koeslag, Stacy Hishinuma, Adrianna Cipollone, Angelica Mendoza, Grayland Walter, and Jonathan Morales Jeff Moore and Adam Ellis, Forest Health Protection and Monitoring, Region 5 Andrew D. Graves, USDA Forest Service, Forest Health Protection, Albuquerque, NM Funding: USDA Forest Service, Forest Health Protection, Regions 5 and 3
37 Questions?