Pat L. Shaver USDA-Natural Resources Conservation Service West National Technology Support Center Portland, OR
|
|
|
- Samson Garrett
- 5 years ago
- Views:
Transcription


1 Pat L. Shaver USDA-Natural Resources Conservation Service West National Technology Support Center Portland, OR
2 Westoby et al. (1989) Management influences and models Archer (1989) Domain changes from herbaceous dominated to woody dominated Friedel (1991) Thresholds Olivia et al. (1998) Patagonia West (1999) - Successional change in sagebrush steppe Stringham et al. (2003) Consistent definitions Briske et al. (2008) - Developing resilience based STM s Bestelmeyer et al. (2009) - Development and application Many others


3 STATES STATE - a recognizable, resistant and resilient complex of two ecosystem components, the soil base and the vegetation structure soil - developed through time from specific parent material, climate, landscape position and interaction with biota - determine the site s capability - interaction between soil and vegetation determines functional status of site and inherent resistance to change Stringham, et al., 2003
4 Vegetation attribute(s) STATES time


5 TRANSITIONS TRANSITION - the trajectory of a change - change is precipitated by natural events, management actions, or both - degrades the integrity of one or more of the state s primary ecological processes beyond the point of self repair THRESHOLD- boundary in space and time between two states - irreversible for practical purposes without input of outside energy Stringham, et al., 2003
6 Vegetation attribute(s) TRANSITIONS thresholds transition time
7 ECOLOGICAL RESILIENCE Amount of change required to transform a system from being maintained by one set of mutually reinforcing processes to a different set of processes. (Briske et al 2008)
 Low resistance and low resilience (Modified from Seybold, et al,")
8 Process function (% of capacity) Disturbance High resistance Low resistance and high resilience Time (years) Low resistance and low resilience (Modified from Seybold, et al, 1999)
9 Vegetation attribute(s) STATES thresholds Feedback mechanisms transitions time
10 COMMUNITY PHASES -Different assemblages within a state that do not represent a state change since a threshold has not been crossed - Vegetation dynamics within a state (succession/regression and/or non-equilibrium) COMMUNITY PATHWAYS - Causes of change between plant communities
11
12 m elevation Flat to rolling dune topography Aeolian sand deposits Deep, fs, lfs; lfs, fsl cm average annual precipitation 75 % of precipitation comes during late growing season (late July, August and early Sept.) day growing season (early May to early Oct)
 Treeless but very grassy with sabinos (junipers) dotting it (Bandelier,")
13 Golden-grassed plains Spanish mission early 1600 s (Horgan, 1954) Abandoned 1671 Good grass cover, scattered piñon and juniper (McLeullough, 1882) Treeless but very grassy with sabinos (junipers) dotting it (Bandelier, 1884)
14 Fire maintained grassland or savannah aspect (Natural and human ignition) 4 6 years (Frost, 1998) 6 11 years (Baisan & Swetnam, 1997) years (Allen, 1989) Drought/Wet Years Herbivory Blacktailed Jackrabbit Pronghorn Antelope
15 Tall and mid warm season bunchgrasses Mid and short warm and cool season grass understory Forbs variable with season and weather Woody spatially and temporally variable depending on time since last fire Annual Production ~ 1200 kg/ha
16 Deep Sand Savannah
17 Large herds of livestock < 1 million sheep & 137,000 cows million sheep & 1.3 million cows million sheep & 1 million cows ,000 sheep & 1.5 million cows ,000 sheep & 1.5 million cows Fire suppression Lack of fine fuel Active suppression


18 One-seed juniper > 4 m tall Juniper canopy cover 15-25% Annual herbaceous production kg/ha


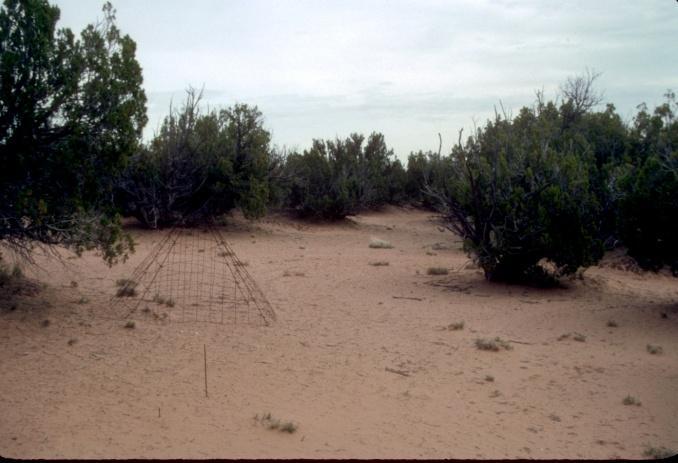

19 Deep Sand Savannah
20 Vegetation attribute(s) STATES thresholds Feedback mechanisms transitions time
21 State-and-Transition Model 1.0 Reference State 1.1a Warm season tall and mid grasses 1.2a Warm season mid and tall grasses and one-seed juniper < 4 tall R1a T1a R3b 2.0 Juniper State 3.0 Eroded State R3a One-seed juniper > 4 tall Shrubs Warm season mid grasses One-seed juniper active wind and water erosion 2.2a 2.1a T2a One-seed juniper > 4 tall and warm season mid grasses

22 How do you evaluate the quality of the information? Go to the source, or people who knew it Compare different sources Peer-reviewed?
23 Annual Herbaceous Production by Year 700 Mean±SD Kg/Ha Year Control Treated All Parts of Soil Profile Exceeding 1.5 MPa Moisture 1.2 Mean±SD Proportion of Time Year Control Treated
24 % Juniper Canopy Cover Juniper Canopy Cover by Year F(5, 10)=5.2309, p= Vertical bars denote 0.95 confidence intervals YEARS Treatment Control Treatment Treated & 2003 Litter Treated Control mean p mean p Dunnett s 1985 and 2003 p=0.966 % Bare Ground Percent Bare Ground by Year by Treatment F(5, 10)=3.4029, p= Vertical bars denote 0.95 confidence intervals YEARS Control Treated
25
26 a Aggregate Stability All Surfaces Vertical bars denote 0.90 conf idence interv als a a b b b b b 2.0 Average St Ranch Treated Control Aggregate Stability All Subsurfaces Vertical bars denote 0.90 confidence intervals a a b a b b a b Av. All Subsurface Ranch Treated Control
27 Nonhierarchical multivariate exploratory method k-means clustering was used to test the proposed model. All data elements used except surface soil stability Clustering was preformed with 2, 3, 4 and 5 clusters. Highest average Euclidean distance determined the optimum number of clusters
28 Based on the data used, k-means clustering shows that a 3 state model is optimal 2 Clusters 3 Clusters 4 Clusters 5 Clusters Distance Number of treated and control transects in the resulting 3 states Total Treated Control State State State
29 Surface soil stability data used to validate the k-means clusters. State Mean Stnd Dev Stnd Error C.I. -95% +95% Mean Soil Surface Stability Ratings by State F(2, 83)=113.39, p= Vertical bars denote 0.95 confidence intervals 4.5 Soil Surface Stability State
30 Reference State 1.0 Juniper State 2.0 Eroded State 3.0 Surface Soil Stability > < 2.4 Subsurface Soil Stability > < 1.6 Canopy Gaps > 200cm <10% 10% - 20% > 28% Basal Gaps > 200cm < 17% 17% - 29% > 33% Basal Cover >7% 5% - 9% < 4% Juniper Foliar Cover <17% 18% - 27% >20% Herb. Foliar Cover >45% >45% <41% Bare Ground <33% 28% - 37% >39% Values are within 95% C.I. of the mean.
31
32 State Reference State Juniper State Eroded State Community Phase Surface Soil Stability > <2.1 Subsurface Soil Stability > <1.5 Canopy Gaps > 200cm <8% 12 27% 7 13% 18 33% >29% Basal Gaps > 200cm <15% 15 36% 12 25% 29 55% >30% Basal Cover >7% 5 9% 5 10% <4% <4% Juniper Foliar Cover <8% 11 24% 18 28% 16 32% >29% Herb. Foliar Cover >46% 40 54% 47 57% 32 46% <30% Bare Ground <32% 24 42% 27 37% 33 47% >39% Value ranges within 95% C.I. of the mean
33 State-and-Transition Model 1.0 Reference State Warm season tall and mid grasses Surface Soil Stability >4.3 Subsurface Soil Stability >2.7 Canopy Gaps <8% Basal Gaps <15% Basal Cover >7% Juniper Foliar Cover <8% 1.1a 1.2a Warm season mid and tall grasses and one-seed juniper < 4 tall Surface Soil Stability Subsurface Soil Stability Canopy Gaps 12-27% Basal Gaps 15-36% Basal Cover 7-9% Juniper Foliar Cover 11-24% T1a R1a 3.0 Eroded State One-seed juniper active wind and water erosion Surface Soil Stability <2.1 Subsurface Soil Stability <1.5 Canopy Gaps >29% Basal Gaps >30% Basal Cover <4% Juniper Foliar Cover >29% R3b R3a T2a 2.0 Juniper State One-seed juniper > 4 tall, Shrubs Warm season mid grasses Surface Soil Stability Subsurface Soil Stability Canopy Gaps 7-13% Basal Gaps 12-25% Basal Cover 5-10% Juniper Foliar Cover 18-28% 2.2a 2.1a One-seed juniper > 4 tall and warm season mid grasses Surface Soil Stability Subsurface Soil Stability Canopy Gaps 18-33% Basal Gaps 29-55% Basal Cover <4% Juniper Foliar Cover 16-32%

34 1.0 Warm season bunchgrass Warm season tall and mid grasses Canopy Gaps <8% Basal Cover >7% Juniper Foliar Cover <8% 1.2a 1.1a Warm season mid and tall grasses and one-seed juniper < 4 tall Canopy Gaps 12-27% Basal Cover 7-9% Juniper Foliar Cover 11-24% 1.1a: time since last fire or by a series of dry years followed by wet years. opportunity for juniper seedling establishment increases. decreases herbaceous production, crown cover and organic matter input into the soil, allow juniper seed germination and establishment 1.2a: fire frequency allows for ground fires that remove juniper seedlings and established plants less than 1.5 meters tall T1a: slow variables and triggers for this transition are the elimination of fire due to decrease in fine fuels allowing juniper canopy. The threshold values surface soil stability < 3.4, basal cover <7%, juniper foliar cover >24%, juniper >4 tall Juniper State R2a T1a R2a: removal of juniper canopy cover to < 5% with minimal soil surface disturbance management actions that increases herbaceous production and favors the establishment and growth of warm season tall and mid grasses One-seed juniper-shrubs warm season mid grasses Canopy Gaps 7-13% Basal Cover 5-10% Juniper Foliar Cover 18-28% 2.2a 2.1a One-seed juniper and warm season mid grasses Canopy Gaps 18-33% Basal Cover <4% Juniper Foliar Cover 16-32% 2.1a: juniper canopy increases with time since last fire...other management action to reduce juniper canopy increase in juniper canopy decreases shrub and herbaceous production and cover shrubs and tall grasses decrease or are eliminated drought years followed by wet years will allow for increase in juniper establishment a: management actions that decrease juniper canopy and increase herbaceous and shrub production can include prescribed burning, chemical or mechanical brush management, while other management actions are aimed at increasing herbaceous production R3a 3.0 Eroded State One-seed juniper active wind and water erosion T2a T2a: slow variables and trigger for this transition are increase in juniper seedling establishment and juniper cover caused by management actions that lead to decreased herbaceous production and decreased organic matter inputs by lack of management actions that actively reduce juniper canopy cover threshold values...surface soil stability <2.4, bare ground >40%, canopy gaps >30%, basal cover <4%. R3a: management and restoration planned must decrease juniper canopy to <5%...little or no surface disturbance, management actions must increase herbaceous production allow for litter accumulation improve organic matter inputs to stabilize soil surface

35 Thank You