Seed Use Efficiency: From the Forest to the Forest
|
|
|
- Jeffery Gaines
- 5 years ago
- Views:
Transcription
1 Seed Use Efficiency: From the Forest to the Forest Yousry A. El-Kassaby Faculty of Forestry University of British Columbia Vancouver, B.C. Canada Seed Use Efficiency Meeting Langley Coast Hotel and Convention Centre Langley, BC July, 2008

2 Acknowledgements unding: FGC of BC, FFT, The Johnson s Family Endowment & NSER Collaborators: MoF&R, PRT, Forest Industry Research Associates, PDFs and Graduate Students

3
4

5
6 Outline Background: The Bigger Picture Tree Improvement Delivery System: Seed orchard genetics Seed production Clonal personality : Reproductive output Germination behaviour Interaction between Biology and Production Can we find a happy compromise? Mathematics of Germination The Status quo Syndrome! The Way Forward: We need your help!!

7 Background: The Bigger Picture
8 Tree Improvement Delivery System Biological Constraints Natural Populations Selection End-Product Plus-trees Breeding Testing Advanced generations Phenology Fertility variation Contamination Seed issues Germination Dormancy Thinning Culling Seed orchards Nurseries Regeneration Seeds Seedlings Plantations
9 Tree Improvement Delivery System Tree Improvement = Breeding + Delivery Maximize gain per unit time, effort, cost Rate of conversion to high gain

10 Seed Orchard Genetics Reproductive Phenology

11 Seed Orchard Genetics Reproductive output: energy vs. success

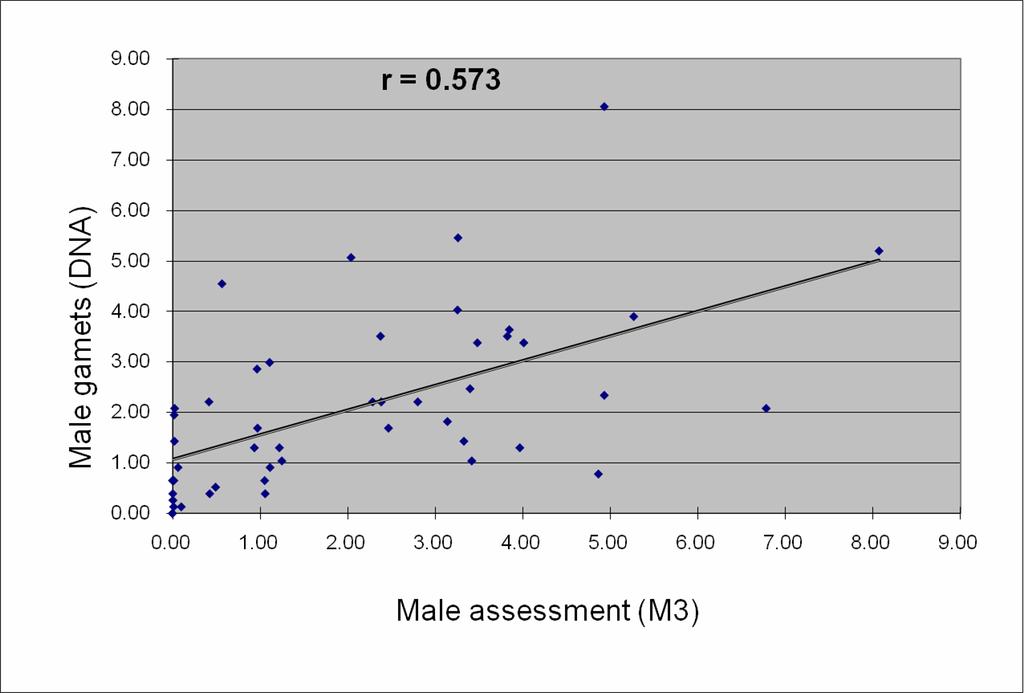
12 Seed Production Who is doing what to whom and When? Molecular markers Pedigree reconstruction PRT: Lodgepole pine seed orchard
13 Identifying Pollen Donors TIB: Western larch seed orchard
14
15 Extracting seedlots genetic parameters 1- Genetic worth: Volume = 10.5% Wood density = -1.2% 2- Effective population size (N e ) = Contamination rate = 10.9% 4- SMP success rate: Parents in orchard = 25.6% Parents outside = 7.4% 5- Selfing rate = 16.7%

16 Streamlining the Process
17 Streamlining the Process

18 Clonal Individuality Cone vs. seed count

19 Clonal Individuality Germination Behaviour

20 Clonal Individuality Dormancy

21 Clonal Individuality Aging
22 Clonal Individuality Germination parameters genetic control Species GC R 50 PV GV Douglas-fir Lodgepole pine Pacific silver fir Sitka spruce Western hemlock Western redcedar Paper birch Sitka alder
23 Clonal Individuality Why such high genetic control? Seed parent Contribution Gymnosperm seed Pollen parent seed coat (2n) embryo (n) megagametophyte (n) embryo (n)

24 Clonal Individuality 2 nd gen. Bulkley FS Pl families


25 Interaction between Biology and Production Nursery Genetics 15 parents, equal contribution Fd, Hw each with 26,000 seeds 1, 2, 3 seeds/cavity and family blocks Randomized, each seed tracked


26 Interaction between Biology and Production Nursery Genetics
27 Interaction between Biology and Production Nursery Genetics Chain of custody No germ Seed # Thinned Germ Dead Remained Culled Survived Plug
28 Interaction between Biology and Production Germination Speed (R 50 ) Family # Douglas-fir Western hemlock

29 Interaction between Biology and Production Multiple sowing % of Variation Df Germination Thinning Survival Culling 2 seeds/cavity seeds/cavity Hw 2 seeds/cavity seeds/cavity

30 Interaction between Biology and Production Single sowing 1 seed/cavity % of Variation Df Germination Thinning Survival Culling Random 65 n/a 4 31 Family block 20 n/a Hw Random 19 n/a Family block 8 n/a 0 92 Reduced productivity Specs! Species-specific growth habits


31 Interaction between Biology and Production The Perfect Solution Mini-plug
32 Mathematics of Germination The 4-parameters Hill function Germination % Days a = germination capacity (GC) b = representative of shape and steepness of the germination curve c = germination speed (R 50 ) Lag = time at germination onset
33 The Status quo Syndrome ISTA s recommendation 3 wks stratification Un-stratified > 3wks > 5wks > 7wks* Should we follow ISTA rules?
34 The Status quo Syndrome
35 The Status quo Syndrome Logepole pine seed shortage 100 Germination % (2001) Germination % (2002) Unstratified 1wk stratification 2wks stratification 3wks stratification 4wks stratification 5wks stratification Day
36 The Status quo Syndrome Logepole pine seed shortage 1- Challenged ISTA s seed pretreatment prescriptions 2- Extended stratification from 3wks 5wks 3-2% increase in germination sowing request: 115.4M seedlings 5- Factor 2% 126.5M +11M seedlings 6- Increased utilization of 9.6% 7- Additional 6,900 ha (@1,600/ha)
37 The Status quo Syndrome Logepole pine seed shortage Germination % Germination % Stratification duration (wks)
38 The Status quo Syndrome Logepole pine seed shortage Lessons from the nursery trial: Inconclusive test (timing differences) Sowing factor = original lab germination Germination improvement increase in seedling production Next step: Volunteers/collaborators Multiple sites multiple seedlots Willingness to alter sowing factors to reflect improved germination
39 The Status quo Syndrome Logepole pine seed shortage Dual approach (lab and nursery) 2-3 seedlots/site 3 sites 20 blocks/treatment (control and various strat times) Change sowing factor (based on germination improvement level) Collect germination data Collect seedling recovery/block/treatment Funds may be available to compensate for additional work

40 Questions