Energy, Climate Change, Air Quality and Urban Greening
|
|
|
- Eustace Carr
- 5 years ago
- Views:
Transcription

1 Energy, Climate Change, Air Quality and Urban Greening Decision-Maker s Seminar Sacramento, CA June 21, 2010 Greg McPherson US Forest Service PSW Research Station Davis, CA
 Total leaf area:?? (sq.ft.")
2 Tree Quiz Bradford Pear 9 years old 9 inch dbh 28 ft. tall 19 ft. spread Number of leaves:?? (#) Total leaf area:?? (sq.ft.) Rainfall capture:?? (gal)
3 Tree Quiz Bradford Pear 9 years old 9 inch dbh 28 ft. tall 19 ft. spread Number of leaves: 88,908 Total leaf area: 3,846 sq ft Rainfall capture: 55 gal
4 Today

5 Today Single Tree Benefits Scale-Up Initiatives Examples

6 Benefit-Based Approach Structure Function Management Value

7 Large Tree West Side Average Annual Benefits
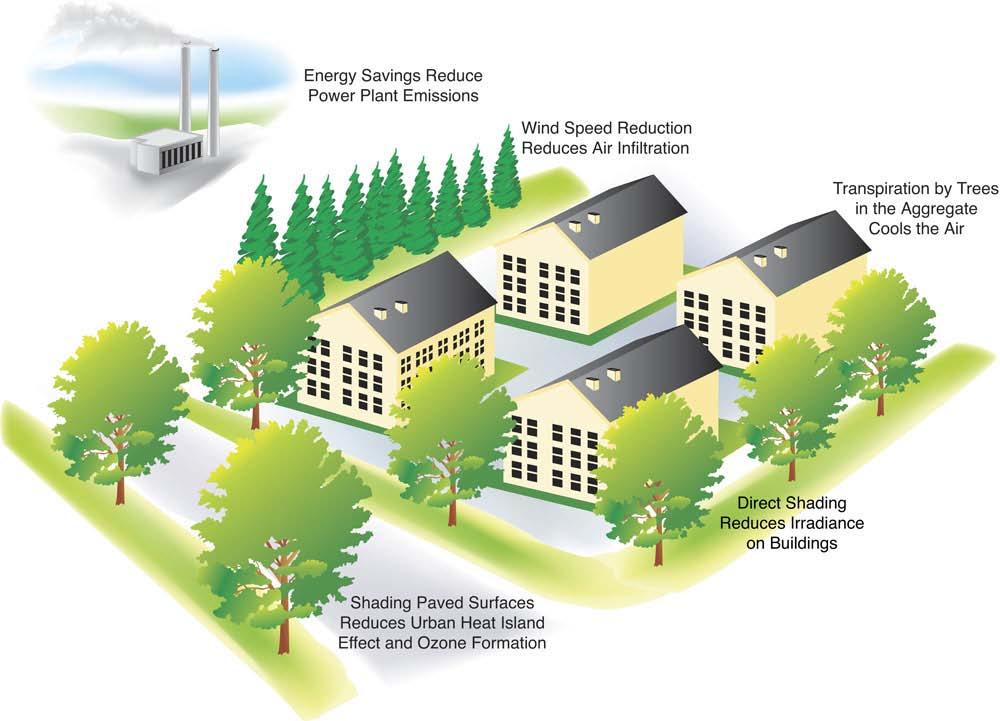
8 Conserving Energy

9 Conserving Energy AC: 139 kwh $18/yr

10 Plant Strategically Summer Shade West is the best Closer is better Large, dense crown

11 Shade Paved Surfaces

12 Reducing Atmospheric Carbon Dioxide
13 Reducing CO 2 Average annual: 265 lb $1/yr 5 Large West Tree - Sacramento 4 CO2 (metric tonnes) Reduced Emissions Sequestration


14 Choose Species Wisely Small and short-lived Large and long-lived


15 Plant and Maintain More Trees

16 Create Diversity


17 Make Use of Wood

18 Improving Air Quality

19 Improving Air Quality Ozone = 2.7 lb, $13.55 NO2 = 1.6 lb, $7.80 PM10 = 2.3 lb, $6.88 Net Value = 6.6 lb, $28


20 Choose Trees Wisely Large and tolerant to pollutants Evergreens for particulates


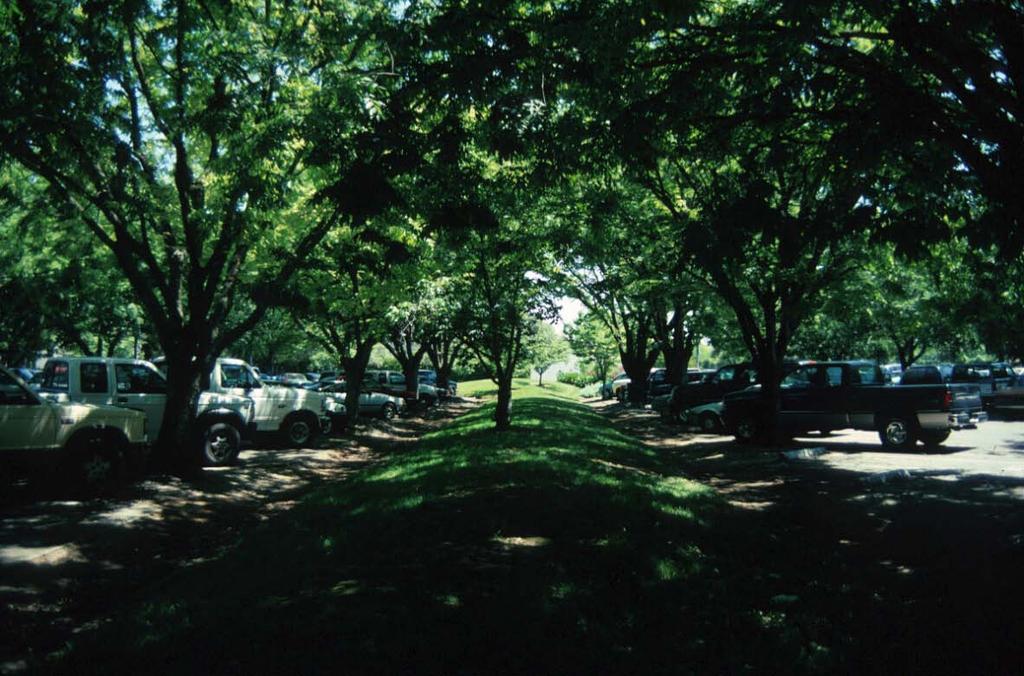
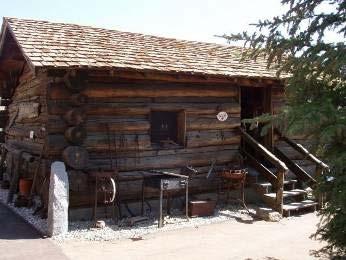
21 Shade Parking Lots Lots 4 F degrees cooler Cabin degrees F cooler Gas temp 4-8 degrees F cooler Reduce VOC 1 ton/day

22 Reducing Stormwater Runoff

23 Reducing Stormwater Runoff Annual interception: 552 gal $5


24 Choose Trees Wisely Little leaf & stem surface Lots of surface area, wide crown


25 Choose Trees Wisely Complex structure, rough surface Evergreen foliage

26 Locate Trees Wisely

27 Others Things Trees Do

28 Trees are Vital to Human Health Tree-filled neighborhoods: Lower levels of domestic violence Are safer and more sociable Tree-filled landscapes reduce stress Trees decrease need for medication and speed recovery times

29 Trees Sell Houses (At higher prices) Each large front yard tree adds 1% to sales price Large specimen trees can add 10%, or more, to property values.

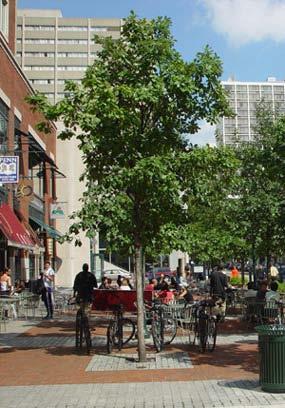
30 Trees Mean Better Business In tree-lined commercial districts... More frequent shopping Longer shopping trips Shoppers spend more for parking Shoppers spend 12% more for goods

31 Trees Improve Pavement Performance More shade means more time between repaving. 20% shade improves pavement condition by 11% 60% savings for resurfacing in 30 years

32 Property Value and Other $20 Benefits
33 Benefits $100 Large West Tree - Sacramento $90 $80 $70 $60 $50 $40 $30 $20 $10 $ Energy (AC) Carbon Dioxide Air Pollutants Runoff Aesthetics/Other
34 Costs Large West Tree - Sacramento $70 $60 $50 $40 $30 $20 $10 $ Tree & Planting Pruning Remove & Dispose Pest & Disease Irrigation

35 Net Benefit Avg. Annual Benefits: $72 Avg. Annual Costs: $10 Net Benefit: $62 Large Public Tree: $48

36
37

38 Scale-Up To California Cities 177 million trees 5 trees per capita 242 million empty sites 120 million plantable 6,400 GWh AC savings

39 50 Million New Trees East-west shade, 15 yr 6,400 GWh/yr, $485M 4% peak load savings $63/kW Reduced emissions 1.8 Mt/yr Sequester 4.5 Mt/yr Total 6.3 Mt/yr

40 50 Million New Trees East-west shade, 15 yr 6,400 GWh/yr, $485M 4% peak load savings $63/kW Reduced emissions 1.8 Mt/yr Sequester 4.5 Mt/yr Total 6.3 Mt/yr 4% of CAT target

41 Existing Initiatives Climate Change: Urban Forest Project Protocol Approved by ARB and Climate Action Reserve Projects: San Francisco and Santa Monica

42 Existing Initiatives Greenprint 26 jurisdictions 5 million trees Increase 17% to 35% tree canopy cover

43 Existing Initiatives Air Quality: Sacramento SIP for Ozone Control Urban heat island mitigation- 650,000 trees 0.3 ton per day reduction in hydrocarbons


44 Examples Tree canopy targets Bust sod Bust concrete Cradle to grave
45

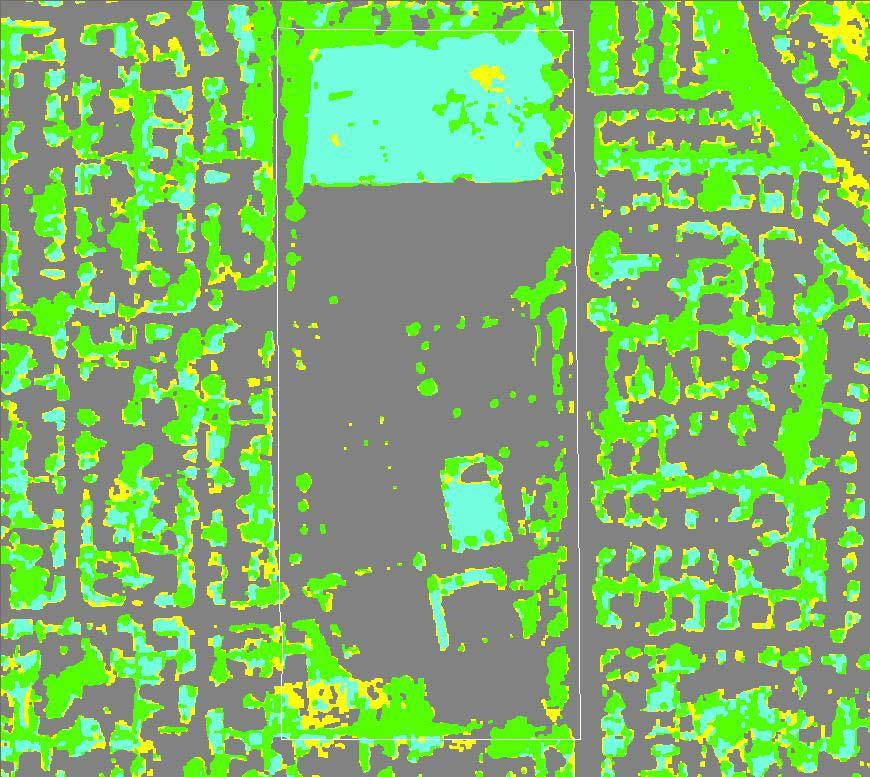
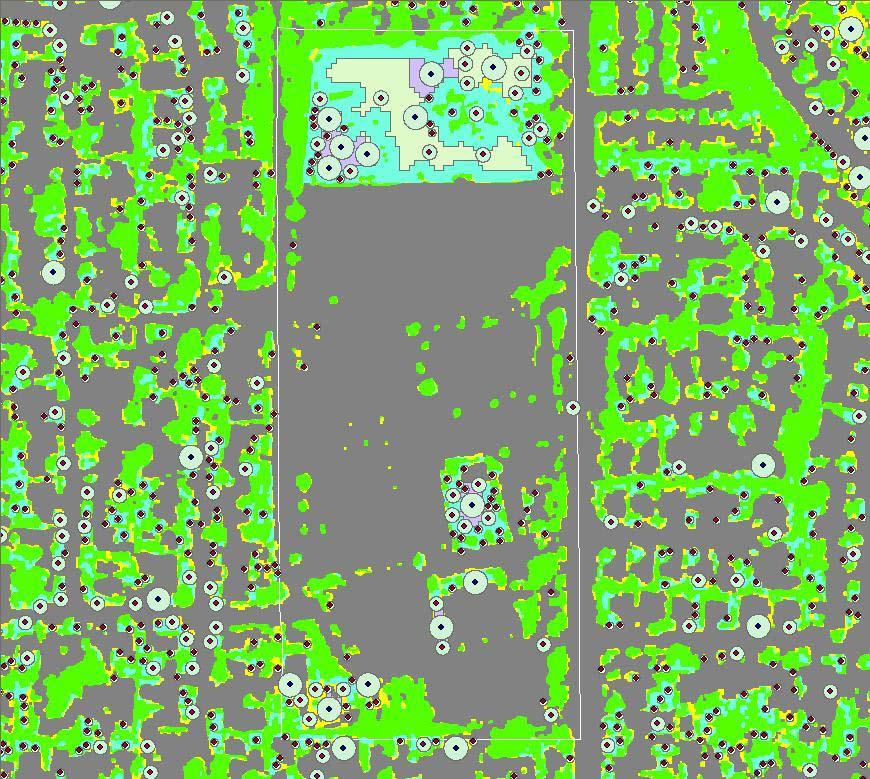
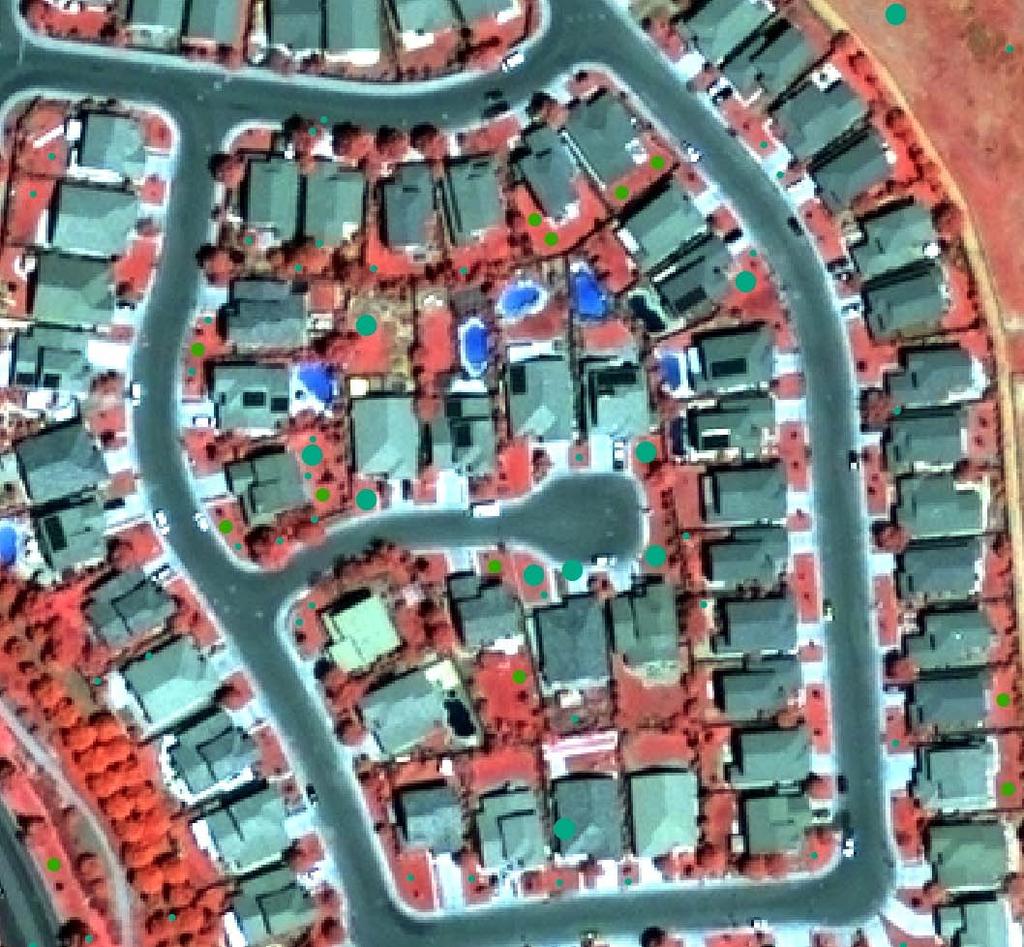
46 Potential Tree Sites

47 1 Million Trees LA 21% TCC 11 million trees 2.7 million tree sites 1 million new trees $1.6-2 billion

48 Davis Land Cover
49 Carbon Footprint 1,000 sq ft lawn Sequestered: 68 lb CO2 / yr Released by mower: 18 lb CO2 / yr Released by irrigation: 99 lb CO2 /yr 32,000 gal 114 kwh pump and treat Net: = -49 lb CO2/yr

50 Bust Sod Front yards Parks Cemetery
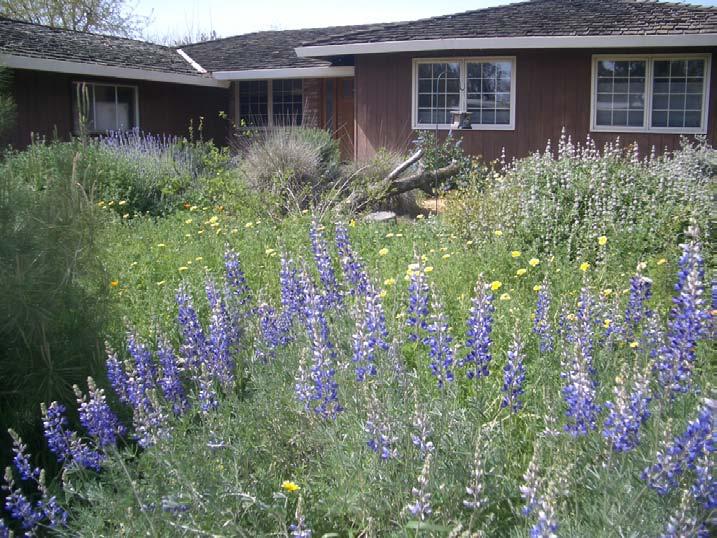

51 Bust Sod


52 Bust Concrete Street sides Cul de sacs Parking lots Pervious paving

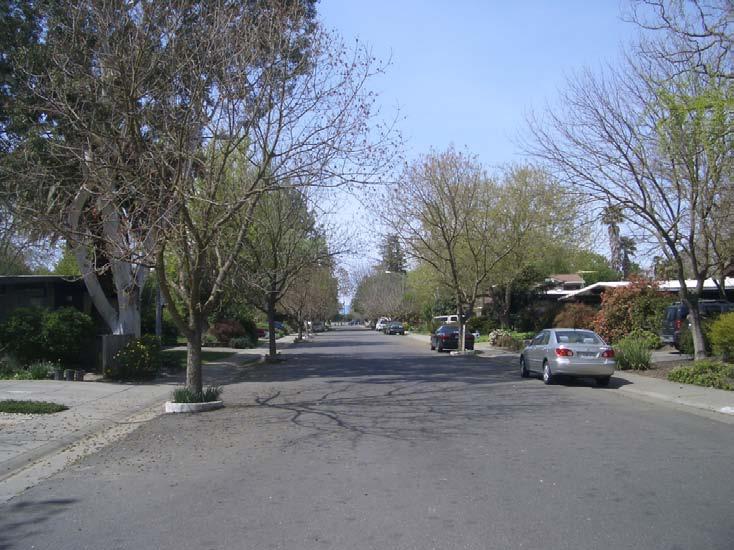
53 Bust Concrete
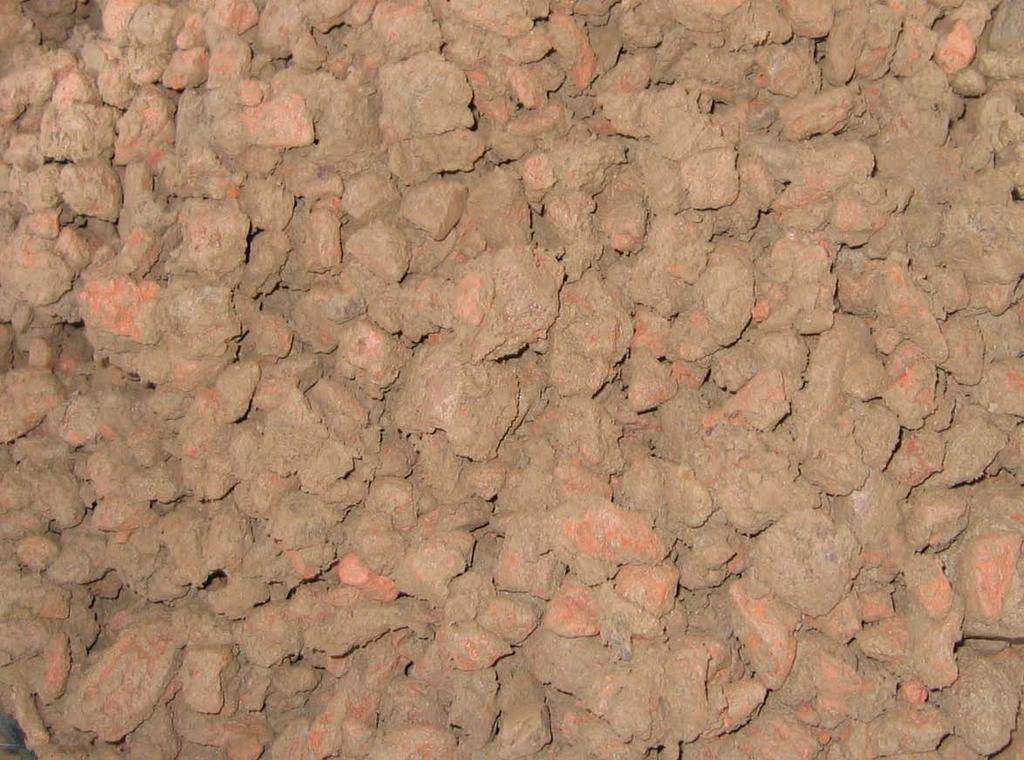


54 Engineered Soil Davis soil
55 New Construction

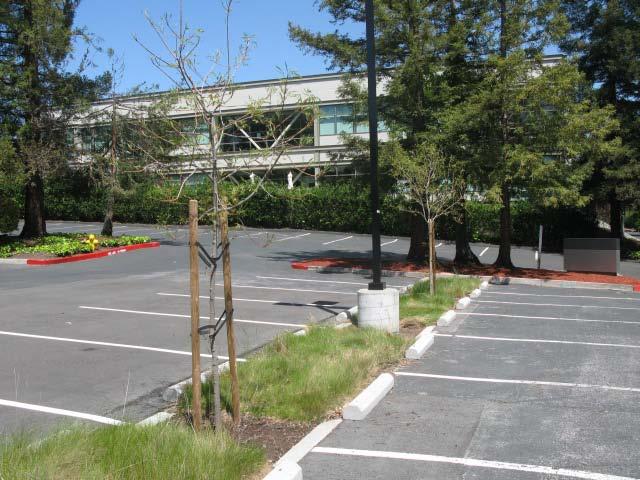
56 Parking Lots
57


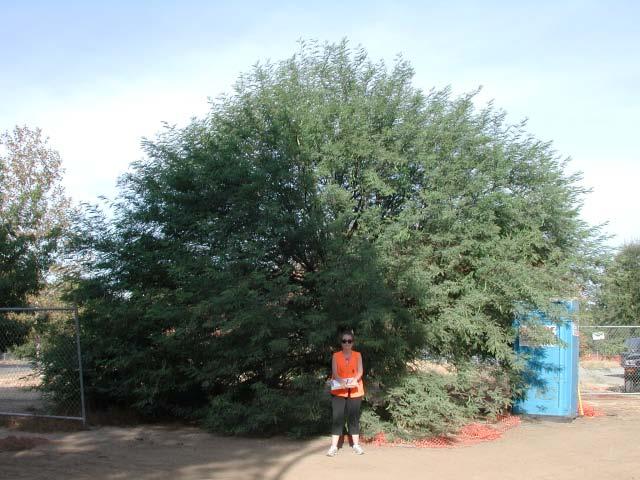
58 Texas Red Oak Texas Live Oak Thornless Mesquite

59 Cradle to Grave Plant 1 tree each birth Plant 1 tree each death Recycled wooden caskets
60 Policy & Funding Reduce unshaded, impervious surfaces and irrigated turf Increase street miles shaded every year by 1-2% Reduce irrigated turf by 3-5% annually Include pervious paving in new development Urban Greening Grants Strategic Growth Council ($70 million) Green Infrastructure for Clean Water Act
 Green Infrastructure Proven effective Saves money Helps")
61 Conclusions 50% of built environment we will see in 2025 did not exist in 2000 (Nelson, 2005) Green Infrastructure Proven effective Saves money Helps environment
62 Questions?