R. Srinivasan, J.H. Jacobs, J.W. Stuth, J. Angerer, R. Kaithio and N. Clarke
|
|
|
- Martin Day
- 5 years ago
- Views:
Transcription

1 Impacts of reforestation policy and agro-forestry technology on the environment and food security in the Upper Tana river basin of Kenya R. Srinivasan, J.H. Jacobs, J.W. Stuth, J. Angerer, R. Kaithio and N. Clarke
2 Introduction Role of forests in providing ecological services The Tana river catchment Aberdares range Mt Kenya Forest Adverse impacts of deforestation and forest degradation in the Tana river catchment Biodiversity and conservation Disruption of wildlife habitat Increased soil erosion Disruption of hydrological cycles Destabilization of local and global climate patterns Lack of forest products

3 Aberdares & Mt. Kenya Forests Illegal logging Shamba system Charcoal Livestock grazing Fires
4 Ecological and Hydrological Impacts Inadequate water for domestic and irrigation Nairobi Water supply Horticulture and Mwea irrigation scheme Siltation and water levels of Masinga Dam Storage water reservoir effects Effect on power generation High fluctuation of shorelines

5 What are the net economic gains to the reforestation activities? Who Cares?

6 Upper Watershed Farmers derive short-term profits from crop production Excessive erosion But are not accountable for the costs they incur on lower watershed users Runoff & sediment flow into lower watershed

7 Compounded by poor land management Unenforced regulations

8 Reforestation Shifts land use patterns to reduce runoff sediment Provides benefits to lower watershed users Incur costs due to shifting land use reduces agricultural output

9 Impacts on lower watershed POOR DOWNSTREAM WATER SUPPLY FLOODING RISK Electric Output

10 DREDGING COSTS
11 Study Objective Explore the hydrologic impacts on the Masinga reservoir in response to land use interventions in the Upper Tana River catchment with a focus on varying levels of reforestation.
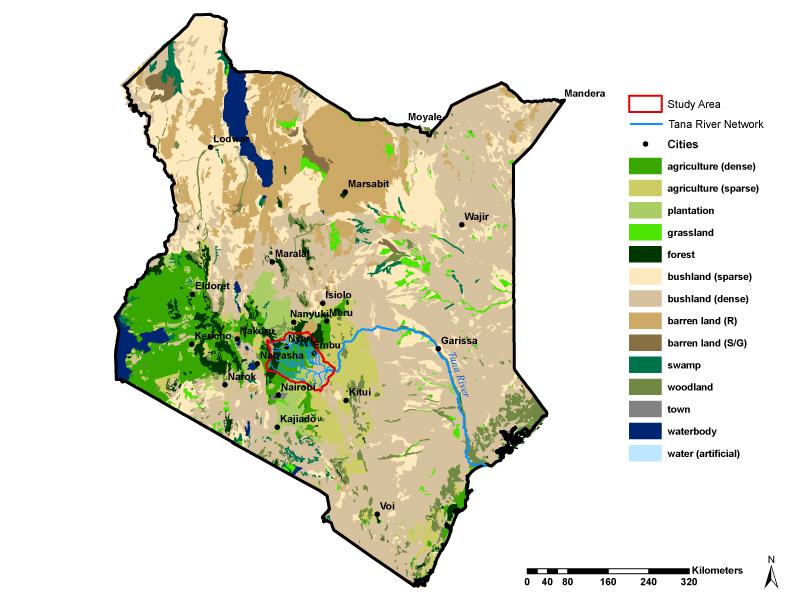
12 Study Area Upper Tana River Basin Focusing on major tributaries arising on the slopes of Mount Kenya and the Aberdares Range Area of diverse agriculture activities and major source of water for hydropower
13

14 Study Area
15 Area Characteristics Elevation ranges from 4700 m on Mount Kenya to a low of 730 m near the Kindaruma dam Soils follow an elevational gradient Andosols (high) Nitosols (mid) Ferallsols and Vertisols (low)
16 Methods Spatial Framework Elevation and Sub-basin delineation Soils Land Use/Land Cover Climate Data Streamflow data Hydrologic Model Reforestation Scenarios
17 Methods Spatial Framework Elevation Soils Climate Landuse Reforestation Strategies Model Testing Hydrological Model SWAT Crop Yields Environmental Impacts Basin/Subbasin Economic Model Economic Impacts
18 Digital Elevation Model Digital Elevation Model (DEM) was used in sub-basin delineation 1 km resolution data that was refined by USGS using the Shuttle Radar Topography Mission (SRTM) DEM data using a resampling back to 100 meters resolution

19 Digital Elevation Model

20 Subbasin Delineation Subbasins were delineated using the Watershed Delineation tool in the SWAT model using ArcView. Delineation was based the 100 m DEM The minimum threshold, or critical area, for subbasins was set at 2000 ha. For the model simulations, the catchment area was composed of 60 subbasins at a total of 9,752 km 2.
21 Soils Data Kenya Soil and Terrain database (KENSOTER) KENSOTER defines map units which can contain up to 5 different soils Dominant soil within a map unit within a sub-basin was chosen for modeling
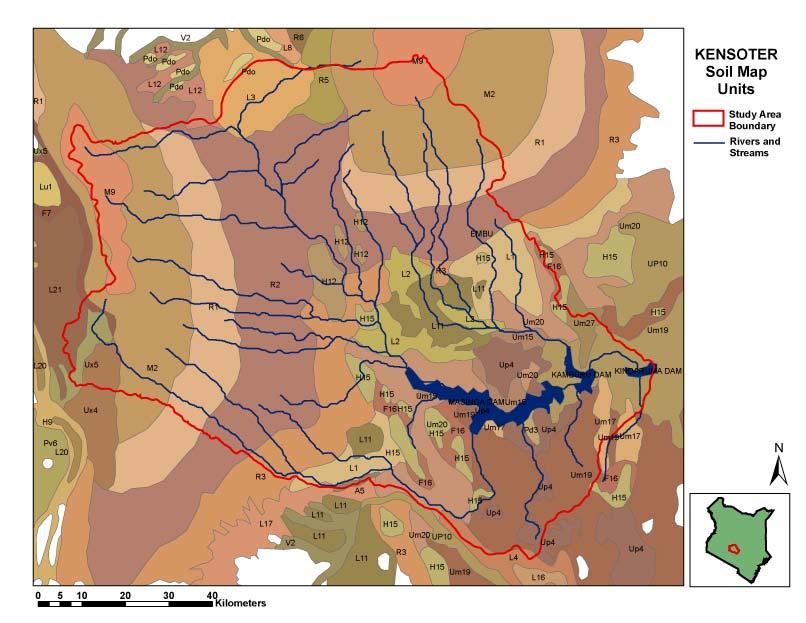
22 Soils
23 Land Use / Land Cover Derived from the Kenya Department of Resource Surveys and Remote Sensing (DRSRS) survey for medium and high potential areas The DRSRS survey designated land use on an approximate 2400 x 4800 m irregular point grid At each point, the percentage of each land use/land cover was defined. A total of 97 unique land use/cover types were established The DRSRS points were converted to a grid format for use in the hydrology model.

24 Land Use/Land Cover

25 Climate Data Nyeri and Embu WMO stations, also used for temperature data. Seven Laikipia raingauge stations for the middle and upper subbasins of the watershed, including the Embu Met, Kabaru Forest, Muringato Forest, Naro Moru Gate, Solio Ranch, and Teleki (Mt. Kenya) stations. No recorded data existed for the lower portions of the watershed so the spatially explicit CHARM rainfall data was used
26 Tana Stream gauge Locations Thiba Thika
27 SWAT Soil and Water Assessment Tool River Basin Scale s mi2 Continuous Time - Daily Time Step Basin Discretization - Grid Cell, Subwatershed Land Management - Cropping Systems, Tillage, Nutrients, Pesticides, Irrigation Water Management - Water Use, Stream and Reservoir Withdrawals, Water Transfer Stream and Pond / Reservoir Routing Accepts Measured Data and Output from WinEPIC/APEX
28 Model Description Precipitation Evaporation Soil Moisture Surface Runoff Lateral Flow Irrigation Soil layers Percolation/ Recharge Return Flow Transmission losses Percolation to Deep Aquifer
29 SWAT Inputs and Outputs Input Data Soils Climate Precipitation Land Use/Vegetation Cover Topography Watershed or Subbasin Delineation Crop or Land Management Ponds or Reservoirs/Withdrawals BMPs Water Quality Outputs Stream flow Sediment Organic N and P Nitrate/Nitrite Ammonium Soluble P Pesticides Algae Dissolved Oxygen Bacteria Conservative Metals
30 Crop Management Variables Adjust crop management files to accurately represent current conditions Crop Rotations Tillage Fertilizer USLE P and LS factors (conservation practice and length/steepness of slope) Runoff Curve Number
31 Rationale for the Reforestation Scenarios At independence, all land that was not in private or government ownership became Trust Land. Most of the land over 1800m elevation in the study has been either legally or illegally. Recent forest cover map shows forest land to be above 2000m elevation, therefore we proposed a graded reforestation scenario of 2000, 1950, 1900 and 1850m elevation zones. Tenure Percent Trust Land 78.5 Government land 20.0 Private land 1.5
32 Reforestation Scenarios Reforestation scenarios were implemented as full replacement of land by forest above a certain elevation. The GIS was used to build a conditional replacement model using the land use grid and the DEM. This allowed spatial representation of the scenarios For the base scenario, the areas designated as forest were left intact as were all of the other land uses.
33 Reforestation Scenarios For the 2000 m scenario, all of the land uses having elevations greater than 2000m, regardless of type were displaced with the forests This procedure was repeated for each of the elevation bands to create the 5 scenarios
34 Forest Acreage by Reforestation Scenario Total Forest Area Area Displaced Cumulative Area Displaced Reforestation Scenario (km 2 ) (km 2 ) (km 2 ) Base Scenario 2, meters 2, meters 3, meters 3, , meters 3, ,237

35 Reforestation Scenarios
36 Model Setup for Testing Model inputs consisted of topography, soils, land use, climate, and precipitation data. Crop management consisted of fertilization and heat unit adjustment for planting and harvest dates. The period from was used as a warm-up period during which model conditions stabilized. Results for various simulations were reported for the period from
37 Model Setup for Testing Baseflow, flow to streams from groundwater, was subtracted from the stream gauge data This was done using a baseflow recession constant derived using a baseflow filter program The baseflow filter program was used on the data from 4 stream gauges in the basin and these constant were used to subtract baseflow from the gauges in their local network No true model calibrations were attempted
38 Precipitation by Subbasin in the Upper Tana River Catchment

39 Precipitation Loading in the Upper Tana River Catchment
40 Average Annual Runoff for the Upper Tana River Catchment Subbasins
41 Percentage of Runoff from Rainfall by Subbasin
42 Model Testing: Sedimentation Sediment loads, in total tons, ranged from ,294 Sediment loads were highest in the subbasins in the central portion of the catchment and those draining Mt. Kenya, followed by those draining the Aberdare Range. This is mainly due to high rainfall, high population density, and intensive cropping which leaves soils susceptible to erosion.
43 Average Annual Stream Network Sediment Load by Subbasin
44 Model Testing: Statistical Analysis Statistical analysis was completed for the flow comparison between observed stream gauge flow data and model predicted flow. Analysis included regression analysis and calculation of coefficient of efficiency (COE) For regression analysis coefficient of determination (r 2 ) was calculated with slope at 0 COE is widely used in hydrologic modeling and has values ranging from - to 1. Values <.2 are considered to be poor correspondence
45 Coefficient of Efficiency = = = n i m i n i i i O O R O COE ) ( ) ( 1.0 Where: Oi is the observed streamgauge runoff for a watershed for day I Om is the mean observed streamgauge runoff for a watershed over all days, Ri is the predicted (SWAT simulated) runoff for a watershed for day i.
46 Statistical Analysis Of Flow By Gauge
47 Tana Sagana Predicted and Observed Flow Regression r 2 =0.53
48 Model Testing Results On the whole, the model slightly under-predicted flow for the catchment. Over-predictions were observed during peak rainfall events. This is may be due to the lack of reliable local rainfall data at these locations For all stations, analysis of a single dry (1984) and wet (1988) year suggest that the model does a good job of detecting these trends in rainfall Results indicated that the model did a reasonable job of representing flow and the analysis of reforestations scenarios proceeded
49 Tana Sagana Predicted and Observed Flows Jan-81 Jul-81 Jan-82 Jul-82 Jan-83 Jul-83 Jan-84 Jul-84 Jan-85 Jul-85 Jan-86 Jul-86 Jan-87 Jul-87 Jan-88 Jul-88 Jan-89 Jul-89 Jan-90 Jul-90 Jan-91 Jul-91 Jan-92 Jul-92 Jan-93 Jul-93 Jan-94 Jul-94 Jan-95 Jul-95 Date Observed Predicted Flow (cms)
50 Hydrograph of 1984 Drought at Tana Sagana Stream gauge Flow (cms) Jan-84 Feb-84 Mar-84 Apr-84 May-84 Jun-84 Jul-84 Aug-84 Sep-84 Oct-84 Nov-84 Dec-84 Date Observed Predicted Hydrograph of 1988 Floods at Tana Sagana Stream gauge Flow (cms) Jan-88 Feb-88 Mar-88 Apr-88 May-88 Jun-88 Jul-88 Aug-88 Sep-88 Oct-88 Nov-88 Dec-88 Date Observed Predicted
51 Tana Land Area Relationships PPT = 93% RO = 52% SED = 50% PPT = 4% RO = 40% SED = 44% Thiba PPT = 3% RO = 8% SED = 6% Thika PPT = Precipitation RO = Runoff SED = Sediment
52 Model Testing Results Results indicated that the model did a reasonable job of representing flow and the analysis of reforestations scenarios proceeded
53 Reforestation Scenario Results Spatial Framework Elevation Soils Climate Landuse Reforestation Strategies Model Testing Hydrological Model SWAT Environmental Impacts
54 Forest Restoration Land Use Displacement for Various Scenario Simulations Scenario 2000m Scenario 1950 m Scenario 1900 m Scenario 1850 m Land Use Percent Area Land Use Percent Area Land Use Percent Area Land Use Percent Area Grazing Grazing Grazing Grazing Tea Tea Tea Tea Maize 9.05 Maize Maize 12.1 Maize Woodlot 6.6 Woodlot 6.92 Coffee 6.48 Coffee Bush 3.35 Coffee 3.35 Woodlot 5.62 Woodlot 4.89 Coffee 0.65 Bush 2.69 Bush 4.05 Bush 3.7 Other* 0.41 Other* 1.58 Other* 1.05 Other* 2.17 *other consists of banana, hedges, maize-banana, and roads
55 Reforestation Results: Sediment Loading Sediment load appears to be directly related to reforestation activities. Total sediment generally decreased with increasing forest cover. The exception was the 1950m scenario, which showed a slight increase. This was likely due to the loss of tea plantations which provide ground cover and thus soil stabilization. Tea behaved hydrologically better from a sediment standpoint in the model compared to forest
56 Reforestation Results: Average Annual Sediment Yield Per Hectare Sediment (T/ha) Baseline Model Run
57 Reforestation Results: Average Annual Sediment Yield for Entire Basin 3.45 Million Tons of Sediment Baseline Model Run
58 Sediment Load Reduction For the 1850 scenario, the cumulative total sediment load for the 15 year study period was reduced by 7% from the baseline. Benefit from increased forest cover was higher during peak rainfall events (1988) than drought conditions (1984).
59 Reforestation Results: Percent Reduction in Sediment Loading into the Masinga Dam
60 Recommendations Tea plantations could be left in place in the reforestation zone as they have positive hydrologic effects when proper vegetation buffers are in place Pursue return of downstream benefits to displaced farmers Pursue stronger soil conservation practices such as buffer strips in remaining croplands

61 For more details on on this analysis and to view the final Tana River Basin report visit the CNRIT Website: