Natural resources and Land use in Lao PDR
|
|
|
- Philippa O’Brien’
- 5 years ago
- Views:
Transcription
1 Natural resources and Land use in Lao PDR Bae PHEAXAY National university of Laos Joint International Conference on: Sustainable Low Carbon Emission Development in Asia ICLCA 2017& 6 Th LoCARNet Annual Meeting 1 3 Nov, Bangkok, Thailand


2 Laos is hub of GMS s biodiversity hotspot Northern Middle Southern
 49 ethnic groups, in four main linguistic families (Lao Tai, Mone Khmer, Tibeto Burmese and Hmong Ioumien) Status: Most least")
3 Brief Information Area: 236,800 km 2 80% mountainous area Attitude: m (MSL) Climate: Tropical monsoon Population: 6.5 Mil. ( LNSC,2015) 49 ethnic groups, in four main linguistic families (Lao Tai, Mone Khmer, Tibeto Burmese and Hmong Ioumien) Status: Most least develop in region


4 Distribution of Population 27.5 persons/km 2 <10 Mostly in along Mekong Plain > 150

5 Lao PDR is in the center of 3 Major Economic Corridors North South: Yunnan, PR China - Laos - to N. Thailand East West: Thailand - Laos - Viet Nam Southern: Thailand -Laos -Viet Nam
6 Kunming Namtu CHINA Mengzi Ha Giang NANNING Transport Linkages and Border Posts Border Posts issuing: Visas on Arrival (existing) Visas on Arrival (planned) No Visas on Arrival International Airport: Airport connecting with Laos International Airport in Lao PDR (existing) International Airport in Lao PDR (planned) Pegu MYANMAR CHIANG MAI Moulmein Hawng luk Mea sai Chiang Rai Nakhon Sawan Thomburi Chumphon Jinghong Houesai Nateul Phitsanulok BANGKOK VIENTIANE Phong Saly Pak Mong THAILAND Lao Cai LAO PDR Udon Thani Khon Kean Samneua Phoulao Luang Prabang Muang Kham Xieng Khouang Nakhon Ratchasima Battambang Nong Khai Kampong Seom Paksane Nape Nakhon Phanom Mukdahan Ubon Ratchathani Siem Reap PHNOM PENH HANOI Hoa Binh Lang Son Vinh Thakhek Savannakhet CAMBODIA Racha Gia Can Tho Ha Tinh Pakse Kompong Cham My Tho Hon gai (Cai Lan) HAIPHONG Dong Hoi Stung Treng Quang Tri Hue Bien Hoa HO CHI MINH Vung Tau Quang Ngai VIET NAM Da Lat DA NANG Me Thout Qui Nhon Nha Trang Cam Ranh Surat Thani Nakhon Si Thammarat Can Mau
7 4. Brief of Forest management 1989, First National Forestry Forum 1993, Legally establishment of Lao NBCA system 1996, Forestry Law 1998, National Land use and Land allocation Program 2003, Regulation on the Management of National Biodiversity Conservation Areas, Wildlife and Aquatic Animals 2015, Prime minister degree No 15. eradication timber product export 2017, During feasibility study of land use allocation

8 Forest cover to 70% in 2020??? Forest cover 41% (2007) Global and Lao PDR Forest cover last updated: 9/2013

9 Global and Lao PDR Forest cover last updated: 9/2013

10 Global and Lao PDR Forest cover last updated: 9/2013
11 Classification of Land Use and Forest Types in Lao PDR Land or Water? Water Water Land Productive Land? Yes Permanent Agriculture? Yes PERMANENT AGRICUTURE AREAS Rice Paddy Agriculture Plantation Other Agriculture Area No Yes Crown cover less than 20% No POTENTIAL FOREST AREAS Bamboo Ray Unstocked CURRENT FOREST AREAS Evergreen Dry Evergreen Mixed Deciduous Dry Dipterocarp Gallery Forest Coniferous Mixed Coniferous/Broadleaved Forest Plantation Tree or Scrub cover? No Yes OTHER WOODED AREA Savanah Scrub OTHER LAND USE Grassland Rock Swamp Urban Areas

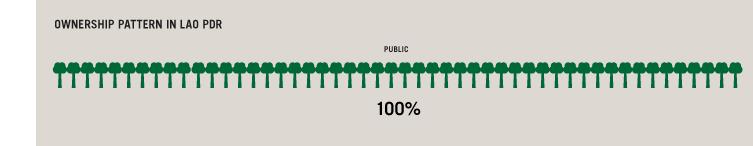
12 3 types forest categories in Lao 24 National Conservation Areas with 3,8 mil. Ha 49 National Protected Areas with 7,5 mil. Ha 51 National Production Forest Areas with 3 mil. Ha
 LAND USE PREFER 1 Class I >46 Protection & conservation")

13 Land slope classification MRC categories NO. CLASS SLOPE CLASSES ( %) LAND USE PREFER 1 Class I >46 Protection & conservation forest 2 Class II Production forest 3 Class III Fruit plantation and agroforestry 4 Class IV 6-12 Upland farming 5 Class V <5 Lowland farming FOREST ECOSYSTEM AGRO ECOSYSTEM URBAN ECOSYSTEM AQUATIC ECOSYSTEMS
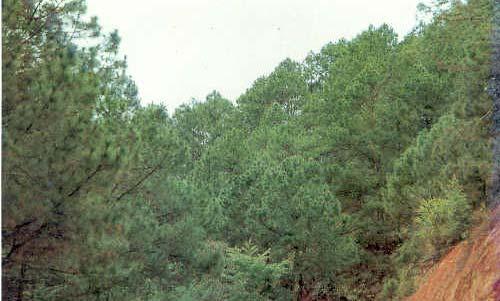


14 Dry Dipterocarp Forest The Dry Evergreen Forest Gallery Forest Coniferous Forest (S)


15 MIXED DECIDUOUS FOREST MIXED BROADLEAVED & CONIFEROUS FOREST BAMBOO (B) FOREST PLANTATION


16 UNSTOCKED FOREST AREAS (T) SHIFTING CULTIVATION AREA SAVANNAH (SH) HEATH, STUNTED AND SCRUB FOREST (SR)

")


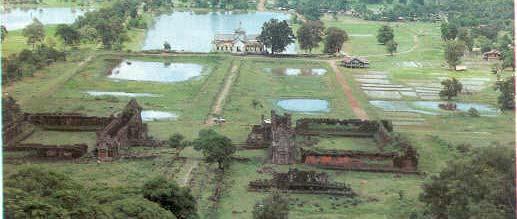
17 AGRICULTURAL PLANTATION (AP) RICE PADDY (RP) OTHER AGRICULTURE LAND (OA) BARREN LAND AND ROCK (R)
")
")
 OTHER")
18 GRASS LAND (G) SWAMPS (SW) Village (V) OTHER AREAS (O)
19 Natural resources and GDP GDP (2008 est.) GDP per capita, 2008 est. services 27% agriculture 39% $US industry 34% Agriculture and natural resources is main of GDP ( ) Industry: mainly is hydropower (run off and dam), mining Services: mainly is tourism

20 Distribution of poor districts 47 identified poorest 25 identified poor 70 was not identified > 50% under $360 per capita


21 Threats on natural resources and forest Shifting cultivation & plantation concession Population growth (2.3%) Large livestock production Infrastructure development


22 Over harvest of natural resources Illegal timber harvesting


23 Khob jai THANK YOU