State of Europe's Forests production processs and report. Roman Michalak, UNECE/FAO Forestry and Timber Section. State of Europe s Forests 2011
|
|
|
- Kathleen Sherman
- 5 years ago
- Views:
Transcription


1 FORESTRY STATISTICS WORKING GROUP EUROSTAT, Luxembourg November 2011 State of Europe's Forests production processs and report Roman Michalak, State of Europe s Forests 2011 Development process consistence with FAO FRA Quantitative data collection Results
2 State of Europe s Forests 2011: Development Process State of Europe s Forests Framework Improved Pan-European Indicators for Sustainable Forest Management endorsed by Fourth Ministerial Conference on the Protection of Forests in Europe, 2003, Vienna, Austria MCPFE Work Programme FOREST EUROPE Liaison Unit Oslo UNECE/FAO Strategic Plan
3 State of Europe s Forests Scope Part 1: Quantitative information Part 2: Information on policies, institutions and financing Part 3: Assessment of the sustainability. Threats and challenges Pilot application of European Forest Types State of Europe s Forests Process FOREST EUROPE and UNECE/FAO parent bodies UNECE/FAO Team of Specialists on Monitoring SFM FOREST EUROPE/UNECE/FAO Advisory Group on Preparation of SoEF 2011 Team of Authors and Reviewers
4 State of Europe s Forests Process Bioversity Int., EEA, EFI, EUROSTAT, ICP Forests, IUFRO, JRC Ispra and other international and national organizations Supported by Governments of Finland, France, Norway and Switzerland Presented to the Ministerial Conference on the Protection of Forests in Europe, June 2011 in Oslo, Norway State of Europe s Forests Process Review of the SoEF2007 report and process Preparatory work Data collection and processing Report writing and printing Dissemination
5 State of Europe s Forests Process - SoEF 2007 Review Evaluation by the parent bodies and partner organisations Questionnaire on the preparation process, contents and dissemination of the report feedback by participants in the reporting process feedback by report s users Evaluation of the dissemination of the report dissemination of the SoEF 2007 report visibility of the SoEF 2007 on internet use of the SoEF 2007 database State of Europe s Forests 2011 Process - Preparations Developing terms, definitions, classifications Preparing questionnaires, guidelines Establishing and/or updating networks Developing links with organizations Fundraising
6 State of Europe s Forests 2011 Process - Data collection and processing Quantitative Indicators FAO FRA National Correspondents Qualitative Indicators FOREST EUROPE Focal Points European Forest Types Thematic experts/nfi State of Europe s Forests 2011 Process - Writing 14 Coordinating Lead Authors and Lead Authors, Supported by over 50 thematic Authors Joint meeting of ToS/National Correspondents/ Authors Substance review by 6 external reviewers Language editing by 2 editors Layout and printing June 2011
7 State of Europe s Forests 2011 Process - Dissemination Reports Releases Presentations Educational tool-kit Interactive database Follow-up discussions European Forest Outlook Study II State of Europe s Forests 2011: Consistency among FRA and SoEF
8 Consistency among FRA and SoEF Differences among FRA (2005) and SoEF (2007) differences in scope of assessments differences in applied terms, classifications and/or definitions time related aspects, e.g. latest available data, extrapolated data, average data for period, one year data Reasons for these differences differences resulting from different circumstances on the ground or different data availability and needs in the region or globally different political choices at the global and regional level: ultimately FRA is for COFO and SoEF is for Forest Europe (C&I) others (not authorised by the above mentioned reasons) - the most numerous and most annoying
9 Solution Consultations between FAO and UNECE secretariats Technical analysis of the differences between the FRA 2005 and SoEF2011 systems Involvement of the Advisory Group and Team of Specialists on Monitoring of SFM in: Classification of differences, and for the 3 rd category: Preparation on proposal for terms definitions and classifications consistent among these two systems Results Consistent (to possible extent) enquiry National questionnaires prefilled with FRA data Reduced burden (and hopefully confusion) for national correspondents Consistent results (for corresponding variables) among FRA and SoEF
10 State of Europe s Forests 2011: Quantitative Data Collection I. Quantitative indicators 6 Criteria for Sustainable Forest Management (SFM): Forest Resources and Carbon (4) Forest Ecosystems Health and Vitality (4) Productive Functions (5) Biological Diversity (9) Protective Functions (2) Socio-economic functions and conditions (11) 35 quantitative indicators (1990, 2000, 2005, 2010)
11 Reporting on quantitative indicators (1) National reporting (Enquiry): Not prefilled Prefilled (EUROSTAT, FRA 2010, JFSQ, JWEE) Other national reporting processes: Bioversity Int., ICP Forests/JRC Ispra, UNECE/FAO Other sources (projects): 2.2 Soil condition (ICP Forests/JRC Ispra) 4.7 Landscape pattern (JRC Ispra) Reporting on quantitative indicators (2) Complete (Questionnaire, EFT, Annexes), pre-filled draft of the Enquiry (FRA2010 and IDP) National reports review process: 1 st phase - 6 reviewers on quantitative indicators 2 nd phase - authors of the report Joint meeting for National Correspondents and Authors Data processing (output tables): FAO Rome and UNECE/FAO Geneva Interactive database
12 Reporting on quantitative indicators (3) 222 national experts directly working on data provision Report delivered (36 countries): Austria, Belarus, Belgium, Bulgaria, Croatia, Cyprus, Czech Republic, Denmark, Estonia, Finland, France, fyro Macedonia, Georgia, Germany, Hungary, Iceland, Ireland, Italy, Latvia, Liechtenstein, Lithuania, Montenegro, Netherlands, Norway, Poland, Portugal, Romania, Russian Federation Slovakia, Slovenia, Spain, Sweden, Switzerland, Turkey, Ukraine, United Kingdom Desk studies (10 countries): Albania, Andorra, Bosnia and Herzegovina, Greece, Holy See, Luxembourg, Malta, Monaco, Republic of Moldova, Serbia Reporting on quantitative indicators (4) Data collected: Over 38,000 data variables (appr. 26,000 for 2007) Additional data came directly from International Data Providers 2021 variables requested 1702 the highest prov. Five countries reported more than 1500 data entries (Croatia, Czech Republic, Estonia, Slovakia and Sweden) On average, a national report included 937 variables


13 Data completeness (for the main variables) State of Europe s Forests 2011

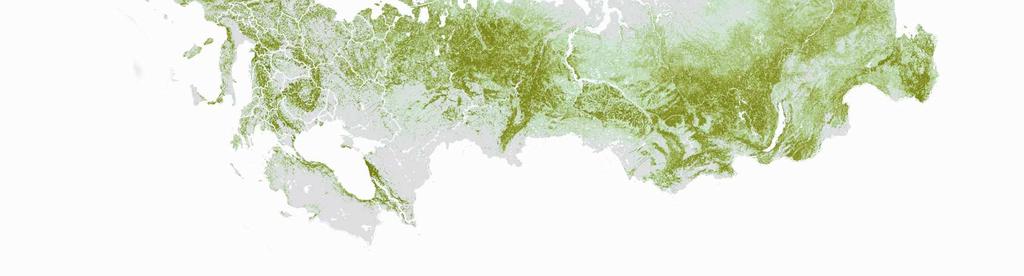
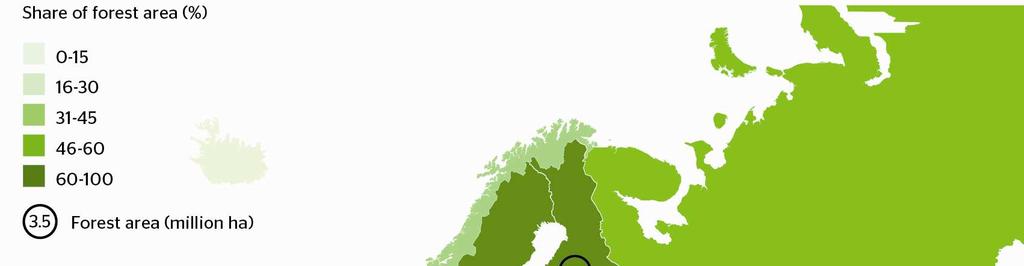
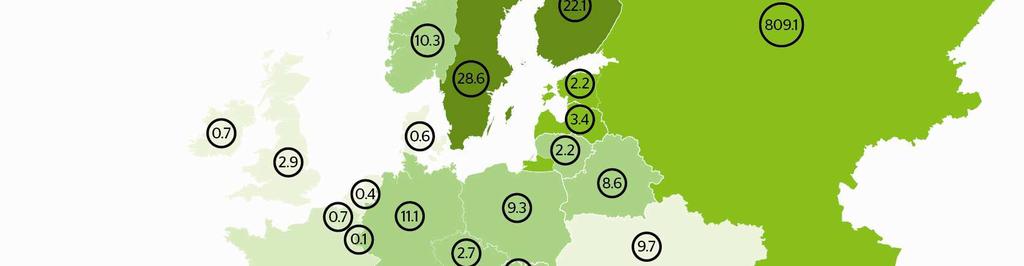
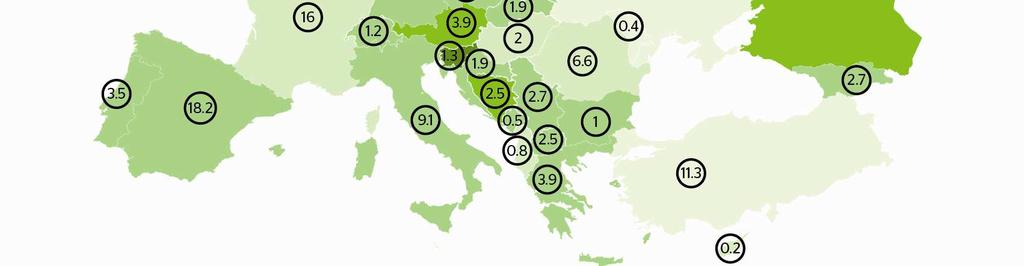
14 Forest area: 1,000,000,000 ha (25% of world total) Forest cover: 45% of total land area (32% without Russia).


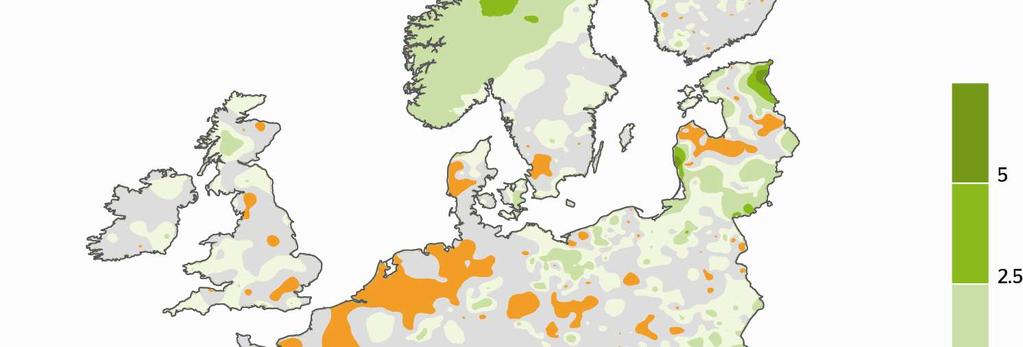
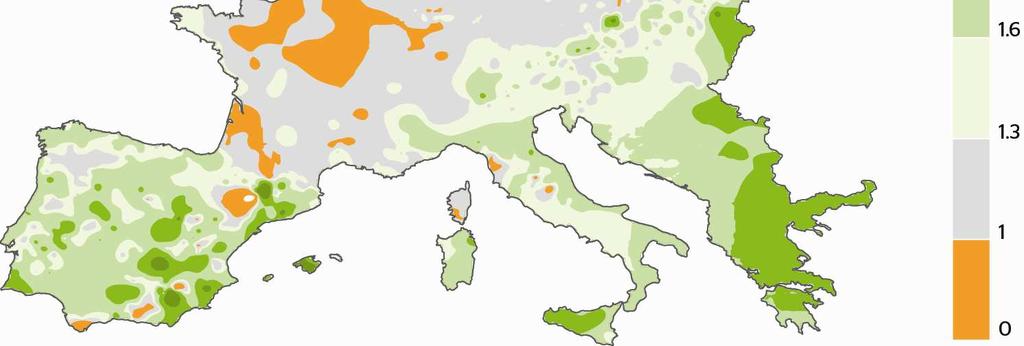
15 Change of forest area: +0.8 million ha/year C/N ratio in forest soils


16 Fire damage 1.4 million ha burned Ratio of felling to net annual increment, 2010 Growing stock has increased by 8.6 billion cubic meters since 1990


17 Landscape level forest connectivity, 2006 Source: JRC Ispra Forest connectivity change Source: JRC Ispra


18 Protected Forests Protected forests cover 56 million ha, 17 million of which in Russia Protected forests area has increased by 5 million ha since 1990 Share of public and private forest, 2005 ~30 million private holdings Area of private forests has increased by 15% Area of public forests - stable
19 Policies, institutions and instruments Increasing influence of international processes and other sectoral policies: climate change, energy, biodiversity and agriculture Policy objectives and instruments have been adapted in most policy areas in more than half the reporting countries since 2007 National policy objectives have changed, notably on o biodiversity o carbon balance o production and use of wood o land use and forest area Lack of coherence with other policy areas still a challenge Sustainablility asessessment An experimental method, based on data provided for the State of Europe s Forests 2011 report, provided promising initial results For most country groups and criteria, the results are satisfactory Some threats to forests and sustainable forest management were identified The method can be further developed and improved

20 SoEF 2011 subregions Sustainability of forest management in Europe, 2010 C1 C2 C3 C4 C5 C6 Part A Part B Forest resources and global carbon stock Health and vitality Productive functions Biodiversity Protective functions Socioeconomic functions Overall policies, institutions and instruments for sustainable forest management Policies, institutions and instrument s by policy area Russian Federation North Europe Central-West Europe Central-East Europe South-West Europe South-East Europe European Union


21 C1 Resources and carbon Central-West Europe (example) Areas of concern All indicators positive at country group level C2 Health and vitality Eutrophication, C/N ratio C3 Productive functions All indicators positive at country group level C4 Biodiversity Landscape pattern and fragmentation. Weak data on threatened species C5 Protective functions C6 Socio-economic functions A Policies and institutions, overall Unable to separate protection for soil/water from protection for infrastructure Negative net revenue in some countries,, negligible wood energy in a few, small share of forest workforce All indicators positive at country group level B By policy area All indicators positive at country group level Pilot application of European Forest Types Continuation of work led by European Environment Agency Developed classification of 14 Categories and 78 Types Forest Area + Growing Stock and 4 voluntary indicators


22 Interactive Database - More information on: Thank you for your attention!