STRATUM: The Benefits and Costs of the Green Infrastructure
|
|
|
- Eugene Shaw
- 5 years ago
- Views:
Transcription


1 STRATUM: The Benefits and Costs of the Green Infrastructure Paula Peper, Center for Urban Forest Research, Pacific Southwest Research Station, USDA Forest Service


2 Center for Urban Forest Research Demonstrate new ways that trees add value - quality of life - to communities. USDA Forest Service PSW Research Station Davis, CA We convert research results into financial terms to stimulate community investment in trees.


3 Benefit-Based Based Approach Structure Function Management Value

4 Investment Value Benefits and Costs Benefits Air quality Carbon storage Storm-water interception Energy savings Property value Costs Planting Care & Maintenance Infrastructure damage Liability Pest control Areas of Research
5 Street Tree Assessment Tool for Urban Forest Managers What? STRATUM is a tool that provides users with the ability to evaluate tree populations and programs UFORE and STRATUM are primary applications in i-tree ( ) Who? STRATUM is designed for use by managers, foresters, tree non-profits, designers/planners, and landscape architects

6 Why Street Trees, Why STRATUM and Not UFORE? Street trees are accessible Minimal data needed species, dbh, costs Provides managers with answers for less initial cost
7 STRATUM vs. UFORE Minimum Field Data Requirements STRATUM Species DBH UFORE Plot ID Land use DBH DBH meas. Ht Height to live top Height to crown base Crown width % canopy missing Dieback Crown light exposure Tree orientation to building Setback

8 Reference Cities

9 Tree Measurements 25 measurements for each tree, including: Diameter-at-breast-height Tree height Crown (bole) height Crown diameter Leaf area Crown shape Tree orientation and setback Condition and location Pruning level Grow space type and size Hardscape damage
10 Regional Environmental Data Collection Fuel Mix Stormwater retention costs Property values Air quality emissions/costs Carbon Climate

11 User - minimal input needed dbh, species Full inventory or sample Tree costs (budget) Local prices Provides 120 reports on structure, function, value Allows users to begin benchmarking forest activities STRATUM
 Areas of success, need improvement Prioritize management & investment Baseline for future comparisons")
12 STRATUM & Benchmarking What does this information mean what can it do for me? Benchmarking Comparisons (internal & external) Areas of success, need improvement Prioritize management & investment Baseline for future comparisons Compare program with similar cities Compare resources, budgets and outcomes

13 Indicators of Health and Stability Structural Species importance Age diversity Condition Managerial Planting Pruning Removal Conflicts Economic Expenditures Benefits Net benefits Benefit-cost ratios

14 Structure: Key Indices Stability Distribution of Importance Values among species Age distribution Condition (health)
15 Species Importance Values Relative contribution of a species to the entire population due to numbers and SIZE Percentage of total tree numbers Percentage of total leaf area Percentage of total crown projection area Ranges from by species Why important? Influences stability Indicates reliance on functional capacity of each species Linked to benefits and indicates future trends
16 IV Distribution Comparison Indicator Total IV for top 5 species (%) 11 City Results Mean = 57.8% Std Dev = 15.6% Range = 33-79% Minneapolis 67.5% Grade = D % of Total IV Hackberry Siberian elm Honey locust American elm Green ash Siberian elm American linden Ponderosa/Austrian White/silver poplar pine Green ash Blue spruce Siberian elm Cottonwood Green ash American elm Camphor Cherry plum Coast live oak Sweetgum London plane Mondel pine Mex fan palm Arizona ash Willow acacia Chinese elm Littleleaf linden Norway maple Sugar maple Green ash American elm Honeylocust Cottonwood Siberian elm Green ash Silver maple Ft. Collins Cheyenne Bismarck Berkeley Glendale Minneapolis Boulder
17 Age Diversity Percentage of total tree numbers by DBH class Ideal has 40% young, 30% maturing, 20% mature, 10% old Why important? Influences stability Influences short-term management costs and benefits Indicates future population trends and management issues

18 Management: Key Indices Planting: % full stocking Pruning: % safety and general prune Removals: % needed Conflicts: % sidewalk & powerline Why? Prioritize needs Budget for priority management Identify species that perform well and poorly in different sites

19 Management: Planting Needs Percentage of all street tree sites with trees (2 trees every 50-ft street is full stocking) Why is it important? How many trees can be planted Ability to increase net benefits How well treed our city streets are compared with others

20 Economic Indices Expenditures $/tree $/capita Benefits Net Benefits Benefit-cost ratios Why is it important? Evaluate return on investment Compare across categories Compare with other cities

21 Recommendations Desired Future State of the Urban Forest? Stocking Stability Management Functionality

22 Reference City Research: City Comparisons Cities in same region Fort Collins, Colorado Cheyenne, Wyoming Bismarck, North Dakota Boise, Idaho
23 Tree & People Populations 250, ,000 4:1 9:1 208, , ,000 Trees 100,000 3:1 3:1 Population 50,000 30,943 53,011 56,234 17,010 17,821 23,262 0 Ft Collins Cheyenne Bismarck Boise
24 Expenditures ($) 1,000, ,000 $998k $771k 600, ,000 $317k $328k Admin/Inspect/Other Infrastructure & Liability Irr/Litter/Grn Waste Remove/Dispose Pruning Planting 200,000 0 Ft Collins Boise Bismarck Cheyenne
25 Benefits 2,000,000 $2.17M 1,500,000 Property Increase $ 1,000,000 $993k $979k $686k Stormwater Air Quality CO2 Energy 500,000 0 Ft Collins Boise Bismarck Cheyenne
26 Comparison (?) per Tree Ft Collins Cheyenne Bismarck Boise Benefits $70.15 $40.33 $54.94 $42.70 Costs $32.24 $19.28 $17.77 $33.13 B/C Ratio st Place 2nd Place 3rd Place 4th Place Bismarck Fort Collins Cheyenne Boise New York City 5.60


27 Planning Green Infrastructure City expansion Greater economic services obtainable from trees
28 Extensive Sub-Regional Differences Cost of resources Tree level growth, species, age Infrastructure/repair costs Liability issues Employee costs


29 Environmental Service Price Differences Boise New York City
30 Relative Age Distribution Citywide 100 Boise NYC Cheyenne (%) % 70% 60% 50% 40% 30% 0 20% Citywide total Ideal Norway Ideal maple > % >36 0% Pear, callery Ash, green Honeylocust Silver maple Linden, Honeylocust little leaf Maple, Maple red Maple, Crabapple Norway Planetree, London Green ash American Ginkgo basswood Callery Oak, pin pear Maple, silver White ash American Citywide sycamore total DBH Class DBH Class DBH Class (in) Boxelder maple Crabapple Honeylocust Green ash Ponderosa pine Siberian elm Blue spruce Cottonwood/poplar Ideal Citywide total Willow Juniper species >36 % of Populati 0


31 Climate Affects Tree Size and Growth Silver Maple Cheyenne Ft Collins Height (f % 58% Years After Planting
32 Cheyenne Climate and Environmental Factors Weather: 4 th windiest city Highest incidence of hailstorms Average 14.4 inches precipitation annually Low humidity and higher altitude (6138 ft) Soils: Alkaline Low water-holding capacity
 20 18 16")

33 Management Affects Tree Size and Growth Sweetgum Bole & Total Height (m) Modesto Santa Monica 40% 26% 70% Years


34 Are your pruning cycles pruning dollars off of trees?
35 Extensive Regional Differences Tree level Cost of resources Air quality monitoring Building vintages/climate Infrastructure/repair costs Liability issues Administrative/Employee costs
36 i-tree International? Canada Europe Portugal Italy Spain Australia i-tree Team meetings integration Develop road plan Reference cities Resource units
37 Planning tools for manager, foresters, designers, landscape architects, and others USDA Forest Service Center for Urban Forest Research

38 Street Tree Simulator Stream of future benefits Level of service analysis Adjustments for mortality, infrastructure damage, etc. by species and city
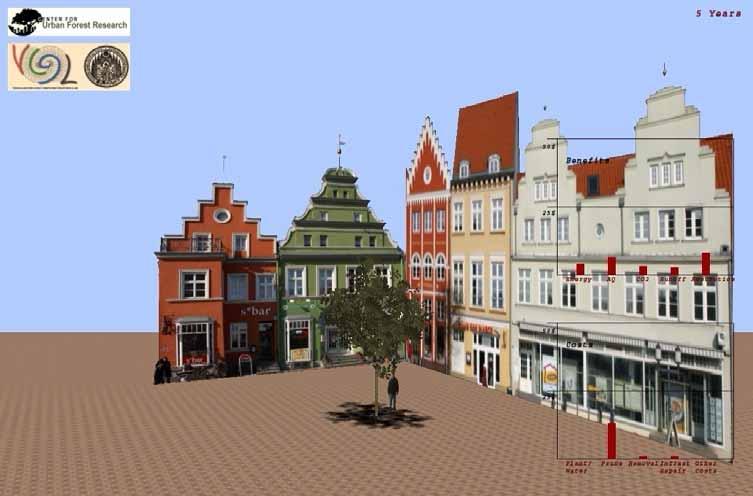
39 Tree Visualization
40 Urban Forest GHG/Carbon Reporting Protocols Trees in cities affect GHG in 3 ways Removing and sequestering GHG in trunks, roots, leaves as they grow Reducing electricity and gas use through shading thereby reducing power plant emissions Wood from dead trees produce biofuel, replacing fuels that produce more GHG

41 Visit our Websites Center for Urban Forest Research psw/programs/cufr/ i-tree STRATUM org/