CWS Landscape Conservation Guidance and Planning. Graham Bryan CWS-ON September 16 th, 2016 Bracebridge
|
|
|
- Melvin Reed
- 5 years ago
- Views:
Transcription
1 CWS Landscape Conservation Guidance and Planning Graham Bryan CWS-ON September 16 th, 2016 Bracebridge
2 Canadian Wildlife Service Part of Environment & Climate Change Canada CWS is responsible for wildlife matters that are related to species of federal concern. This includes protection and management of migratory birds as well as nationally significant wildlife habitat, endangered species, control of international trade in endangered species and applied science on wildlife issues of national importance. Less jurisdiction over non-federal lands such as much of the Georgian Bay and Muskoka region but still many mandated species: migratory birds, species at risk Page 2 September-19-16
3 Developing a landscape conservation plan Tendency to take a species approach, and lose the big picture Amounts and types of habitat habitat guidelines Places of interest biodiversity atlas The guidelines and atlas help allow CWS to better understand the distribution and the state of habitat and landscapes, share that information and provide guidance, helping to facilitate the conservation of important natural places. Page 3 September-19-16

4 Habitat Guidelines Page 4 September-19-16
5 Significant impairment in stream water quality and quantity is highly 21 guidelines and supporting likely text based above on 10% an impervious extensive land cover and can often begin before Focus on federal terrestrial biodiversity this threshold portfolio: is reached. migratory In urban birds, Species at Risk, Great systems Lakes related a second habitat, threshold globally is and likely reached at the 25 to 30% At a minimum, the greater of (a) 10% of each major watershed and 6% of each literature subwatershed, review or (b) 40% of the historic watershed wetland coverage, should be protected and restored. Wetlands nationally that rare, etc. in close proximity to each other, based on their functions, level. or that are in close proximity to other natural 1998, rev. features, 2004, should 2013 be given high priority in terms of landscape planning. Forest, wetland, riparian/watershed & grassland 30% watershed forest cover is a high risk minimum, 50% Non-regulatory, not mandatory 30 m wide naturally vegetation Originally written to answer the question from AOC adjacent to streams, greater practitioners: Well, how much habitat depending on conditions cover is enough is a until low things risk are unimpaired?!? 75% of stream length should be cover. naturally vegetated forest patches should be within 2 km of each other or other supporting habitat feature Focus on restoring and creating grassland habitat in existing and potential grassland landscapes.

6 Habitat guidance for the Southern Boreal Shield (aka HMDITM) How Much Disturbance is Too Much? Habitat Conservation Guidance for the Southern Canadian Shield REVISED FINAL REPORT MARCH Page 6 September-19-16
7 Southern Shield guidance Response to request for guidelines specifically for Shield environment Different from HMHE: Relatively intact vs. fragmented landscape Opportunity to protect and conserve, not just restore Less available science relevant to southern shield How to deal with dominant natural matrix with an embedded, but growing, human footprint. Still draft focus has been on mapping a couple of the key overarching guidelines Page 7 September-19-16
8 Southern Shield: key guidance Identify and conserve, respectively, Regional Habitat Mosaics and Local Habitat Mosaics that capture relatively high levels and/or concentrations of habitat diversity and are predominantly natural areas subject to low levels of disturbance by human activities. Regional Habitat Mosaics and Local Habitat Mosaics should cover at least 50 to 60 percent of their respective jurisdiction. These mosaics should include habitats that are uncommon in the landscape as well as good representations of more common habitat types, a diversity of age classes for forested habitats and promotion of landscape connectivity. Page 8 September-19-16
9 Other HMDITM guidance Ensure habitat mosaics provide for full range of species, especially those sensitive to lakeshore development Maintain buffers between important wetlands and roads Consider the positive ecological influence of natural lakeshores and potential negative influence when disturbed or developed No development zones around portions of lakes and rivers Avoid roads in regional and local habitat mosaics Avoid locating roads between wetlands Lakeshore connectivity cannot necessarily be compensated by habitat corridors away from the lakeshore Maintain large contiguous habitat patches Consider the connectivity needs of species at risk as a model for establishing landscape connectivity Focus on conserving diversity of wetlands Maintain Critical Function Zones and Protection Zones for wetlands Page 9 September-19-16
10 Overarching guidance Take a habitat mosaic approach In brief Conserve 50-60% of the landscape at low levels of human disturbance Predominantly natural High habitat diversity Uncommon and representative habitats Large patches Range of forest age classes Connected, un-fragmented Page 10 September-19-16

11 Southern Shield: what would 50% look like? Page 11 September-19-16
12 Places of Interest Biodiversity Atlas: Ontario Mixedwood Plains & Boreal Hardwood Shield Page 12 September-19-16

 analysis. Page 13 September-19-16")
13 Assessing the landscape Geospatially represent CWS biodiversity portfolio: Species and habitats e.g. migratory birds, species at risk Habitat and landscape condition e.g. % forest cover, fragmentation Coarse, medium and fine resolution analyses: Ecoregions 100,000 s ha Bird atlas squares - 10 km Hexagons 2 or 5 ha 14 biodiversity criteria used in coarse analysis; up to 30 used in fine resolution (2 or 5 ha units) analysis. Page 13 September-19-16


 subdivided into 53 ecoregions; SBS (BCR 12) was")
14 Assessing the landscape Geographically represent species and habitats within the CWS biodiversity portfolio such as Species at Risk (SAR), migratory birds, wetlands and globally rare species. Coarse, medium and fine resolution analyses Coarse analysis: MWP (BCR 13) subdivided into 53 ecoregions; SBS (BCR 12) was subdivided into 60 ecoregions. Page 14 September-19-16
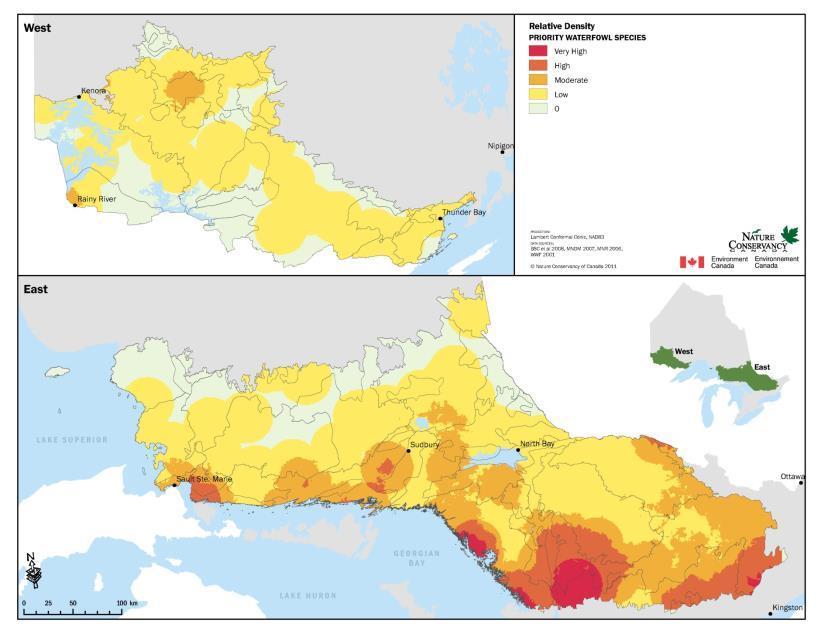
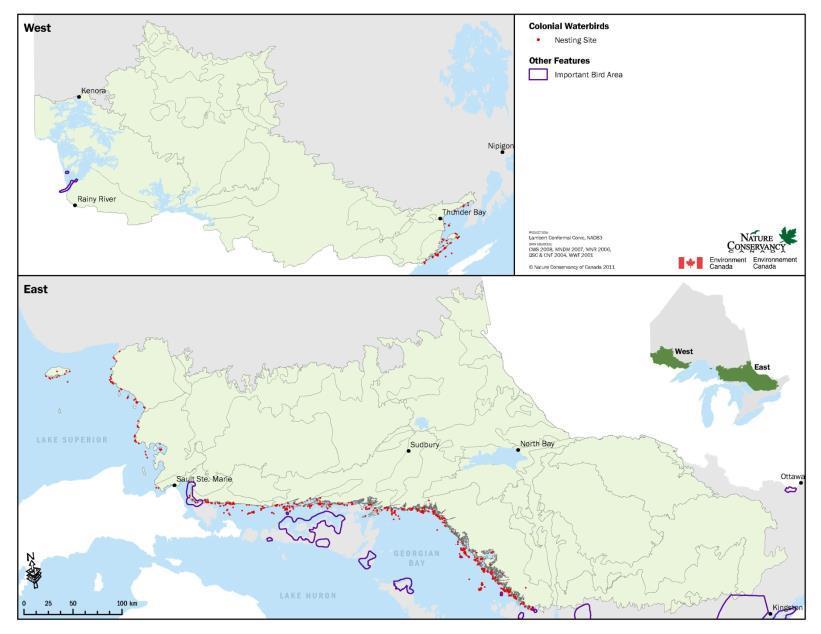
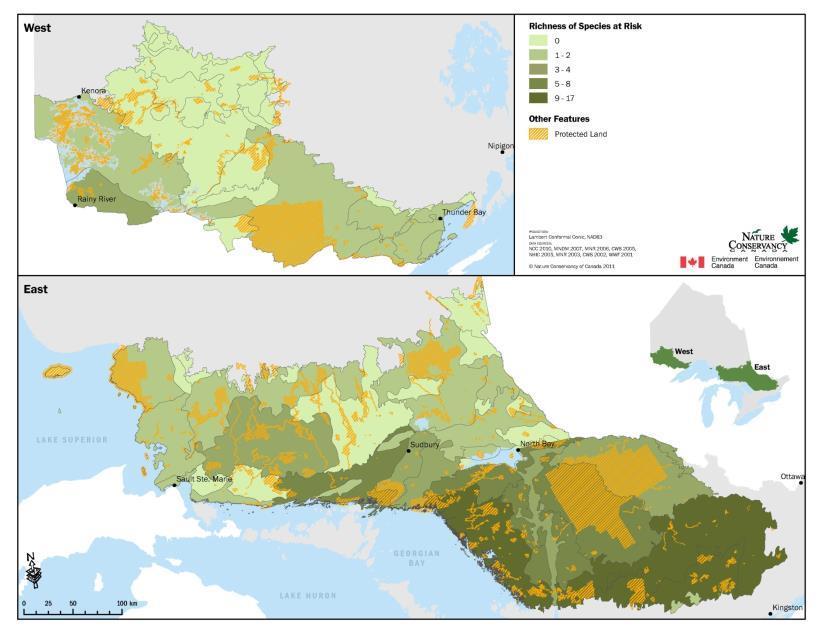
15 Assessment - Coarse 14 biodiversity elements mapped & scored for each ecoregion w/n BCRs 12 and 13: SAR richness, count, irreplacability, globally rare species richness, coastal wetlands, colonial waterbird colonies, Relative density by BCR bird guilds Relative density forest & open country birds area of suitable landbird stopover habitat, area of suitable shorebird stopover habitat, and; area of suitable waterfowl stopover habitat. globally rare spp. landbird stopover Page 15 September SAR richness
16 SBS/BCR12 - ecozone scale results Page 16 September-19-16
17 SBS/BCR12 - ecozone scale results Page 17 September-19-16
18 SBS/BCR12 - ecozone scale results Page 18 September-19-16
19 SBS/BCR12 - ecozone scale results Page 19 September-19-16
20 SBS/BCR12 - ecozone scale results Page 20 September-19-16
21 Page 21 September-19-16
22 SBS/BCR12 - ecozone scale results Page 22 September-19-16
23 SBS/BCR12 - ecozone scale results Page 23 September-19-16


24 SBS/BCR12 - ecozone scale results Page 24 September-19-16

25 Coarse & Medium analysis resolutions coarse & medium Page 25 September-19-16


26 Fine resolution Units of resolution: 2 ha for Mixedwood Plains, 5 ha for Shield Page 26 September-19-16


27 added landscape condition Retained12 biodiversity elements as used in coarse and medium resolution analyses Added 20 landscape & habitat condition criteria, such as; wetland cover per watershed, riparian natural cover, forest cover per watershed, representation/diversity, Size of open country patches, forest connectivity, old growth/interior forest, Wetland proximity, etc. Page 27 September globally rare spp. landbird stopover SAR richness
28 landscape & species metrics egs.: details, scoring Wetland W1 Wetland Cover in Watershed Watersheds with functional wetlands/higher wetland cover Identify wetland patches in watersheds with <6% cover >10% cover = % cover = 7 2-6% cover = 5 <2% cover = 0 HMHE Species at Risk S1 Richness Number of different SAR Element Occurrences by hexagon Score = 25 per END EO Score = 20 per THR EO Score = 10 per SC EO CWS & NCC 2011 Migratory Birds Riparian Forest B6 Forest Bird Density R3 Impervious Surface F1 Forest Cover Forest habitats in high density regions Habitat within subwatersheds of <10% impervious cover Forests in subwatersheds with <30% and 30-50% forest cover Forest habitat within region of high forest bird density (atlas square) = 10 Identify watersheds with >10% impervious cover <5% impervious cover = % impervious cover = % impervious cover = 5 >20% impervious cover = 0 Identify amount of forest cover by subwatershed for forest patches BCR13 >50% forest cover = % forest cover = % forest cover = % forest cover = 3 <10% forest cover = 0 CWS & NCC 2011 HMHE F1 Forest Cover BCR12 >60% forest cover = % forest cover = % forest cover = % forest cover = % forest cover = 1 <20% forest cover = 0 Page 28 September-19-16
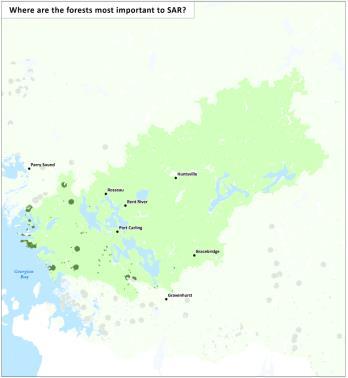
29 Landscape Conservation Assessment: Simplified elements and steps Landscape elements Landscape scores Combined landscape & species scores High conservation value landscapes Wetland cover Wetland coastal Wetland adjacent Wetland size Riparian 30m Riparian 75% Riparian impervious Wetland proximity Wetland connectivity Riparian connectivity Highest quality wetlands Highest quality Riparian zones Wetlands most important to SAR Wetlands most important to birds Highest quality Wetlands with multiple conservation values Open Country natural Open Country proximity Open Country heterogeneity Open Country size Highest quality Open Country Open Country most important to SAR Open Country most important to birds Highest quality Open Country with multiple conservation values Discrete Sites: High biodiversity value natural areas Forest cover Forest big woods Forest patches Forest connectivity Forest interior Highest quality Forests Forests most important to SAR Forests most important to birds Highest quality Forests with multiple conservation values Representivity / Diversity Species & habitat elements Species & habitat scores SAR richness SAR candidate SAR global rarity SAR CH SAR irreplace Top overall scoring areas for SAR Mig. birds colonial MB waterfowl stopover MB Landbird stopover MB grassland bird density MB forest bird density MB shorebird stopover MB waterfowl density Top overall scoring areas for birds
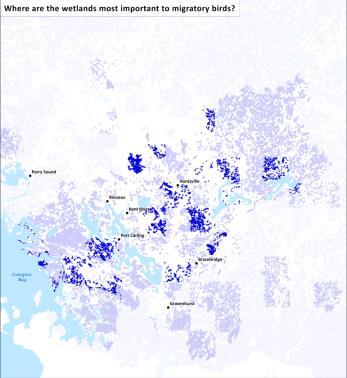
30 Basically We can map scores for about 30 different things at a resolution from 5ha to the entire ecozone Where are the big forest patches? Where are watersheds with 10% wetland cover? We can progressively combine scores to tell you more and more about biodiversity Where are the highest quality forests? Which ones are important for birds? For SAR? Where forests with multiple high values? Where are the places with the highest value forests, wetlands and open country? Where are the areas of highest overall biodiversity value? Page 30 September-19-16


31 Themes: Answer key questions at various scales Page 31 September-19-16
32 example: Wetlands Page 32 September-19-16

33 Example wetland maps based on 5 criteria Adjacent natural veg. Wetland Cover in Watershed Proximity Coastal wetlands Wetland size Page 33 September-19-16
34 Example: Combine individual criteria for total score Total wetland score Page 34 September-19-16
35 Example high quality wetlands important for birds Page 35 December 13 th 2011
36 Example: forest Page 36 September-19-16


37 Local example; Muskoka watershed Page 37 September-19-16


38 Local example; Muskoka watershed Page 38 September-19-16

39 Places High Value Biodiversity Areas Page 39 September-19-16
40 High Value Biodiversity Areas within Muskoka watershed Page 40 September-19-16


41 Creating a ~50% natural matrix for BCR 12: Human Influence Analysis Page 41 September-19-16
42 Human Influence analysis 8 criteria covering 4 categories of disturbance were analyzed Categories: Transportation Infrastructure, Human Settlement, Human land Use Change, Power Infrastructure Eg: Transportation Infrastructure roads criteria Transportation Infrastructure A1 Roads Distance to roads Expressways 0-90 m = m = m = m = 4 Buffer; assign maximum value based on road class Primary/Secondary Highways 0-90 m = m = m = m = 2 Primary/Secondary Local Roads 0-90 m = m = m = 2 Vehicular trails 0-90 m = m = m = 1 Page 42 September-19-16
43 Page 43 September Transportation infrastructure

44 Human Settlement Page 44 September-19-16
45 Page 45 September Land use Change
46 Power Infrastructure Page 46 September-19-16
47 Overall Human Influence Page 47 September-19-16

48 Overall Human Influence- Muskoka Page 48 September-19-16


49 ~50% natural matrix for BCR 12: a representative high value ~50% natural matrix for BCR 12 = 90% of the Georgian Bay region Page 49 September conserved in a natural matrix

50 Ecozone 50% Habitat Mosaic: Muskoka watershed portion Page 50 September-19-16
51 Conservation & other implications Protection: How much of the high biodiversity value areas and/or the natural matrix is protected? As per Achi commitment of 17% or through land use planning or other means? Southern Shield fares better than the BCR 13 at the very least. Thresholds: 50-60% is one threshold: what other thresholds matter ecological or otherwise? E.g. tourism Land use planning: is the geospatial analysis useful for natural heritage plans? PPS designations? Securement strategies? Etc.. Page 51 September-19-16

52 Limitations and potential issues Special or unique features: Granite barrens showed up as low scores Human Influence: under-represent populated shorelines? Issues with distribution of human population. Roads as disturbance vectors but not barriers. Threats analysis: none Connectivity: connectivity was a criterion for forest score only. Survey effort data gaps: such as breeding bird atlas coverage Local knowledge, local review Page 52 September-19-16
53 Considerations - What are the right thresholds? - What are the best Human Influence criteria? - Are existing criteria applied properly? - How do we introduce connectivity? - What about existing protected areas? - Error is it increasing or decreasing with multiple, often correlated layers? - Reality check does this make sense? - Context: guidelines + maps do not equal a complete planning process Page 53 September-19-16
54 Principles, warnings and thoughts Just cause it looks good doesn t mean it s right. This won t work everywhere the Far North lacks the data for decent blueprints Assumes we invest in the biodiverse areas you could flip that around Maps are abstractions the earth is actually more complicated. Plan accordingly. We didn t map the air column. Or water columns. Or the soil horizons. Maps are 2D. Maps are not real time, nor detailed enough to show most ecological changes within a habitat patch. We can t draw fuzzy lines in GIS. Blueprints, guidelines, targets, are human constructions tools for us to get a grip on hopelessly complicated ecosystems. Use your judgement. Maps and guidelines help us communicate biodiversity to different audiences. Page 54 September-19-16

55