Soil compaction as a driving force for changes in soil functions
|
|
|
- Magnus Daniels
- 5 years ago
- Views:
Transcription
1 European Summer School on Soil Survey Soil compaction as a driving force for changes in soil functions Beata Houskova Soil & Waste Unit Institute of Environment & Sustainability JRC Ispra 2nd European Summer School on Soil Survey June 2004
 natural origin (typical - change in aggregates arrangement) human origin (typical change in particles arrangement) the integration of natural and human")
2 Definition of Soil Compaction Soil degradation process deterioration of all soil properties: directly (physical properties), indirectly (chemical and biological properties) natural origin (typical - change in aggregates arrangement) human origin (typical change in particles arrangement) the integration of natural and human origin
3 Common features of compacted soil Formation of compacted layer (plough pan); Unfavourable water regime (stagnation of water on soil surface, runoff, wetting, higher wilting point in comparison with not compacted soil); Significant bulk density increase and total porosity decrease in comparison with natural one; Low aeration. generally below 10 % of volume (e.g. for microorganisms activity 20 % is optimum); Compacted soils have different heat regime. Generally, wet soils warm more slowly in comparison with dry ones; Nutrients are concentrated in top layer. lower parts are almost without nutrients available for plants; Yields, even soil fertility decreasing; Acceleration of the other degradation processes mainly water and wind erosion; Decreasing of soil biodiversity by affecting the habitat of soil organisms; Soil compaction affects plants roots also indirectly through affecting soil microorganisms habitat.
4 Impacts of Compaction: non-compacted soil compacted soil Depth (cm) percolation / infiltration filtering to groundwater buffering seepage compacted layer runoff [erosion. pollution] to surface water Bulk density higher than 1.9 g.cm -3 stops the ability of plant roots to grow
5 Common causes of soil compaction Naturally induced soil compaction Main factors: textural category (amount of clay>35%) and soil morphological unit (argillic horizon, illimerisation, gleying, podsolization) Soil compaction induced by human activities Induced by intensive or incorrect land use (agriculture. forest management); Low amount of deep rooting structure forming plants in crop rotation, e. g. fodder crops; High amount of root crops (soil properties worsen plants: root system, agrotechnics with high amount of crossing on the field); Low amount of organic residues.
6 Soil morphological units according to their susceptibility to natural compaction Soil units (WRB 1994) Susceptibility to natural compaction Histosols Anthrosols Rendzic Leptosols other Leptosols Andosols Arenosols Chernozems Phaeozems Mollic Fluvisols and Mollic Gleysoils The other Fluvisols Eutric Cambisols Dystric Cambisols and Umbrisols Haplic Luvisols The other Gleysols Podzols Planosols Albic Luvisols and Glossisols Stagnosols low low low low low low low low medium medium medium medium medium high high high high high
7 Soil textural categories
8 Influence of compaction origin on the soil profile properties Natural soil compaction Bulk density (ρd g.cm -3 ) of medium heavy naturally compacted soil ρg.(cm -3 ) y = 0.063x R 2 = limit value depth
9 Influence of compaction origin on the soil profile properties Soil compaction induced by human activities Bulk Density (ρd g.cm -3 ) of secondary compacted soil; Kľač any ρd (g.cm -3 ) y = -0.11x R 2 = limit value depth


10 Depth of compaction depending on axle load and soil moisture increases (Soehne, 1958)
11 Approximate axle loads for field equipment Equipment Slurry tanker gal. Slurry tanker gal. 6-row combine. empty 12-row combine. empty 12-row. full with head 720 bu grain cart. full. 1 axle Beet cart. full Grain cart bu.. 1 axle Grain cart bu.. 2 axles 4WD Tractor. 325 HP. front axle 4WD Tractor. 200 HP. front axle MFWD Tractor. 150 HP. rear axle Axle Load (Tons/axle)
12 Assessment of the soil susceptibility to compaction Method of possible soil compaction determination PD = ρ + d (0.009 * %clay) [g.cm -3,kg.m -3 ] Packing density categories Class L M H Confidence Low Medium High
13 Subsoil Susceptibility to Compaction Packing density g cm -3 Texture Low Medium High Code Class < > Coarse VH H M 1 2 Medium H M M 3 Medium fine M(H) M L 3 4 Fine M 2 L 4 L 3 5 Very fine M 2 L 4 L 3 9 Organic VH H 1 except for naturally compacted or cemented coarse (sandy) materials that have very low (L) susceptibility. 2 these packing densities are usually found only in recent alluvial soils with bulk densities of 0.8 to 1.0 t m -3 or in topsoils with >5% organic carbon. 3 these soils are already compact. 4 Fluvisols in these categories have moderate susceptibility Class L M H VH Susceptibility Low Moderate High Very High European Soil Information


14 Bending earthworm channels in the platy structure Soil Compaction
15 Indicators and methods of soil compaction assessment (The rule of textural dependence) The limit values of soil physical properties according to textural units SOIL SOIL TEXTURAL CATEGORY PROPERTY Clay Clayey Loam Sandy loam Loamy sand Sand Bulk density (g.cm -3 ) Penetrometric resistance (MPa) * according to soil moisture > > > > > > (% of weight) Porosity (% of volume)** Minimal air capacity (% of volume) Maximal capillary capacity < 48 < 10 >35 < 47 < 10 >35 < 45 < 10 >35 < 42 < 10 - < 40 < 10 - < 38 < 10 - (% of volume) Clay content (< mm) >30 > Plasticity index >25 >25 > Notes: * if the actual soil moisture content does not fit to the given moisture interval it is necessary to add 0.25 MPa to the measured resistance value (in case of higher soil moisture) or to take away 0.25 MPa (in case of lower moisture content) for every 1% (of weight) difference ** 10 % of volume is the average value of air capacity. For different crops this value changes: root-crop - limit air capacity is 12 % of volume cereal - limit air capacity is 10 % fodder - limit air capacity is 8 %.
16 Average annual losses of organic carbon (t/c.ha -1 ) from the soil according to the productivity potential and crops Soil category according to productivity potential Plant groups I II III Soil category: Plant group: 1 soils with high productivity potential 2 soils with medium 3 soils with low productivity potential (source: Jurcova. Bielek. 1997) 1. fodder crops; inhibitor of organic matter mineralization and soil erosion and compaction 2. cereals. peas. lupin. soya. colza; neutral plants (neutral plants) 3. sugar beet. mangel-wurzel. potatoes. corn. sunflower. chicory. poppy. tobacco; increased intensity of organic matter mineralization leading to losses of organic C in soil profile, increase of soil susceptibility to erosion and compaction
17 Methods of soil compaction investigation Field observations; Field measurements (penetrometric resistance, hydraulic conductivity); Laboratory measurements (core samples for bulk density, porosity and capillary capacity determinations)


18 Field observations Occurrence of areas with water stagnation on the soil surface mainly in tracks of agricultural machinery after precipitations, irrigations or snow melting

19 Slow and irregular plants grow Field observations Crop height m at maturity Crop height m at maturity Crop height m at maturity

20 Plants distribution Field observations

21 Yellowed leaves of vegetation Field observations

22 Crust and cracks formation Field observations

23 Roots deformation Field observations
24 Penetrometric resistance Field measurements Field Distance of individual measurements homogeneous m; i.e. cca 5 ha heterogeneous m; cca 1-3 ha hill side m; cca 1 ha The number of punctures is on the homogeneous field from 5 to 10, on the heterogeneous one it is from 10 to 15. It is necessary to execute the correction of field measurements according to actual moisture content in the profile. Evaluation of penetrometric measurements Soil compaction is detected on 15 to 20 % of investigated field: ameliorative measure is not necessary; Soil compaction is detected on 20 to 40 % of the field: ameliorative measure is necessary on compacted part of field; Soil compaction is detected on more than 40 % of field: it is necessary to execute the ameliorative measure on the whole field.
25 Field measurements Penetrometric resistance (MPa) of secondary compacted soil. 5,5 5 4,5 4 y = 0,0027x 2-0,176x + 4,8698 R 2 = 0,8706 3,5 3 2,5 2 1,5 1 0, MPa average STD critical value Poly. (average) depth (cm)
26 Field measurements Hydraulic conductivity determination o Saturated hydraulic conductivity K s [LT -1 ] o Unsaturated hydraulic conductivity K(h) [LT -1 ] K(h) = K s exp (αh), α = ln [Q(h2)/Q(h1)]/h2 h1 α parameter Q(h1), Q(h2) - water flow at tension 1, 2 o Preferential flow, bypassing ratio (Br) [%] BR = [K s K(-3 cm)] / K s * 100 K (-3 cm) non saturated hydraulic conductivity at tension -3 cm
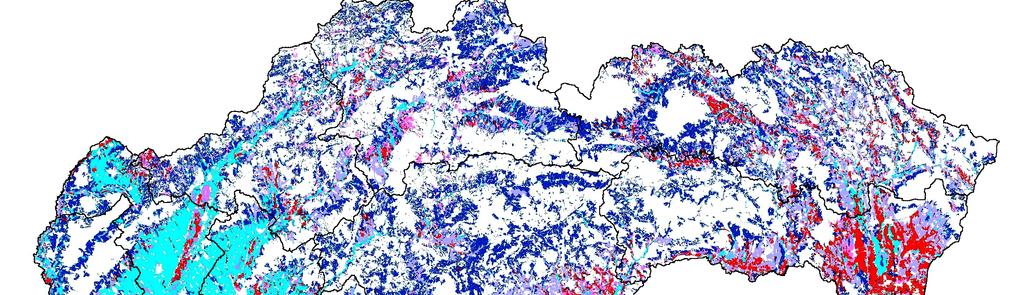
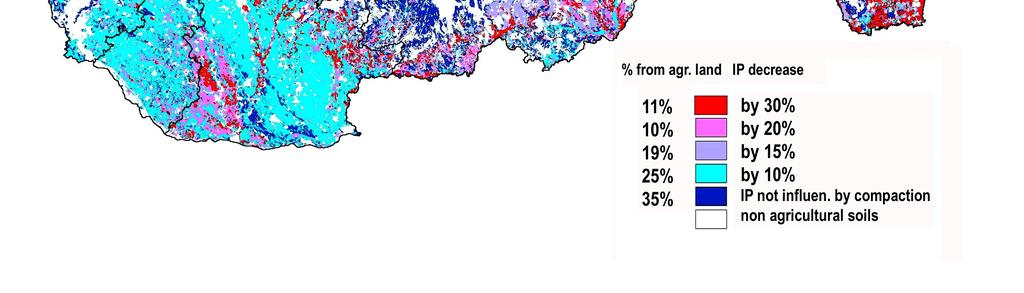
27
28 Prevention and sanation Prevention Use of the agrotechnics with lower weight Decreasing of the number of operations Crop rotation Increasing of soil structure stability (manure) Sanation Deep tillage/subsoiling (+,- effects) Reduced tillage/no till (+,- effects)
29 Framework (DPSIR) for Soil Compaction European soil protection policy Agriculture intensification Land use practices continuous cultivation deforestation Pressures Driving Forces State Responses On-site: soil degradation compaction loss of structure Soil Protection Strategy Impacts Good agricultural practice - low ground pressures - timing of cultivations - alleviation measures - conservation tillage On-site - reduction in water storage capacity - increased soil erosion Off-site - pollution of surface waters - effects on regional drainage - flooding
30 Sources of pictures, maps, tables and graphs CETS, University of Minnesota Extension Service Bielek, P.- Jurcova, O. SSCRI, Bratislava. Slovakia Houskova, B. SSCRI, Bratislava. Slovakia Lhotský, J. et al Methods of compacted agricultural soils reclamation. ÚVTIS, Praha. Shepherd, G. (2000): Visual Soil Assessment. ISBN New Zeeland Soil Science and Conservation Research Institute, (SSCRI). Bratislava. Slovakia