ALOS Kyoto & Carbon (K&C) Initiative 9th Science Team Meeting. Marcela Quinones & Dirk Hoekman January 2008,Tokio
|
|
|
- Linette Weaver
- 5 years ago
- Views:
Transcription
1 ALOS Kyoto & Carbon (K&C) Initiative 9th Science Team Meeting Marcela Quinones & Dirk Hoekman January 8,Tokio
2 Contents Mapping approach new developments & new products: Example maps based on PALSAR. Peat swamp forest product development. Mapping of forest structure and land Cover. Hydrological cycle in relation to Radar. Available data in archive Partnerships and collection of field and reference data for South East Asia and Guyana Shield. Data and product development plan
3 Mapping approach using innovative algorithm Fundamental steps of the processing chain for unsupervised classification () Fully Polarimetric Transform (FPT) Polarimetric Radar Images () Region Growing Segmentation (RGS) (on selected areas) (3) Model-based Agglomerative Clustering (MAC) (on homogeneous segments) The overall (or primary) objective is the transformation of a polarimetric ( or multitemporal) radar image into a map of homogeneous segments. These segments can be grouped into a number of clusters. (4) Expectation-Maximalization for range of selected models (EM) (on pixels of segments) (5) ML + MRF classification (on entire image) (6) Optional step: Comparison with groundtruth to develop legend (A) Unsupervised segmented image Groundtruth Cluster statistics (for each model) (B) Segmented classified image Advantages of this algorithm: ) Is not affected by speckle and ) is able to combine data in a multidimentional space to separate classes that aparently are not possible to separate.


; and model adding classes such as")
4 Mapping approach Example: Central Kalimantan Alos PalSAR Dual_Pol FB Example using Polarimetric data: Use of new polarimetric decomposition intensities Containing all polarimetric information Example series of classification models: PalSAR dual-pol input radar image composite (left); model 3 resulting in separation of forest and nonforest (mid-left); model 6 resulting in further separation of water and bare areas (mid-right); and model adding classes such as herbaceous cover, shrub cover and open forest (right).
5 Mapping approach Study Site: Central Kalimantan Data source Alos PalSAR L-HH Temporal composite Wet period Dec-Mar-May Complexity of the area required an special Stratify classification approach


6 Mapping approach: use of Forest non forest Mask 5 classes Non forest mask: Create with LandSAT Forest area classification combination 3 classes Forest mask created with LandSAT Non-Forest area classification 5 classes
7 Application of algorithm to images and creation of Path and BIC files Guaviare bic Ps Path file Model # BIC = Bayesian Information Criterion: statistical measure of how good the classification is. Gives information. On What is optimal number of classes to retrieve information of image Path file indicates the most common Vectors of classes for a certain pixel in the series of models/classifications It gives an indication of which classes are closer statistically and how classes split and merge from one model to the next. Aggregation of classes using field information Creation of a radar based legend Legend Definition and class labeling process:
8 Legend Definition and class labeling process: use of International legend systems to standardize products Important Step in the standardization of products at International level Radar based legend Extraction of backscatter values per class Backscatter level analysis LCCS legend and labeling FAO and UNEP classification system 5 m pixel size georeference- PalSAR unsupervised classified mosaic (3 classes) Definition of initial vegetation types and labels Definition of names according to the LCCS system (at least until the Dichotomous phase. GIS Data Integration and expert knowledge MODIS hot spot data Landsat time series MODIS vegetation continuous fields Field photographs and data Available maps and aerial photos Final Map legend and class color selection
. Images resample to 5 m and all dates and all polarizations per scene were use in the classification.")
9 Integration of other Radar data to complement and increase accuracy: ASAR APP data processing: 4 images (6 scenes and 4 dates polarizaions/scene) calibrated and geo-referenced using standard procedures provided by ESA (European Space Agency). Images resample to 5 m and all dates and all polarizations per scene were use in the classification. ASAR-APP C band VV&VH scenes/4 dates Calibration and georeferencing with provided data by ESA.5 m pixel size geo-referenced ASAR-APP data Resample to 5 m. Image stacking using multidate data ASAR data was available for complete dry and wet period allowing classification of low biomass range classes. 5 m pixel size georeference-multidate ASAR-APP (6 scenes) 5 m pixel size geo-referencemultidate ASAR- APP (6 scenes) Unsupervised classification Using Markov random fields algorithm 5 pixel size classify image Creation of ROI s from classes Radar data extraction per class Backscatter analysis of classes and class labeling


10 ASAR APP Mosaic Multitemporal-VV &HV composites


11 ASAR APP based, classification Dry crop class

12 PALSAR imagery used After registration to SRTM SAR image dates:
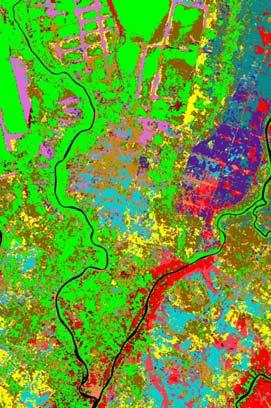
13 Land cover use map based on Fao legend First product created for a High complex ecological Area, created sin only L-HH 7 SarVision PALSAR 5m Legend: Produc of SarVision Marcela Quinones, Niels Wielaard, Martin Vissers, Vincent Schut and Dirk Hoekman

 Rice paddy field (irrigated) Bush (shrub cover) Bare land Not identified, no data Water")
14 3 MoF / BAPPEDA official map Legend: Swamp bush (shrub cover) Dry land forest primary Dry land forest secondary Mangrove forest primary Mangrove forest secondary Swamp forest primary Swamp forest secondary Plantation forest Horticulture (plantation cropland) Settlement Mining area Dry land agriculture / bush Swamp (wetland) Rice paddy field (irrigated) Bush (shrub cover) Bare land Not identified, no data Water body

15 Sub-product of the LCU map 6 mid-7 Fires Fire hotspot data from MODIS and ATSR NASA/ University of Maryland, ESA/ESRIN Legend: Red dots: represents fire hotspot detected in the center of approx. km pixel This type of products allows Monitoring of fire events, fire damage And regeneration processes


16 A sub product of the Land cover classification: Use in REDD Monitoring REDD:Reduce Emmisions from forest and degradation Covering entire Indonesia Used in Central Kalimantan by local government: World s first avoided deforestation project for peatland carbon conservation New land cover map every year For accurate carbon accounting PALSAR radar imagery May 7, m detail Collapsed dome Forest area Carbon stock Carbon budget example Average estimate 63, hectare 34,86, tons New land cover map every year For accurate carbon accounting and monitoring
17 Some problems identify in In the classification process: Separation of flooded forest from burnt areas Separation of bushes forest pastures and cropland We expect to solve the confusion between classes: Use of HV data Use of at least one year data To include dry period information Not enough field information Separation of Mangrove from flooded peat forest
18 Mapping approach: advantages Algorithm reveals intrinsic data structure It can be apply on time series as well as on polarimetric data It allows the integration of many layers of data allowing the mapping of ecologically complex areas that can be distinguish for instance by their water regime. Relevant incidence angle and topographic effects fall in separate sub-classes It allows aggregation of classes to match desired legend based on radar estadistics. Legend development according international standards: It allow the detection of missing ground truth. Combination with other type of radar data like ASAR APP increases mapping possibilities and accuracy
19 Status of Product development: Main achievements Extensive ground data collection campaign in period July-October 7, more than observation points. Field photos available First products for Central-Kalimantan available in October 7 proved robustness of classification algorithm. ( paper is in preparation to be submmited to IEEE) Collection of hydrological data after cycle 6 (January 8) in the Mawas peat swamp allows calibration of hydrological features such as flooding and ground water level in combination with AlosPALSAR data. IMPORTANT data for peat water level evaluation in relation with radar. First results encouraging: main cover types can be distinguished and different type of products can be created with high accuracy. Legend development techniques allows matching with Internationally used legends


20 Status peat swamp product development: Available Data: Fine beam Dual Pol Last data received in October 7


21 Status peat swamp product development: Available Data: Fine beam Single Pol Last data received in February 7

22 Status peat swamp product development: Available Data: Wide Beam mode Last data received in April 7


23 Status peat swamp product development: Available Data: Wide Beam mode Last data received in April 7


24 Status of Product development: Strip data processing in Kalimantan, Orthorectification software available

25 Status of Product development: Strip data processing in PNG, example


26 Status of Product development: Example in RIAU peninsula, comparison with available Google earth


27 Status of Product development: Example in RIAU peninsula, Land use observations in RIAU Plantations Open areas Logging roads
28 Status of Product development: mangroves in PNG Dual polarization allow Characterization of Mangrove areas Mangroves In this espect we will search coperation with Richard for the mangrove classification, searching for physical explanations. This will be made on the frame of the L and P band ESA.
 3) Indonesian Ministry of Forestry 4) (To be confirmed) Univ. Bogor (IPB) (oil palm) 5) Leuser park Leuser Int.")
 Central Kalimantan Peat Programme (peat swamps) BOS, WWF, Wetlands Int., Delft Hydr, Winrock, Leicester Univ.")
29 Status on product development: Partners and Data Users in Insular South East Asia 5) Field work support B3&C ) MACRES, Forest Research Institute Malaysia (FRIM) ) Heart-of-Borneo WWF (Indonesia/Malaysia/Brunei) 3) Indonesian Ministry of Forestry 4) (To be confirmed) Univ. Bogor (IPB) (oil palm) 5) Leuser park Leuser Int. Foundation 6) Riau/Jambi, Kampar peninsula Eyes-on-the-forest WWF, Wetlands Int., Delft Hydr and Leicester Univ. 7) Central Kalimantan Peat Programme (peat swamps) BOS, WWF, Wetlands Int., Delft Hydr, Winrock, Leicester Univ. 8) ESA/INDREX BOS sites 9) Mahakam delta (mangroves) - WUR ) Peat swamps ) Forest Wetlands 6) 4) 6) 6) 7,8) 3) 9) Mangroves

 3) Mamberamo basin (and PNG) Conservation Int. 4) Papua Govn.")
30 Status peat swamp product development: Partners and Data Users in PNG SarVision in actively searching for processing funding in colaboration with all this organzations Field work support B3&C ) Indonesian Ministry of Forestry ) Eyes-on-the-forest WWF (8?) 3) Mamberamo basin (and PNG) Conservation Int. 4) Papua Govn. (in process) 5) Greenpeace Mamberamo wetlands Forest Wetlands,,4,5) 3) 3)

 Aug-Dec 8 (Phase 3: Entire prototype area) Est.")
. date of delivery: January 9")
31 Production schedule and product description: South East Asia Product name: W7- Mangrove extent and properties Description: Map of extent, and anthropogenic change. Prototype area Indonesia PALSAR mode: ScanSAR Observation cycles: 7-6 ( cycles) Production schedule: Mar-Aug 8 (Phase : Large representative areas) Aug-Dec 8 (Phase 3: Entire prototype area) Est. date of delivery: January 9 Product name: W8- Tropical peat swamp forests Description: Map of extent, vegetation and hydrological characteristics, and disturbance (total area: ~7 m ha). Prototype area Indonesia PALSAR mode: ScanSAR Observation cycles: 7-6 ( cycles) Production schedule: Mar-Aug 8 (Phase : Large representative areas) Aug-Dec 8 (Phase 3: Entire prototype area) Est. date of delivery: January 9
. Previously unmapped PALSAR mode: ScanSAR Observation cycles: 7-6 ( cycles) Production schedule: Mar-Aug 8 (Phase : Large representative areas) Aug-Dec 8 (Phase 3: Entire prototype area) Est.")
 Aug-Dec 8 (Phase 3: Entire prototype area) Est.")
32 Production schedule and product description: South East Asia Product name: Wx- Mamberamo basin, New Guinea Description: Map of vegetation characteristics, including Sago swamp forests, (total area: ~8 m ha). Previously unmapped PALSAR mode: ScanSAR Observation cycles: 7-6 ( cycles) Production schedule: Mar-Aug 8 (Phase : Large representative areas) Aug-Dec 8 (Phase 3: Entire prototype area) Est. date of delivery: January 9 Product name: F5/F8- Tropical forest and land cover change monitoring Description: Yearly updates of forest cover (types) and basic land cover types. Prototype area Indonesia and PNG PALSAR mode: FBS, FBD Observation cycles: 9, 3, 7, Production schedule: Jan-Jun 8 (Phase : Large representative areas) Aug-Dec 8 (Phase 3: Entire prototype area) Est. date of delivery: January 9
33 Status of Product development: Impact of results on the User community Land Cover Map of high accuracy is being use for different applications by local and Regional governments in central Kalimantan. Governor of PNG is supporting the initiative in order to incorporate products on his management plans. Action is being taken. SarVision will give priority to this areas where users are active and enthusiastic on the Use of Alos-PalSAR products. Systematic processing and coverage of regions will support decision making at National Level both Indonesia and Guyana In countries like Colombia, Venezuela and Guyana Local communities and Government Institutions are expecting results from Guyana Shield to incorporate immediately into their planning and management
34 Status of Product development: Schedule Data delivery is delayed: Satellite cycles during which data are requested Year Month Cycle# 8 9 Req. = Mosaics Phase Implementation methodology Field data collection Early prototypes Refinement methodology Phase Prototype mapping large representative areas Evaluation Preparation production change detection Preparation prototype area mapping Phase 3 Mapping entire prototype area Evaluation Data delivery Delay in data delivery may have an effect on final data delivery Satellite cycles during which data are requested Year Month Cycle# Req. = Mosaics Phase Implementation methodology Field data collection Early prototypes Refinement methodology Phase Prototype mapping large representative areas Evaluation Phase 3 Mapping entire prototype area Evaluation Data delivery
 ACT- Tumucumaque (Brazil/Surinam/Colombia) ) Guiana Shield Initiative (IES)")

,) Local indigenous communities and farmers will profit from products for local resource management")
35 USE of Alos PalSAR for the Guiana Shield Initiative Search of cooperation with Laura Hess,,,3) ),) Field work support part of G / Guiana Shield ) ACT- Tumucumaque (Brazil/Surinam/Colombia) ) Guiana Shield Initiative (IES) Test sites Matavén (Colombia), Iwokrama (Guyana), Suriname 3) Colombian Amazon and Llanos: Instituto Alexander von Humboldt, Sinchi, Parques Naturales Data will be use by local governments to support National Environmental policies: In Colombia for instance a regional monitoring system needs to be implemented by SINCHI and the Natural Park System, ),) Local indigenous communities and farmers will profit from products for local resource management Forest Wetlands
36 Use of Alos PalSAR in tropical lowland rain forest Monitoring. Monitoring products needed for land cover and ecosystem monitoring according to users in the Amazon Basin (Guyana Shield Initiative). Medium resolution High resolution Scale Frequency Product Use :5. Every 6 months Cover Change detection maps. Flooding conditions, :5. Every 6 months Cover Change detection maps Flooding pulses and water balance, Land cover change; Detection of deforestation and regeneration Ecosystem fragmentation Infraestructure delelopment (roads) and Urban expantion Land cover change; Detection of deforestation and regeneration for local management Illegal activities in Natural Parks Ecosystem fragmentation Alos PalSAR fine bea Dual-Pol or Full-Pol d High resolution Objective Alos PalSAR Wide swath scan mode Insert in the environmental indicator system at regional and National level Use in land use modelling Empower of local communities and indigenous people to manage their reserves. For Natural Park System management and monitoring of illegal activities
37 Some possible future applications of Alos PalSAR to fulfill mapping information needs in countries with lowland tropical forest. Actual and Future research topics Subject Scale Objective Frequency Soil degradation :5. Study changes in soil quality, production capacity, erosion, acidification, infiltration, and porosity. Changes in soil density. Annually Biomass :5. Changes in biomass levels and mapping. National reporting. International responsibilities for Kyoto protocol. Annually Fires.5. Causes and dynamics. Input for prediction modelling. Annually Illegal crops.5. Detection of illegal cropping in national parks. Twice a year Flooding pulses.5. Climate change indicator and importance for local fishery and other economical activities Twice a year Water bodies and Varzeas :5. Monitoring and behaviour of wetlands. International agreements (Ramsar convention) and indicator of climate change. Locally important for fishery activities. Twice a year Alos PalSAR hig-res Dual-pol, Full-Pol and Wide swath scan mode
38 Important applications: USE of Alos PALSAR Dual POL or Full-Pol for ecosystem Mapping Products needed for Ecosystem management and conservation, Scale Frequency Use Objective Geo-morphological map :. One time Risk analysis Input for modelling and ecosystem mapping Ecosystem Map :. :5. Updated every 5 years Fragmentation & connectivity of ecosystems. Conservation and Natural Park design. Insert into biodiversity indicator system and early alert system for biodiversity loss. Ecosystem definition is based on, climate conditions, landscape characterization (soil and geomorphology), Vegetation types (structures), and flooding conditions. SRTM data for geo-morphology mapping Alos PalSAR can help to do ecosystem mapping
39 Mataven Indigenous Reserve, Colombia Delineation of flooded ecosystems High resolution mt Dual Pol HH Ideal to separate wet (flooded) from dry (non-flooded) ecosystems
40 Mataven Indigenous Reserve, Colombia Delineation of geomorfology Delineation of Vegetation types Savannas Ondulated ladscapes Flat floodplains Forest Pastures High resolution mt Dual Pol HV Integration with SRTM data will help definition of geomorphologic classes and therefore landscapes
 High resolution mt Dual Pol composite HV-HH-HV Polarization composites or temporal composites will enhance differences between")
41 Mataven Indigenous Reserve, Colombia Delineation of humid savanna ecosystems In ondulated landscape Non flooded Forest in undulated landscape Delineation of flooded forest In floodplain Non flooded forest In floodplain Deforested area (pastures) High resolution mt Dual Pol composite HV-HH-HV Polarization composites or temporal composites will enhance differences between ecosystems

42 Mataven Indigenous Reserve, Colombia Flooded forest Natural Savannas Non-flooded forest High resolution mt Dual Pol HH Distintion between different ecosystems in flat terrain
43 Mataven Indigenous Reserve, Colombia Natural Savannas more definition Non-flooded forest High resolution mt Dual Pol HV
44 Summary Classification Algorithm has reach maturity and we are ready to process high quantity data Data processing is still on time, but we are waiting to have at least one year data in orfer to classify with high accuracy. Field data collection is being intensive and great deal undrestanding the ecosystems and cover change dynamics, wich is of crucial importance for high accuaracy mapping. All Products created by SarVision are developed in cooperation with local users and are being evaluated at this moment for management. Development of International standard products ( REDD monitoring) are of crucial importance. Quality of data should be carefully assess before introducing to users.