AVID. Assessing Vegetation Impacts from Deer. A citizen science project from the University of Minnesota Extension
|
|
|
- Hilary Patterson
- 5 years ago
- Views:
Transcription


1 AVID Assessing Vegetation Impacts from Deer A citizen science project from the University of Minnesota Extension 1

2 Created By: Kristi Sullivan Cornell University Peter Smallidge Cornell University Paul Curtis Cornell University 22
3 Forest inventory and monitoring programs Exclosures Pros Monitored across vast landscapes Remeasured periodically Detailed measurements under controlled conditions Cons Rarely measure growth of individual trees Inventory can become outdated Expensive to install and maintain Not effective for large ownerships 33
4 Forest inventory and monitoring programs Exclosures Pros Monitored across vast landscapes Detailed measurements under controlled conditions Ideal Remeasured periodically Cons Rarely measure growth of individual trees Expensive to install and maintain Inventory can become outdated Not effective for large ownerships 44


5 VOLUNTEERS NEEDED PERFECT FOR: Master Woodland Owners, Master Naturalists, and Others with a basic knowledge of trees and plant identification Minnesota Woodland Owner 55
6 WHY VOLUNTEER? Learn about current scientific monitoring techniques. Set up research plots on your land and take regular measurements. Contribute to scientific research at the University of Minnesota. Help collect data from around the state Have a great summer project! 66
7 VOLUNTEER COMMITMENT A three-year commitment from volunteers Approximately four-six hours a year 77
8 Instructions For Setting Up Plots AVID MINNESOTA 8

9 SETTING UP PLOTS OVERVIEW > 1 acre of woodland A location you can come back to Preferably in areas known to have deer Healthy hemlock forest, Porcupine Mountains in UP of Michigan (L. Frelich) 99
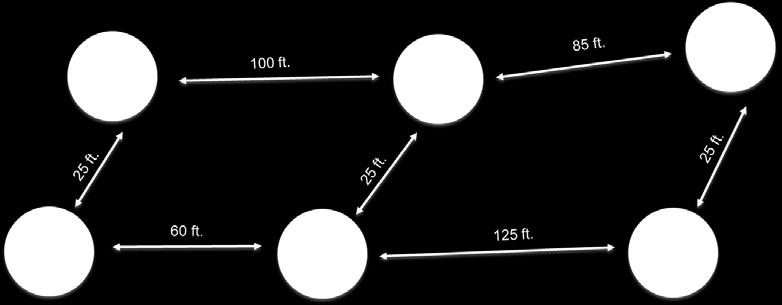
10 SET UP SIX PLOTS IN SAME STAND Plots most be at least 25 ft. apart 6 ft. 6 ft. 6 ft. 6 ft. 60 ft. 6 ft. 6 ft. 10
11 MATERIALS NEEDED Yard Stick Data Sheets 1-6 ft. String Compass 2-12 ft. String Hammer PVC pipe (1 ft. long and ¾ Way to collect GPS in wide) location Flags Permanent marker & Scot Tags Pen/Pencil Wire Clipboard (recommended) Chopsticks 11

12 1. SPEND 30 MINUTES WALKING AROUND YOUR STAND Think about what species you see in the stand Think about locations you can put your plots 12
13 2. DECIDE WHICH 1 OR 2 SPECIES YOU WILL TAG Choose from the preferred or palatable species list Preferred Species- Northern White Cedar Eastern White Pine Red Pine Eastern hemlock Canada yew Red Maple Sugar Maple Palatable Species- Black ash Paper birch Quaking aspen Northern Red Oak Bur Oak Northern Pin oak Swamp White Oak Eastern White Oak 13
14 3. FILL OUT THE SITE DATA SHEET 14
15 3. FILL OUT THE SITE DATA SHEET Required Information 15

16 3. FILL OUT THE SITE DATA SHEET Answer the best you can 16
17 3. FILL OUT THE SITE DATA SHEET 17
 Some species show constant basal area over a considerable period of time Correlated with")
18 BASAL AREA PER ACRE Units: square feet/acre Combines the number of trees and their size Ranges from 0 (no trees) to >250 sq. ft (lots of trees occupying growing space) Some species show constant basal area over a considerable period of time Correlated with volume of trees 18

19 APPROXIMATE BASAL AREA WITH YOUR THUMB! Each tree counted with your thumb represents about 15 square feet/acre So,10 trees = 150 square feet/acre 19

20 AVERAGE OVERSTORY TREE DIAMETER "Deep Portage exercise stand by Eli Sagor is licensed under CC BY 20
21 3. FILL OUT THE SITE DATA SHEET Overstory Seedling or Shrub "Deep Portage exercise stand by Eli Sagor is licensed under CC BY 21

22 3. FILL OUT THE SITE DATA SHEET Draw a map of plot locations 22

23 4. PICK PLOT LOCATION AND HAMMER IN PVC CENTER 23


24 5. FILL OUT PLOT INFORMATION ON PLOT SHEET 24


25 5. TAKE GPS LOCATION Using smartphone At home later 25


26 6. SET UP PLOT Tie 6 ft. string to center PVC pipe Use compass and walk to the end of the string in each of the cardinal directions and set up a flag 26

27 6. SET UP PLOT Tie two 12 ft strings to opposite flags to make four quadrats. 27

28 7. TAG AND MARK INDIVIDUAL PLANTS OF THE SPECIES YOU ARE RECORDING Tag Chopstick 28
29 7. TAG AND MARK INDIVIDUAL PLANTS OF THE SPECIES YOU ARE RECORDING Tag On one tag write Plot 1, 2,3,4,5, or 6 Seedling number 29


30 8. RECORD INDIVIDUAL PLANT INFO ON DATA SHEET Record for each individual marked and tagged in the plot 30

31 9. MEASURE HEIGHT OF EACH PLANT Measure Natural Height Measure from where the soil comes out of the ground TO The end of the stem when it is standing naturally* *When measuring do not touch or hold the stem 31

32 10. RECORD HEIGHT CLASS 32
33 Repeat 5 More Times for a Total of 6 Plots 6 ft. 6 ft. 6 ft. 6 ft. 60 ft. 6 ft. 6 ft. 33
34 REPEAT 5 MORE TIMES FOR A TOTAL OF 6 PLOTS 4. Pick Plot Location and Hammer in Center 5. Fill Out Plot Information on Site Data Sheet 6. Set Up Plot 7. Tag and Mark Individual Plants 8. Record Individual Plants Information on the Plot Data Sheet 9. Measure Individual Plants Heights 10. Record Height Class 34

35 SUBMIT THE DATA ONLINE 35
36 The University of Minnesota is an equal opportunity educator and employer. In accordance with the Americans with Disabilities Act, this PowerPoint is available in alternative formats upon request. Direct requests to

37 Username: Workshop Password: password123 The University of Minnesota is an equal opportunity educator and employer. In accordance with the Americans with Disabilities Act, this PowerPoint is available in alternative formats upon request. Direct requests to