Monitoring historical forest degradation (with focus on changes in carbon stocks on national level)
|
|
|
- Rebecca Kellie Lane
- 5 years ago
- Views:
Transcription


1 Global Observation of Forest and Land Cover Dynamics Monitoring historical forest degradation (with focus on changes in carbon stocks on national level) Martin Herold GOFC-GOLD Land Cover Office, FSU Jena, Germany Contributors: G. Asner, Y. Hirata, D. Mollicone, P. Van Laake, C. Souza, T. Pearson, H. Gibbs, J. Swensen, W. Hawthorne
2 Degradation: introduction 1. Forest degradation (changes in remaining forest areas) leads to a decline in carbon stock (UNFCCC 2008) 2. Emission levels less than for deforestation; cumulative and secondary effects result in significant carbon emission 3. Monitoring forest degradation important to avoid displacement of emissions from reduced deforestation 4. Factors for REDD national level MRV: IPCC good practice guidance (and its flexibility) National REDD+ policy strategy (and its priorities) Existing capacities (and its current gaps) Need for understanding key historical changes and carbon impacts for reference level

3 Degradation: introduction

4 Variability in capacities for REDD monitoring Capacity gap: Consideration of factors: 1.Requirements for monitoring forest carbon on national level (IPCC GPG) 2.Existing national capacities for national forest monitoring 3.Progress in national GHG inventory and engagement in REDD 4.REDD particular characteristics: importance of forest fires, soil carbon, deforestation rate etc. 5.Specific technical challenges (remote sensing): cloud cover, seasonality, topography, remote sensing data availability and access procedures Country capacity assessment report:
5 Forest degradation and carbon stocks Human induced disturbance causing loss of forest: fire, clearing, selective extraction, Carbon stock Primary forest Further disturbances: Prevented regrowth Fire/storm/pests Continuous logging Plantation forestry Natural regrowth Agroforestry Shifting cultivation Deforestation Time
6 Monitoring remarks 1. Dealing with uncertain or missing data for historical periods: Current data/knowledge often uncertain for both area affected and carbon stock change/emission factors Use of suitable proxy data and integration with (limited) available recent and new targeted measurements 2. More severe degradation (area/intensity) result in more distinct indicators for efficient national monitoring 3. Monitoring degradation benefits from understanding and emission significance of human processes (issue of key categories)
7 Common data for changes in remaining forests (degradation) 1. Field observations and surveys: Inventory based approaches (national, sub-national) Data from targeted field surveys (incl. interviews), research and permanent sample plots Commercial forestry data (i.e. logging concessions and harvest estimates) Proxy data for domestic markets (charcoal, subsistence) Assessments of carbon impact maybe assessed today 2. Remote sensing to detect degraded area and impacts: Direct detection of degradation processes (forest canopy damage) Indirect approaches (observe human infrastructure) Fire monitoring
8 Forest degradation and carbon stocks t-2 t-1 t0 t1 Carbon stock Primary forest 1990 Time
9 Forest degradation and area changes t-2 t-1 Intact/closed forest t0 t1 Primary forest Carbon stock Degraded forest Non-forest 1990 Time
10 Forest degradation & emission factors Increasing detail in degradation classes t-2 t-1 Intact/closed forest t0 t1 Primary forest Low level degradation forest Carbon stock Degraded forest Non-forest 1990 Time
11 Forest degradation & emission factors Average emission factors for (key) degradation processes t-2 t-1 Intact/closed forest t0 t1 Carbon stock Primary forest Non-forest 1990 Time
12 Forest degradation & emission factors Detailed emission factors for (key) degradation processes t-2 t-1 Intact/closed forest t0 t1 Carbon stock Primary forest Non-forest 1990 Time
13 Global Observation of Forest and Land Cover Dynamics Some practical examples and experiences
14 FAO original tables (example Fiji, based on NFI data) source: FAO (2005), FRA2005 country report 066, p. 8, table Estimation and forecasting source: FAO (2005), FRA2005 country report 066, p. 8, table 1.5 Data for National reporting tablet1
15 Create a national look-up table A cost-effective method may be to create a national look-up table and periodically updated and used through time to detail the pre-deforestation or degradation stocks Tier 2 approach Ideally stratified by type of human activities Stratum Aboveground Tree Belowgroun d Tree Dead Wood Non- Tree Lowland Forest Montane Forest Open Woodland Degraded Lowland Forest Degraded Montane Forest Total Degraded Woodland Shifting Cultivation Permanent Agriculture Units in t C/ha
16 Combining field data, extraction rates, and estimates of area logged: Republic of Congo (results based on 100 logging plots) Total carbon impact Impact per ha of concession Extracted biomass carbon Damaged biomass carbon in logging gap Damaged biomass carbon in skid trails Biomass carbon impact of logging roads t C 95% CI t C/ha 95% CI 3,824 ± ± ,698 ± ± ± ± ,194 ± ± 0.41 Suitable stratification needed for national level monitoring TOTAL 13,042 ± 1, ± 0.81 Source: Sandra Brown
17 Direct approaches to detect forest degradation Highly Detectable Deforestation Forest fragmentation Recent slash-andburn agriculture Major canopy fires Major roads Conversion to tree monocultures Hydroelectric dams and other forms of flood disturbances Large-scale mining Detection limited & increasing data/effort Selective logging Forest surface fires A range of edgeeffects Old-slash-and-burn agriculture Small scale mining Unpaved secondary roads (6-20-m wide) Selective thinning of canopy trees Detection very limited Harvesting of most non-timber plants products Old-mechanized selective logging Narrow sub-canopy roads (<6-m wide) Understory thinning and clear cutting Invasion of exotic species (using Landsat-type observations) Peres et al., (2006) TREE

18 Mapping Burned Forests with Landsat Image (Souza Jr. et al., 2005) NDFI 226/ (Sinop - MT)

19 Mapping Burned Forests with Landsat Image (Souza Jr. et al., 2005) NDFI 226/ (Sinop - MT)

20 Mapping Burned Forests with Landsat Image (Souza Jr. et al., 2005) NDFI 226/ (Sinop - MT)


21 Only few large area examples Monitoring forest degradation has never been the target of one operational forest area monitoring system, but recently this issue has been investigated in several research activities and some of them have obtained significant results:


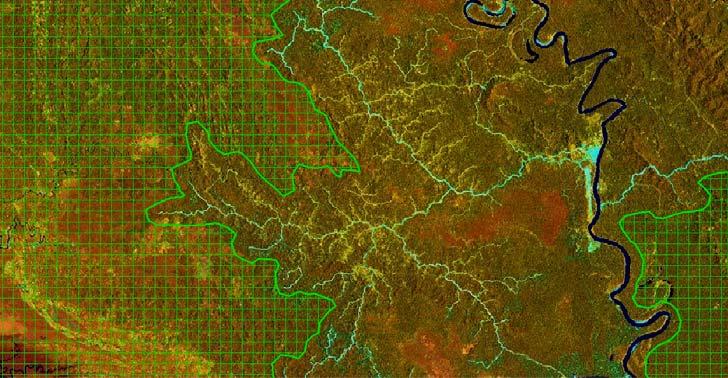
22 Example for indirect approach Landsat 1990 Landsat 2000
23 Examples of remote sensing use Forest sub-type Method Operational examples at national level Humid Tropics Logged forests IMAZON (Souza) Carneggie Un. (Asner) Brazilian Amazon Forest regrowths / secondary Louvain Un. / JRC Congo basin forests Tree/Crops mosaics Louvain Un. / JRC Congo basin (Forest) Plantations Some local examples Non-Intact Forests Greenpeace / WRI Tropical belt Burned Forests GOFC team, Munich Uni Indonesia/Africa Dry Tropics (Forest) Plantations Africa/Australia Non-Intact Forests Greenpeace / WRI Tropical belt
24 Conclusions 1. Degradation monitoring: Less efficient than for deforestation: lower C-emissions per ha versus higher costs & lower accuracies Significance of different degradation processes 2. Historical monitoring of degradation: Area effected (remote sensing and other sources) Carbon stock change (in-situ surveys, harvest estimates, national stratification by carbon density, degradation process & its temporal dynamics) Long term monitoring to assess net emissions 3. Some implications for REDD MRV: Capacity development needs larger than for deforestation Which type of degradation are key categories and relevant for national REDD+ policy