What are the risks? Crop Market Outlook
|
|
|
- Ira Bell
- 5 years ago
- Views:
Transcription
1 What are the risks? Crop Market Outlook Frayne Olson, PhD Crop Economist/Marketing Specialist NDSU Extension Service ND Agricultural Experiment Station Dept. of Agribusiness & Applied Economics
2 Today's Topics Review January 11, 2013 WASDE Where are we now (Where have we been). Are prices high enough to ration use? What does this mean for 2013 acreage and production? What are your questions!!

3 Corn Update
4 Corn Supply & Demand Table U.S. Corn 2011/2012 (Est) 2012/2013 (Dec) 2012/2013 (Jan) Planted A Mill. A Mill. A Mill. A. Harvested A Mill. A Mill. A Mill. A. Yield/Harvest A bu bu bu. Begin Stocks 1,128 Mill. Bu. 988 Mill. Bu. 988 Mill. Bu. Production 12,360 Mill. Bu. 10,725 Mill. Bu. 10,780 Mill. Bu. Imports 29 Mill. Bu. 100 Mill. Bu. 100 Mill. Bu. Total Supply 13,516 Mill. Bu. 11,814 Mill. Bu. 11,869 Mill. Bu. Feed & Residual 4,548 Mill. Bu. 4,150 Mill. Bu. 4,450 Mill. Bu. Food, Seed, Ind. 6,437 Mill. Bu. 5,867 Mill. Bu. 5,867 Mill. Bu. Ethanol 5,011 Mill. Bu. 4,500 Mill. Bu. 4,500 Mill. Bu. Exports 1,543 Mill. Bu. 1,150 Mill. Bu. 950 Mill. Bu. Total Use 12,527 Mill. Bu. 11,167 Mill. Bu. 11,267 Mill. Bu. Ending Stocks 989 Mill. Bu. 647 Mill. Bu. 602 Mill. Bu. USDA WASDE Jan. 11, 2013
5 Corn Supply & Demand Table U.S. Corn 2011/2012 (Est) 2012/2013 (Dec) 2012/2013 (Jan) Core Issue!! Planted A Mill. A Mill. A Mill. A. Harvested A Mill. A Mill. A Mill. A. U.S. will not produce enough corn to meet needs. Yield/Harvest A bu bu bu. Begin Stocks 1,128 Mill. Bu. 988 Mill. Bu. 988 Mill. Bu. Production 12,360 Mill. Bu. 10,725 Mill. Bu. 10,780 Mill. Bu. Who will use less! Imports 29 Mill. Bu. 100 Mill. Bu. 100 Mill. Bu. Total Supply 13,516 Mill. Bu. 11,814 Mill. Bu. 11,869 Mill. Bu. Feed & Residual 4,548 Mill. Bu. 4,150 Mill. Bu. 4,450 Mill. Bu. Food, Seed, Ind. 6,437 Mill. Bu. 5,867 Mill. Bu. 5,867 Mill. Bu. Ethanol 5,011 Mill. Bu. 4,500 Mill. Bu. 4,500 Mill. Bu. Exports 1,543 Mill. Bu. 1,150 Mill. Bu. 950 Mill. Bu. Total Use 12,527 Mill. Bu. 11,167 Mill. Bu. 11,267 Mill. Bu. Ending Stocks 989 Mill. Bu. 647 Mill. Bu. 602 Mill. Bu. USDA WASDE Jan. 11, 2013
6 Who will use less corn?
7 Billion Bushels Corn - Total Use (Billion Bushels) Feed & Residual Ethanol Non-Ethanol Food, Seed & Industrial Exports 0.00 Jan. 11, 2013 WASDE Report & USDA Feed Grains Data Base Table 4
8 Corn Supply & Demand Table U.S. Corn 2011/2012 (Est) 2012/2013 (Dec) 2012/2013 (Jan) Planted A Mill. A Mill. A Mill. A. Harvested A Mill. A Mill. A Mill. A. Will the ethanol industry use 10% less corn? Yield/Harvest A bu bu bu. Begin Stocks 1,128 Mill. Bu. 988 Mill. Bu. 988 Mill. Bu. Production 12,360 Mill. Bu. 10,725 Mill. Bu. 10,780 Mill. Bu. Imports 29 Mill. Bu. 100 Mill. Bu. 100 Mill. Bu. Total Supply 13,516 Mill. Bu. 11,814 Mill. Bu. 11,869 Mill. Bu. Feed & Residual 4,548 Mill. Bu. 4,150 Mill. Bu. 4,450 Mill. Bu. Food, Seed, Ind. 6,437 Mill. Bu. 5,867 Mill. Bu. 5,867 Mill. Bu. Ethanol 5,011 Mill. Bu. 4,500 Mill. Bu. 4,500 Mill. Bu. Exports 1,543 Mill. Bu. 1,150 Mill. Bu. 950 Mill. Bu. Total Use 12,527 Mill. Bu. 11,167 Mill. Bu. 11,267 Mill. Bu. Ending Stocks 989 Mill. Bu. 647 Mill. Bu. 602 Mill. Bu. USDA WASDE Jan. 11, 2013
9 Jun 04, 2010 Jul 04, 2010 Aug 04, 2010 Sep 04, 2010 Oct 04, 2010 Nov 04, 2010 Dec 04, 2010 Jan 04, 2011 Feb 04, 2011 Mar 04, 2011 Apr 04, 2011 May 04, 2011 Jun 04, 2011 Jul 04, 2011 Aug 04, 2011 Sep 04, 2011 Oct 04, 2011 Nov 04, 2011 Dec 04, 2011 Jan 04, 2012 Feb 04, 2012 Mar 04, 2012 Apr 04, 2012 May 04, 2012 Jun 04, 2012 Jul 04, 2012 Aug 04, 2012 Sep 04, 2012 Oct 04, 2012 Nov 04, 2012 Dec 04, 2012 Jan 04, 2013 Feb 04, ,000 Barrels/Day 1,000 Weekly Ethanol Production (06/04/ /11/2012) Weekly Production USDA Est. Corn Use EIA September Short Term Energy Outlook & EIA Custom Query
10 Corn Supply & Demand Table U.S. Corn 2011/2012 (Est) 2012/2013 (Dec) 2012/2013 (Jan) Planted A Mill. A Mill. A Mill. A. Will corn exports drop by 38%? Harvested A Mill. A Mill. A Mill. A. Yield/Harvest A bu bu bu. Lowest since 1971/72 Begin Stocks 1,128 Mill. Bu. 988 Mill. Bu. 988 Mill. Bu. Production 12,360 Mill. Bu. 10,725 Mill. Bu. 10,780 Mill. Bu. Imports 29 Mill. Bu. 100 Mill. Bu. 100 Mill. Bu. Total Supply 13,516 Mill. Bu. 11,814 Mill. Bu. 11,869 Mill. Bu. Feed & Residual 4,548 Mill. Bu. 4,150 Mill. Bu. 4,450 Mill. Bu. Food, Seed, Ind. 6,437 Mill. Bu. 5,867 Mill. Bu. 5,867 Mill. Bu. Ethanol 5,011 Mill. Bu. 4,500 Mill. Bu. 4,500 Mill. Bu. Exports 1,543 Mill. Bu. 1,150 Mill. Bu. 950 Mill. Bu. Total Use 12,527 Mill. Bu. 11,167 Mill. Bu. 11,267 Mill. Bu. Ending Stocks 989 Mill. Bu. 647 Mill. Bu. 602 Mill. Bu. USDA WASDE Jan. 11, 2013
11 Metric Tons/Week Weekly Corn Export Sales (06/10/ /10/2013) 1,450,000 1,250,000 1,050, , , , ,000 50,000 USDA Exports Actual Exports USDA-FSA Weekly Export Sales Report & Jan. 11, 2013 WASDE
12 Corn Supply & Demand Table U.S. Corn 2011/2012 (Est) 2012/2013 (Dec) 2012/2013 (Jan) Planted A Mill. A Mill. A Mill. A. Harvested A Mill. A Mill. A Mill. A. Yield/Harvest A bu bu bu. Exports were decreased 200 Mill. Bu. Begin Stocks 1,128 Mill. Bu. 988 Mill. Bu. 988 Mill. Bu. Production 12,360 Mill. Bu. 10,725 Mill. Bu. 10,780 Mill. Bu. Imports 29 Mill. Bu. 100 Mill. Bu. 100 Mill. Bu. Total Supply 13,516 Mill. Bu. 11,814 Mill. Bu. 11,869 Mill. Bu. Feed & Residual 4,548 Mill. Bu. 4,150 Mill. Bu. 4,450 Mill. Bu. Food, Seed, Ind. 6,437 Mill. Bu. 5,867 Mill. Bu. 5,867 Mill. Bu. Ethanol 5,011 Mill. Bu. 4,500 Mill. Bu. 4,500 Mill. Bu. Exports 1,543 Mill. Bu. 1,150 Mill. Bu. 950 Mill. Bu. Total Use 12,527 Mill. Bu. 11,167 Mill. Bu. 11,267 Mill. Bu. Ending Stocks 989 Mill. Bu. 647 Mill. Bu. 602 Mill. Bu. USDA WASDE Jan. 11, 2013
13 Million Metric Tons Stocks-to-Use Ratio World Corn Prod, Use & Stocks/Use (Million Metric Ton) Stocks-to-Use Total Production Total Use Jan. 11, 2013 USDA -WASDE & PSD Custom Query
14 Corn Supply & Demand Table Will feed use drop by 2.0%? U.S. Corn 2011/2012 (Est) 2012/2013 (Dec) 2012/2013 (Jan) Planted A Mill. A Mill. A Mill. A. This value is the most difficult to track! Harvested A Mill. A Mill. A Mill. A. Yield/Harvest A bu bu bu. Quarterly Grain Stocks is used to adjust estimates. Begin Stocks 1,128 Mill. Bu. 988 Mill. Bu. 988 Mill. Bu. Production 12,360 Mill. Bu. 10,725 Mill. Bu. 10,780 Mill. Bu. Imports 29 Mill. Bu. 100 Mill. Bu. 100 Mill. Bu. Total Supply 13,516 Mill. Bu. 11,814 Mill. Bu. 11,869 Mill. Bu. Feed & Residual 4,548 Mill. Bu. 4,150 Mill. Bu. 4,450 Mill. Bu. Food, Seed, Ind. 6,437 Mill. Bu. 5,867 Mill. Bu. 5,867 Mill. Bu. Ethanol 5,011 Mill. Bu. 4,500 Mill. Bu. 4,500 Mill. Bu. Exports 1,543 Mill. Bu. 1,150 Mill. Bu. 950 Mill. Bu. Total Use 12,527 Mill. Bu. 11,167 Mill. Bu. 11,267 Mill. Bu. Ending Stocks 989 Mill. Bu. 647 Mill. Bu. 602 Mill. Bu. USDA WASDE Jan. 11, 2013
15 Corn Supply & Demand Table U.S. Corn 2011/2012 (Est) 2012/2013 (Dec) 2012/2013 (Jan) Planted A Mill. A Mill. A Mill. A. Feed & Residual was increased 300 Mill. Bu. Harvested A Mill. A Mill. A Mill. A. Yield/Harvest A bu bu bu. Begin Stocks 1,128 Mill. Bu. 988 Mill. Bu. 988 Mill. Bu. Production 12,360 Mill. Bu. 10,725 Mill. Bu. 10,780 Mill. Bu. Imports 29 Mill. Bu. 100 Mill. Bu. 100 Mill. Bu. Total Supply 13,516 Mill. Bu. 11,814 Mill. Bu. 11,869 Mill. Bu. Feed & Residual 4,548 Mill. Bu. 4,150 Mill. Bu. 4,450 Mill. Bu. Food, Seed, Ind. 6,437 Mill. Bu. 5,867 Mill. Bu. 5,867 Mill. Bu. Ethanol 5,011 Mill. Bu. 4,500 Mill. Bu. 4,500 Mill. Bu. Exports 1,543 Mill. Bu. 1,150 Mill. Bu. 950 Mill. Bu. Total Use 12,527 Mill. Bu. 11,167 Mill. Bu. 11,267 Mill. Bu. Ending Stocks 989 Mill. Bu. 647 Mill. Bu. 602 Mill. Bu. USDA WASDE Jan. 11, 2013
16 Corn Supply & Demand Table U.S. Corn 2011/2012 (Est) 2012/2013 (Dec) 2012/2013 (Jan) Planted A Mill. A Mill. A Mill. A. Harvested A Mill. A Mill. A Mill. A. Yield/Harvest A bu bu bu. Begin Stocks 1,128 Mill. Bu. 988 Mill. Bu. 988 Mill. Bu. Production 12,360 Mill. Bu. 10,725 Mill. Bu. 10,780 Mill. Bu. Imports 29 Mill. Bu. 100 Mill. Bu. 100 Mill. Bu. 45 Mill. Bu. reduction in Ending Stocks Total Supply 13,516 Mill. Bu. 11,814 Mill. Bu. 11,869 Mill. Bu. Feed & Residual 4,548 Mill. Bu. 4,150 Mill. Bu. 4,450 Mill. Bu. Food, Seed, Ind. 6,437 Mill. Bu. 5,867 Mill. Bu. 5,867 Mill. Bu. Ethanol 5,011 Mill. Bu. 4,500 Mill. Bu. 4,500 Mill. Bu. Exports 1,543 Mill. Bu. 1,150 Mill. Bu. 950 Mill. Bu. Total Use 12,527 Mill. Bu. 11,167 Mill. Bu. 11,267 Mill. Bu. Ending Stocks 989 Mill. Bu. 647 Mill. Bu. 602 Mill. Bu. USDA WASDE Jan. 11, 2013
17 Corn Supply & Demand Table U.S. Corn 2011/2012 (Est) 2012/2013 (Dec) 2012/2013 (Jan) Planted A Mill. A Mill. A Mill. A. Projected 5.3% Stocks/Use Ratio Harvested A Mill. A Mill. A Mill. A. Yield/Harvest A bu bu bu. Begin Stocks 1,128 Mill. Bu. 988 Mill. Bu. 988 Mill. Bu. Lowest since 1995/96, which was record low percentage. Production 12,360 Mill. Bu. 10,725 Mill. Bu. 10,780 Mill. Bu. Imports 29 Mill. Bu. 100 Mill. Bu. 100 Mill. Bu. Total Supply 13,516 Mill. Bu. 11,814 Mill. Bu. 11,869 Mill. Bu. Feed & Residual 4,548 Mill. Bu. 4,150 Mill. Bu. 4,450 Mill. Bu. Food, Seed, Ind. 6,437 Mill. Bu. 5,867 Mill. Bu. 5,867 Mill. Bu. Ethanol 5,011 Mill. Bu. 4,500 Mill. Bu. 4,500 Mill. Bu. Exports 1,543 Mill. Bu. 1,150 Mill. Bu. 950 Mill. Bu. Total Use 12,527 Mill. Bu. 11,167 Mill. Bu. 11,267 Mill. Bu. Ending Stocks 989 Mill. Bu. 647 Mill. Bu. 602 Mill. Bu. USDA WASDE Jan. 11, 2013
18 Billion Bushels Stocks-to-Use Ratio Corn Total Production & Use (Billion Bushels) Stocks-to-Use Total Production Total Use Jan. 11, 2013 WASDE Report & USDA Feed Grains Data Base Table 4
19 Summary of Key Corn Issues Ethanol use and Export pace will be watched weekly. Feed use is the big unknown, will need to monitor Quarterly Grain Stocks Reports. Cattle on Feed, Hogs and Pigs,. Helps estimate number of mouths, but not what they are eating. Watch the basis!! Light test weight corn is impacting total use. Light test weight corn will not be shipped far (export) Aflatoxin is a problem in some areas, a special waiver now allows blending in Iowa, Illinois, Nebraska, and Kansas Movement of Delayed Pricing (DP) grain

20 Soybean Update
21 Soybean Supply & Demand Table U.S. Soybean 2011/2012 (Est) 2012/2013 (Dec) 2012/2013 (Jan) Planted A Mill. A Mill. A Mill. A. Harvested A Mill. A Mill. A Mill. A. Yield/Harvest A bu bu bu. Begin Stocks 215 Mill. Bu. 169 Mill. Bu. 169 Mill. Bu. Production 3,094 Mill. Bu. 2,971 Mill. Bu. 3,015 Mill. Bu. Imports 16 Mill. Bu. 20 Mill. Bu. 20 Mill. Bu. Total Supply 3,325 Mill. Bu. 3,160 Mill. Bu. 3,204 Mill. Bu. Crushings 1,703 Mill. Bu. 1,570 Mill. Bu. 1,605 Mill. Bu. Exports 1,362 Mill. Bu. 1,345 Mill. Bu. 1,345 Mill. Bu. Seed 90 Mill. Bu. 89 Mill. Bu. 89 Mill. Bu. Residual 1 Mill. Bu. 26 Mill. Bu. 30 Mill. Bu. Total Use 3,155 Mill. Bu. 3,031 Mill. Bu. 3,070 Mill. Bu. Ending Stocks 169 Mill. Bu. 130 Mill. Bu. 135 Mill. Bu. USDA WASDE Jan. 11, 2013
22 Soybean Supply & Demand Table U.S. Soybean 2011/2012 (Est) 2012/2013 (Dec) 2012/2013 (Jan) Planted A Mill. A Mill. A Mill. A. Harvested A Mill. A Mill. A Mill. A. Yield/Harvest A bu bu bu. Begin Stocks 215 Mill. Bu. 169 Mill. Bu. 169 Mill. Bu. Production 3,094 Mill. Bu. 2,971 Mill. Bu. 3,015 Mill. Bu. Imports 16 Mill. Bu. 20 Mill. Bu. 20 Mill. Bu. Total Supply 3,325 Mill. Bu. 3,160 Mill. Bu. 3,204 Mill. Bu. Crushings 1,703 Mill. Bu. 1,570 Mill. Bu. 1,605 Mill. Bu. 2.5% reduction from 2011/12 Exports 1,362 Mill. Bu. 1,345 Mill. Bu. 1,345 Mill. Bu. Seed 90 Mill. Bu. 89 Mill. Bu. 89 Mill. Bu % reduction for corn Residual 1 Mill. Bu. 26 Mill. Bu. 30 Mill. Bu. Total Use 3,155 Mill. Bu. 3,031 Mill. Bu. 3,070 Mill. Bu. Ending Stocks 169 Mill. Bu. 130 Mill. Bu. 135 Mill. Bu. USDA WASDE Jan. 11, 2013
23 Billion Bushels Stocks-to-Use Ratio Soybean Total Prod. & Use (Billion Bushels) Stocks-to-Use Total Production Total Use Jan. 11, 2013 WASDE Report & Oil Yearbook Table 3
24 Million Bushels U.S. Soybean Use 2,000 1,800 1,600 1,400 1,200 1, Crushings Exports Seed & Residual Jan. 11, 2013 WASDE Report & Oil Yearbook Table 3
25 Soybean Supply & Demand Table Projected 5.7% reduction in Crushings U.S. Soybean 2011/2012 (Est) 2012/2013 (Dec) 2012/2013 (Jan) Planted A Mill. A Mill. A Mill. A. Veg. oil demand should remain strong, but exports and meal (feed) may suffer. Harvested A Mill. A Mill. A Mill. A. Yield/Harvest A bu bu bu. Begin Stocks 215 Mill. Bu. 169 Mill. Bu. 169 Mill. Bu. Production 3,094 Mill. Bu. 2,971 Mill. Bu. 3,015 Mill. Bu. Imports 16 Mill. Bu. 20 Mill. Bu. 20 Mill. Bu. Total Supply 3,325 Mill. Bu. 3,160 Mill. Bu. 3,204 Mill. Bu. Crushings 1,703 Mill. Bu. 1,570 Mill. Bu. 1,605 Mill. Bu. Exports 1,362 Mill. Bu. 1,345 Mill. Bu. 1,345 Mill. Bu. Seed 90 Mill. Bu. 89 Mill. Bu. 89 Mill. Bu. Residual 1 Mill. Bu. 26 Mill. Bu. 30 Mill. Bu. Total Use 3,155 Mill. Bu. 3,031 Mill. Bu. 3,070 Mill. Bu. Ending Stocks 169 Mill. Bu. 130 Mill. Bu. 135 Mill. Bu. USDA WASDE Jan. 11, 2013
26 Soybean Supply & Demand Table U.S. Soybean 2011/2012 (Est) 2012/2013 (Dec) 2012/2013 (Jan) Planted A Mill. A Mill. A Mill. A. Projected 1% reduction in Exports. Harvested A Mill. A Mill. A Mill. A. Yield/Harvest A bu bu bu. Begin Stocks 215 Mill. Bu. 169 Mill. Bu. 169 Mill. Bu. Production 3,094 Mill. Bu. 2,971 Mill. Bu. 3,015 Mill. Bu. Imports 16 Mill. Bu. 20 Mill. Bu. 20 Mill. Bu. Total Supply 3,325 Mill. Bu. 3,160 Mill. Bu. 3,204 Mill. Bu. Crushings 1,703 Mill. Bu. 1,570 Mill. Bu. 1,605 Mill. Bu. Exports 1,362 Mill. Bu. 1,345 Mill. Bu. 1,345 Mill. Bu. Seed 90 Mill. Bu. 89 Mill. Bu. 89 Mill. Bu. Residual 1 Mill. Bu. 26 Mill. Bu. 30 Mill. Bu. Total Use 3,155 Mill. Bu. 3,031 Mill. Bu. 3,070 Mill. Bu. Ending Stocks 169 Mill. Bu. 130 Mill. Bu. 135 Mill. Bu. USDA WASDE Jan. 11, 2013
27 Metric Tons/Week Weekly Soybean Export Sales (06/10/ /10/2013) 2,000,000 1,800,000 1,600,000 1,400,000 1,200,000 1,000, , , , ,000 0 USDA Exports Actual Exports USDA-FSA Weekly Export Sales Report & Jan. 11, 2013 WASDE
28 Soybean Supply & Demand Table Key issues: U.S. Soybean 2011/2012 (Est) 2012/2013 (Dec) 2012/2013 (Jan) Planted A Mill. A Mill. A Mill. A. China s economic growth and demand. Harvested A Mill. A Mill. A Mill. A. Yield/Harvest A bu bu bu. South American weather! Begin Stocks 215 Mill. Bu. 169 Mill. Bu. 169 Mill. Bu. Production 3,094 Mill. Bu. 2,971 Mill. Bu. 3,015 Mill. Bu. Imports 16 Mill. Bu. 20 Mill. Bu. 20 Mill. Bu. Total Supply 3,325 Mill. Bu. 3,160 Mill. Bu. 3,204 Mill. Bu. Crushings 1,703 Mill. Bu. 1,570 Mill. Bu. 1,605 Mill. Bu. Exports 1,362 Mill. Bu. 1,345 Mill. Bu. 1,345 Mill. Bu. Seed 90 Mill. Bu. 89 Mill. Bu. 89 Mill. Bu. Residual 1 Mill. Bu. 26 Mill. Bu. 30 Mill. Bu. Total Use 3,155 Mill. Bu. 3,031 Mill. Bu. 3,070 Mill. Bu. Ending Stocks 169 Mill. Bu. 130 Mill. Bu. 135 Mill. Bu. USDA WASDE Jan. 11, 2013
29 Million Metric Ton Top Five S.B. Export Destinations China Mexico Japan Taiwan Indonesia 0.00 USDA FAS Export Sales Custom Query
30 Million Metric Tons Stocks-to-Use Ratio World Soybean Prod, Use & Stocks/Use (Million Metric Ton) Stocks-to-Use Total Production Total Use Jan. 11, 2013 USDA -WASDE & PSD Custom Query
31 Million Metric Ton Historical Soybean Production (Million Metric Ton) United States Brazil Argentina Jan. 11, 2013 WASDE Report & PSD Tables 21, 22 and 23
32 Million Metric Ton Historical Soybean Exports (Million Metric Ton) United States Brazil Argentina Jan. 11, 2013 WASDE Report & PSD Tables 21, 22 and 23
33 Summary of Key Soybean Issues Export pace, especially sales to China, will be watched closely. Recent export cancellations have raised questions about future export sales to China. South American crop condition (i.e. weather) will create significant volatility. Argentine planting pace was behind normal due to heavy rains, creating possible concerns during pollination and pod fill. Weather conditions are becoming dryer. Brazilian planting pace was also behind due to dry conditions in the north and wet conditions in the south. Current conditions are good, but some dry areas developing. Watch the basis!! (DP grain)

34 USDA FAS Crop Explorer

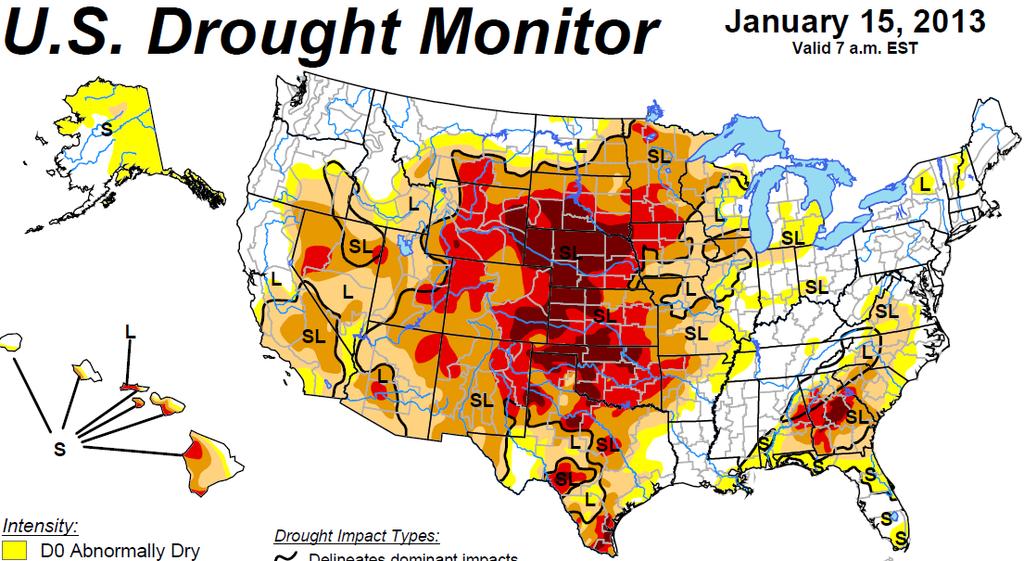
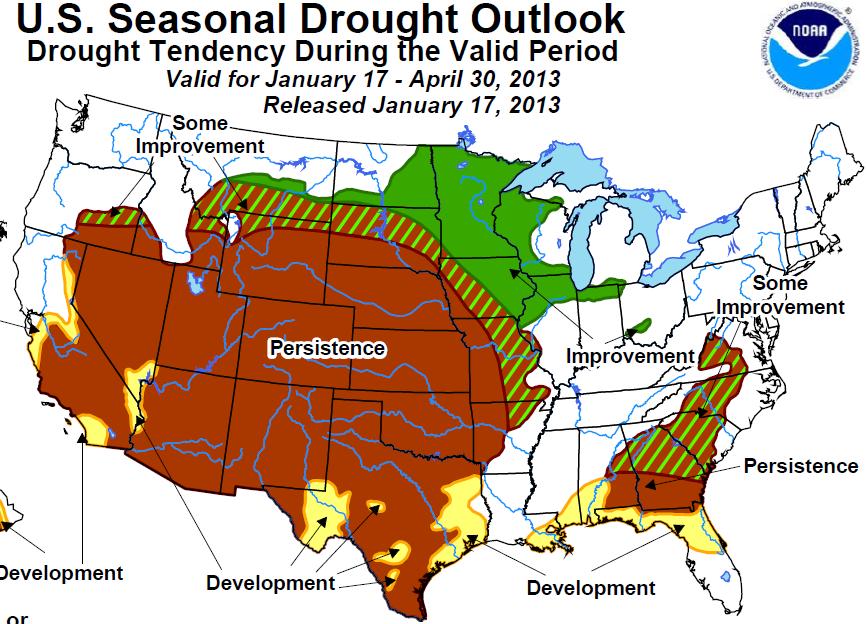
35 Surface Moisture 01/01/13 01/10/13 USDA FAS Crop Explorer

36 Sub -Surface Moisture 01/01/13 01/10/13 USDA FAS Crop Explorer

37 USDA FAS Crop Explorer

38 Surface Moisture 01/01/13 01/10/13 USDA FAS Crop Explorer

39 Sub -Surface Moisture 01/01/13 01/10/13 USDA FAS Crop Explorer

40 Wheat Update
41 All Wheat Supply & Demand Table U.S. All Wheat 2011/2012 (Est.) 2012/2013 (Dec) 2012/2013 (Jan) Planted A Mill. A Mill. A Mill. A. Harvested A Mill. A Mill. A Mill. A. Yield/Harvest A bu bu bu. Begin Stocks 862 Mill. Bu. 743 Mill. Bu. 743 Mill. Bu. Production 1,999 Mill. Bu. 2,269 Mill. Bu. 2,269 Mill. Bu. Imports 112 Mill. Bu. 130 Mill. Bu. 130 Mill. Bu. Total Supply 2,974 Mill. Bu. 3,142 Mill. Bu. 3,142 Mill. Bu. Food 941 Mill. Bu. 950 Mill. Bu. 950 Mill. Bu. Seed 76 Mill. Bu. 73 Mill. Bu. 75 Mill. Bu. Feed & Residual 164 Mill. Bu. 315 Mill. Bu. 350 Mill. Bu. Exports 1,050 Mill. Bu. 1,050 Mill. Bu. 1,050 Mill. Bu. Total Use 2,231 Mill. Bu. 2,388 Mill. Bu. 2,425 Mill. Bu. Ending Stocks 743 Mill. Bu. 754 Mill. Bu. 716 Mill. Bu. USDA WASDE Jan. 11, 2013
42 All Wheat Supply & Demand Table U.S. All Wheat 2011/2012 (Est.) 2012/2013 (Dec) 2012/2013 (Jan) Planted A Mill. A Mill. A Mill. A. Harvested A Mill. A Mill. A Mill. A. Yield/Harvest A bu bu bu. Begin Stocks 862 Mill. Bu. 743 Mill. Bu. 743 Mill. Bu. Production 1,999 Mill. Bu. 2,269 Mill. Bu. 2,269 Mill. Bu. Imports 112 Mill. Bu. 130 Mill. Bu. 130 Mill. Bu. Total Supply 2,974 Mill. Bu. 3,142 Mill. Bu. 3,142 Mill. Bu. Planted Acres, Average Yield and Total Production are UP from 2011/12. Food 941 Mill. Bu. 950 Mill. Bu. 950 Mill. Bu. Seed 76 Mill. Bu. 73 Mill. Bu. 75 Mill. Bu. Feed & Residual 164 Mill. Bu. 315 Mill. Bu. 350 Mill. Bu. Exports 1,050 Mill. Bu. 1,050 Mill. Bu. 1,050 Mill. Bu. 13.5% increase. Total Use 2,231 Mill. Bu. 2,388 Mill. Bu. 2,425 Mill. Bu. Ending Stocks 743 Mill. Bu. 754 Mill. Bu. 716 Mill. Bu. USDA WASDE Jan. 11, 2013
43 All Wheat Supply & Demand Table U.S. All Wheat 2011/2012 (Est.) 2012/2013 (Dec) 2012/2013 (Jan) Planted A Mill. A Mill. A Mill. A. Harvested A Mill. A Mill. A Mill. A. Yield/Harvest A bu bu bu. Begin Stocks 862 Mill. Bu. 743 Mill. Bu. 743 Mill. Bu. Production 1,999 Mill. Bu. 2,269 Mill. Bu. 2,269 Mill. Bu. Imports 112 Mill. Bu. 130 Mill. Bu. 130 Mill. Bu. Total Supply 2,974 Mill. Bu. 3,142 Mill. Bu. 3,142 Mill. Bu. Food 941 Mill. Bu. 950 Mill. Bu. 950 Mill. Bu. Seed 76 Mill. Bu. 73 Mill. Bu. 75 Mill. Bu. Feed & Residual 164 Mill. Bu. 315 Mill. Bu. 350 Mill. Bu. Exports 1,050 Mill. Bu. 1,050 Mill. Bu. 1,050 Mill. Bu. Total Use 2,231 Mill. Bu. 2,388 Mill. Bu. 2,425 Mill. Bu. Ending Stocks 743 Mill. Bu. 754 Mill. Bu. 716 Mill. Bu. USDA WASDE Jan. 11, 2013
44 Million Bushels U.S. All Wheat Disappearance (Million Bushels) 1,400 1,200 1, Food Exports Feed & Residual Seed USDA WASDE Jan. 11, 2013 & USDA Wheat Yearbook -Table 5
45 All Wheat Supply & Demand Table Food use is very important and relatively stable. U.S. All Wheat 2011/2012 (Est.) 2012/2013 (Dec) 2012/2013 (Jan) Planted A Mill. A Mill. A Mill. A. Harvested A Mill. A Mill. A Mill. A. Change in U.S. population +/- flour extraction rates. Yield/Harvest A bu bu bu. Begin Stocks 862 Mill. Bu. 743 Mill. Bu. 743 Mill. Bu. Production 1,999 Mill. Bu. 2,269 Mill. Bu. 2,269 Mill. Bu. Imports 112 Mill. Bu. 130 Mill. Bu. 130 Mill. Bu. Total Supply 2,974 Mill. Bu. 3,142 Mill. Bu. 3,142 Mill. Bu. Food 941 Mill. Bu. 950 Mill. Bu. 950 Mill. Bu. Seed 76 Mill. Bu. 73 Mill. Bu. 75 Mill. Bu. Feed & Residual 164 Mill. Bu. 315 Mill. Bu. 350 Mill. Bu. Exports 1,050 Mill. Bu. 1,050 Mill. Bu. 1,050 Mill. Bu. Total Use 2,231 Mill. Bu. 2,388 Mill. Bu. 2,425 Mill. Bu. Ending Stocks 743 Mill. Bu. 754 Mill. Bu. 716 Mill. Bu. USDA WASDE Jan. 11, 2013
46 All Wheat Supply & Demand Table U.S. All Wheat 2011/2012 (Est.) 2012/2013 (Dec) 2012/2013 (Jan) Planted A Mill. A Mill. A Mill. A. Feed & Residual is variable, but relatively small. Harvested A Mill. A Mill. A Mill. A. Yield/Harvest A bu bu bu. Feed use has grown due to tight corn supplies ( Bill. Bu.) Begin Stocks 862 Mill. Bu. 743 Mill. Bu. 743 Mill. Bu. Production 1,999 Mill. Bu. 2,269 Mill. Bu. 2,269 Mill. Bu. 393 Mill. Bu. in 2008/09 Imports 112 Mill. Bu. 130 Mill. Bu. 130 Mill. Bu. Total Supply 2,974 Mill. Bu. 3,142 Mill. Bu. 3,142 Mill. Bu. Food 941 Mill. Bu. 950 Mill. Bu. 950 Mill. Bu. Seed 76 Mill. Bu. 73 Mill. Bu. 75 Mill. Bu. Feed & Residual 164 Mill. Bu. 315 Mill. Bu. 350 Mill. Bu. Exports 1,050 Mill. Bu. 1,050 Mill. Bu. 1,050 Mill. Bu. Total Use 2,231 Mill. Bu. 2,388 Mill. Bu. 2,425 Mill. Bu. Ending Stocks 743 Mill. Bu. 754 Mill. Bu. 716 Mill. Bu. USDA WASDE Jan. 11, 2013
47 All Wheat Supply & Demand Table U.S. All Wheat 2011/2012 (Est.) 2012/2013 (Dec) 2012/2013 (Jan) Planted A Mill. A Mill. A Mill. A. Harvested A Mill. A Mill. A Mill. A. Exports are key price factor for wheat. Yield/Harvest A bu bu bu. Begin Stocks 862 Mill. Bu. 743 Mill. Bu. 743 Mill. Bu. Exchange rates (value of USD) are very important. Production 1,999 Mill. Bu. 2,269 Mill. Bu. 2,269 Mill. Bu. Imports 112 Mill. Bu. 130 Mill. Bu. 130 Mill. Bu. Total Supply 2,974 Mill. Bu. 3,142 Mill. Bu. 3,142 Mill. Bu. Food 941 Mill. Bu. 950 Mill. Bu. 950 Mill. Bu. Seed 76 Mill. Bu. 73 Mill. Bu. 75 Mill. Bu. Feed & Residual 164 Mill. Bu. 315 Mill. Bu. 350 Mill. Bu. Exports 1,050 Mill. Bu. 1,050 Mill. Bu. 1,050 Mill. Bu. Total Use 2,231 Mill. Bu. 2,388 Mill. Bu. 2,425 Mill. Bu. Ending Stocks 743 Mill. Bu. 754 Mill. Bu. 716 Mill. Bu. USDA WASDE Jan. 11, 2013
48 All Wheat Supply & Demand Table U.S. All Wheat 2011/2012 (Est.) 2012/2013 (Dec) 2012/2013 (Jan) Planted A Mill. A Mill. A Mill. A. Drought in Black Sea region will help HRWW and SRWW sales. Harvested A Mill. A Mill. A Mill. A. Yield/Harvest A bu bu bu. Begin Stocks 862 Mill. Bu. 743 Mill. Bu. 743 Mill. Bu. Production problems in Australia and Argentina will help HRSW Production 1,999 Mill. Bu. 2,269 Mill. Bu. 2,269 Mill. Bu. Imports 112 Mill. Bu. 130 Mill. Bu. 130 Mill. Bu. Total Supply 2,974 Mill. Bu. 3,142 Mill. Bu. 3,142 Mill. Bu. Food 941 Mill. Bu. 950 Mill. Bu. 950 Mill. Bu. Seed 76 Mill. Bu. 73 Mill. Bu. 75 Mill. Bu. Feed & Residual 164 Mill. Bu. 315 Mill. Bu. 350 Mill. Bu. Exports 1,050 Mill. Bu. 1,050 Mill. Bu. 1,050 Mill. Bu. Total Use 2,231 Mill. Bu. 2,388 Mill. Bu. 2,425 Mill. Bu. Ending Stocks 743 Mill. Bu. 754 Mill. Bu. 716 Mill. Bu. USDA WASDE Jan. 11, 2013
49 Metric Tons/Week Weekly Wheat Export Sales (06/10/ /10/2013) 1,050, , , , ,000 50,000 USDA Exports Actural Exports USDA-FSA Weekly Export Sales Report & Jan. 11, 2013 WASDE
50 Million Metric Tons Stocks-to-Use Ratio World Wheat Prod, Use & Stocks/Use (Million Metric Ton) Stocks-to-Use Total Production Total Use USDA WASDE- Jan. 11, 2013 & PSD Custom Query
51 Wheat: Summary of Key Issues Exports from Black Sea region are ending soon Watch Australian production and quality carefully. Argentina wheat quality may be questionable. Winter Wheat Acreage increased only 1%! HRWW decreased 2%, from to 29.1 Mill. A. SRWW increased 16% from 8.12 to 9.42 Mill. A. White Winter decreased 2% from 3.34 to 3.27 Mill. A. Current Winter Wheat conditions are very poor. Open winter could create winter kill concerns.
52
53 Winter Wheat Conditions State Very Poor Poor Fair Good Excellent Kansas Oklahoma Texas Colorado Montana South Dakota Illinois Ohio Missouri State Avg Last Week Last Year USDA Crop Progress Report Nov. 26, 2012
54
55 QUESTIONS & COMMENTS? Frayne Olson Dept. of Agribusiness & Applied Econ. NDSU Dept P.O. Box 6050 Fargo, ND