A Protocol for Identifying Suitable Testing & Deployment Sites of Poplar Energy Production Systems in the Midwest, USA
|
|
|
- Beatrice Willis
- 5 years ago
- Views:
Transcription

1 A Protocol for Identifying Suitable Testing & Deployment Sites of Poplar Energy Production Systems in the Midwest, USA Ronald S. Zalesny Jr. 1, Deahn M. Donner 1, David R. Coyle 2, William L. Headlee 3, Richard B. Hall 3 1 Forest Service, United States Dept. of Agriculture Northern Research Station Institute for Applied Ecosystem Studies Rhinelander, WI University of Wisconsin, Dept. of Entomology 3 Iowa State University, Dept. of Natural Resource Ecology & Management


2 Energy Forest bioenergy & bioproducts supply chain

3 Energy Biofuels Bioenergy Bioproducts

4 Renewable Fuel Standard Energy Independence & Security Act of 2007 Annual production of 36 billion gallons of biofuels by 2022 Ethanol production from corn capped at 15 billion gal yr -1 Remaining 21 billion gallons from advanced biofuels 16 billion gallons from cellulosic biofuels Seven-fold increase in current biomass production from 190 million dry tons to 1.36 billion dry tons DOE / USDA goal of replacing 30% petroleum consumption with biofuels by 2030 Biofuels Production (billion gallons) Total Corn Cellulosic Year Perlack, R.D Biomass as feedstock for a bioenergy and bioproducts industry: the technical feasibility of a billion-ton annual supply. DOE-USDA. DOE/GO ORNL/TM-2005/66 Source: Renewable Fuels Association.

5 Poplar Genetics Research Northeastern s 1924 to 1939: 13,000 hybrids Lake States 1950 s (IL), 1960 s (MN), 1980 s (IA & WI) Pacific Northwest s USFS : 25 Oxford Paper Company varieties planted in lower Michigan 1950: LSFES rejected Schreiner s idea for collaborative study 1983: Poplar genetics research began
 Ames, IA (ISU) (R. Hall) ~88,000 Genotypes Urbana-Champaign, IL (UI UC) (J.")
6 North Central Poplar Breeding Duluth, MN (UMN NRRI) (B. McMahon) ~40,000 + ~48,000 St. Paul, MN (UMN TC) (C. Mohn) Ames, IA (ISU) (R. Hall) ~88,000 Genotypes Urbana-Champaign, IL (UI UC) (J. Jokela) + Previous >100,000 Genotypes

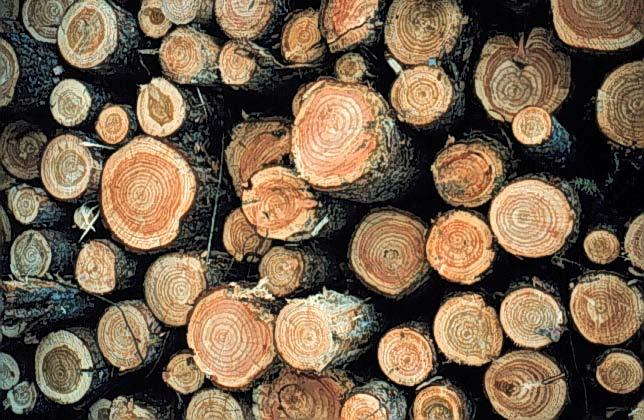
7 Why Poplars? Realized Productivity Switchgrass 20 Mg ha -1 yr -1 Willow 18 Mg ha -1 yr -1 Poplar 16 Mg ha -1 yr -1 Potential Productivity >22 Mg ha -1 yr -1 Depends on genotype environment interactions
 Energy returned on energy invested (EROEI) Can be stored on the stump until harvest Harvest throughout the year Minimal fertilization Extended haul distances Used in crop rotations to")
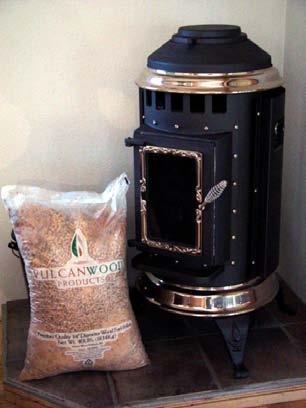
8 Additional Advantages Energy per biomass unit: to J Mg -1 (16.5 to 17.2 MBtu dt -1 ) Energy returned on energy invested (EROEI) Can be stored on the stump until harvest Harvest throughout the year Minimal fertilization Extended haul distances Used in crop rotations to improve soil tilth Elevated rates of soil carbon storage Superior genotypes replace existing clones Cellulose 2 to 55 Willow 13 Poplar 12 Sugar Cane 8 Switchgrass 5.4 Soybean 2.5 Corn 1.34 Sources: 1.) 2.) Schmer et al Net energy of cellulosic ethanol from switchgrass. PNAS 105(2):


9 Sustainability Short rotation woody crops are one of the most sustainable sources of biomass, provided we strategically place them in the landscape & use cultural practices that Conserve soil & water 1990 Recycle nutrients 1994 Maintain genetic diversity 1996 *Uniformity within *Diversity among *4 ha clone -1 Hall, R.B Woody bioenergy systems in the United States. NRS-GTR-P-31.

10 (Mg ha -1 yr -1 )
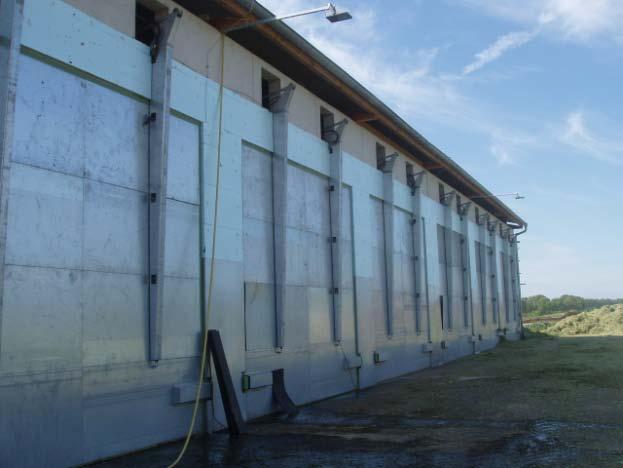
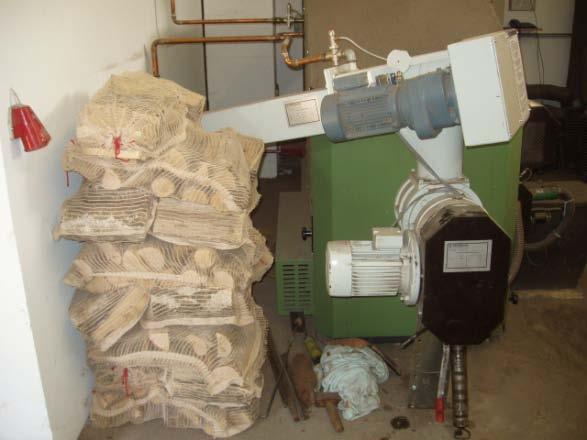
11 Potential Limitations to Success Intensive management & high costs during establishment Elevated water usage Failure to match clones with sites History of land use (i.e., social resistance to monocultures) Competition for land & price of land Competition among end uses Harvest efficiencies Difficulties in drying the wood Loss of research funding
 Competition for land & price of land Competition among end uses Harvest efficiencies Difficulties in drying the wood Loss of research")
12 Potential Limitations to Success Intensive management & high costs during establishment Elevated water usage Failure to match clones with sites History of land use (i.e., social resistance to monocultures) Competition for land & price of land Competition among end uses Harvest efficiencies Difficulties in drying the wood Loss of research funding
13 Sustainability Social Economic Ecological Biological
14 Long-Range Goal Develop a protocol for identifying suitable testing & deployment sites of poplar energy production systems in the Midwest, USA (& beyond )

15 Objectives 1. Develop coarse & fine resolution digital maps of environmental & sociopolitical constraints to identify candidate core areas Climatic Factors + Sociopolitical Factors 2. Construct database of poplar growth & development, apply information within areas Potential Core Areas Identified 3. Evaluate land-use, soil health, & water quality changes within areas Refine Core Areas using Soil Factors Probable Core Areas Identified 4. Synthesize results to assess potential impacts of deploying poplars across region Inputs Literature Review Expert Consultations Field Reconnaissance Evaluate Landuse Water quality Soil Health Regional Synthesis Zalesny, R.S. Jr., et al Land-use, soil health, & water quality changes w/ woody energy crop production in Wisconsin & Minnesota. WI FOE EERD Proposal.
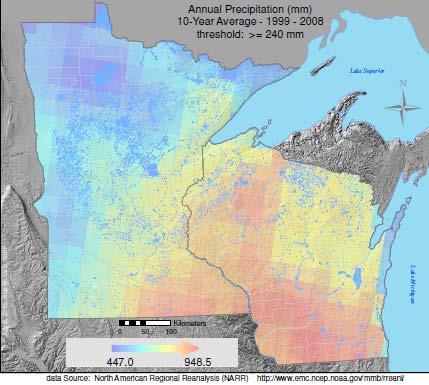
 Soil texture Precipitation / Temperature Flood frequency Depth to bedrock Patch")
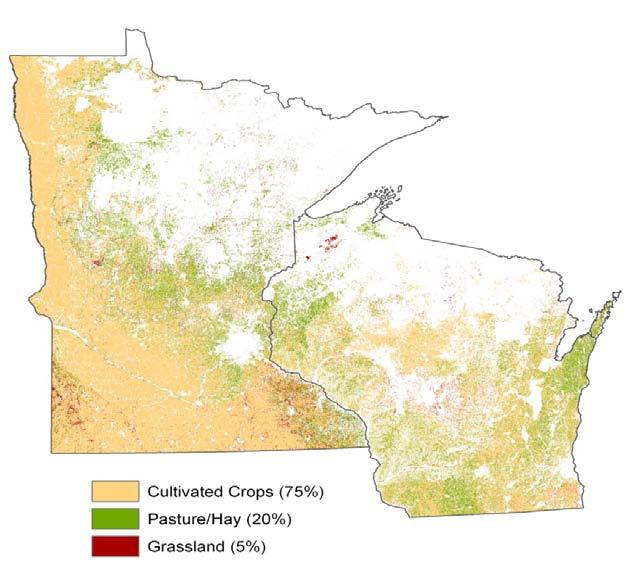
16 Map Development Constraints Considered Land cover class Land ownership Available water storage capacity Water deficit (P PET) Soil texture Precipitation / Temperature Flood frequency Depth to bedrock Patch size
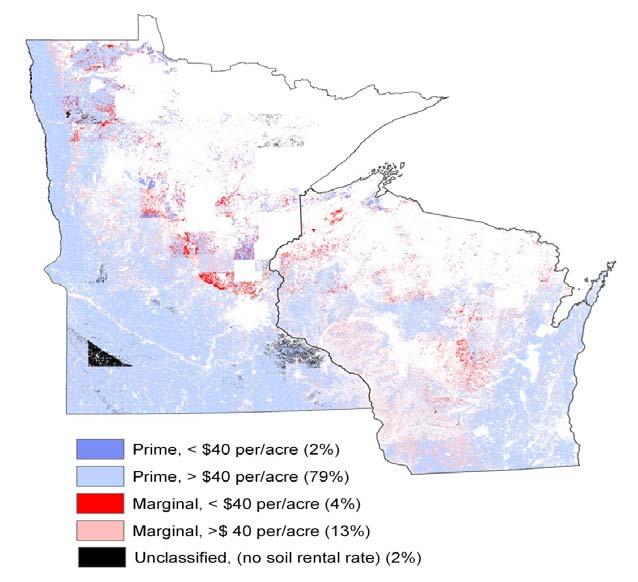
17 Map Development Final Constraints CONSTRAINTS National Land Cover Dataset (NLCD 2001) GAP Stewardship 2008 (Land Ownership) Available Water Storage Capacity (SSURGO) Precipitation Potential Evapotranspiration (PPET) Soil Texture (SSURGO) DEFINITION OF CONSTRAINTS USED Grassland/Herbaceous, Pasture Hay, Cultivated Crops Federal, Tribal, State, County (excluded) 7 cm (assuming 0 to 50 cm depth, 0.15 fraction available water) PPET for the months of April and May combined Clay Loam, Coarse Sandy Loam, Coarse Silty, Fine Sandy Loam, Gravelly Loam, Gravelly Sandy Loam, Loam, Loamy Coarse Sand, Loamy Sand, Mixed, Sandy Clay Loam, Sandy Loam, Sandy Over Loam, Silt Loam, Silty, Silty Clay Loam, Very Fine Sandy Loam
18 Potential Land Base County Hectares County Hectares County Hectares Aitkin 12,729 Itasca 14,859 Pope 123,517 Anoka 2,334 Jackson 109,339 Ramsey 154 Becker 44,401 Kanabec 17,868 Red Lake 30,955 Beltrami 18,239 Kandiyohi 78,256 Redwood 171,551 Benton 51,440 Kittson 35,451 Renville 119,623 Big Stone 48,260 Koochiching 1 Rice 84,282 Blue Earth 116,734 Lac Qui Parle 93,685 Rock 98,246 Brown 116,441 Lake 0 Roseau 135,899 Carlton 13,192 Lake of the Woods 12,874 Scott 44,109 Carver 35,800 Le Sueur 73,775 Sherburne 3,557 Cass 9,874 Lincoln 40,919 Sibley 83,110 Chippewa 107,409 Lyon 79,170 St. Louis 1,452 Chisago 34,413 Mahnomen 21,395 Stearns 189,848 Clay 139,035 Marshall 91,743 Steele 85,142 Clearwater 31,547 Martin 92,834 Stevens 96,274 Cook 0 McLeod 51,791 Swift 64,287 Cottonwood 141,032 Meeker 61,087 Todd 102,704 Crow Wing 0 Mille Lacs 19,812 Traverse 94,004 Dakota 72,864 Morrison 87,040 Wabasha 35,109 Dodge 77,200 Mower 157,995 Wadena 19,232 Douglas 84,348 Murray 104,565 Waseca 59,345 Faribault 109,180 Nicollet 60,925 Washington 29,702 Fillmore 140,009 Nobles 137,910 Watonwan 82,385 Freeborn 136,488 Norman 98,855 Wilkin 127,100 Goodhue 79,882 Olmsted 120,324 Winona 82,848 Grant 76,913 Otter Tail 133,597 Wright 62,238 Hennepin 20,908 Pennington 45,871 Yellow Medicine 145,608 Houston 69,599 Pine 1 Hubbard 8,778 Pipestone 72,500 Isanti 47 Polk 112,798 Total 5,998,612
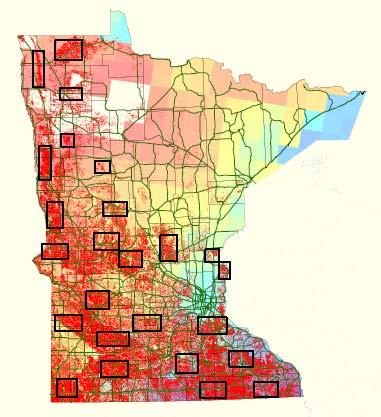
19 Field Reconnaissance

20 Field Sites Agronomic Old US DOE poplar trials Production plantings


")
21 48 agronomic sites alfalfa, corn, grass, oats, sod, soybean, sugar beet, sunflower, tillage radish, tilled fallow field, & wheat) 4 cover types = 80% corn (31%) soybean (23%) alfalfa (13%) grass (13%)

22
23 Agronomic Site Characterization 11% 4% Slope Class Surface Stoniness 2% 27% 58% 0 to 2% 2 to 5% 5 to 9% 9 to 15% >15% 98% Non-Stony Slightly Stony Moderately Stony Very Stony Exceedlingly Stony Excessively Stony Erosion Risk Soil Drainage 23% 10% 15% 37% 15% Very Low Low Medium High Very High Extreme 33% 4% 23% 40% Rapidly Drained Well Drained Moderately Well Drained Imperfectly Drained Poorly Drained Very Poorly Drained


24 Soil Textures Silt Loam 8% Silty Clay Loam 10% Clay Loam 17% Sandy Loam 32% Loam 25% Sandy Clay Loam 3% Sand 1% Loamy Sand 4% Compare soil from individual sites with GIS data

25 Poplar Suitability Low High Predict location of land-use change in addition to estimating quantity of land-use change
26 Integrated Studies Enterprise Budgets Landowner Preferences Productivity Modeling Carbon Sequestration

27 Future Directions Wisconsin (2010/2011) Iowa (2012) Evaluate Changes Regional Synthesis Poplar Suitability Low High
28 Thank you! Contact Information Dr. Ronald S. Zalesny Jr. Team Leader, Genetics and Energy Crop Production Research Plant Geneticist U.S. Forest Service Northern Research Station Institute for Applied Ecosystem Studies 5985 Highway K Rhinelander, WI Phone: Cell: Fax: rzalesny@fs.fed.us populusdatabase@gmail.com