orth entral Research Station
|
|
|
- Walter Carson
- 5 years ago
- Views:
Transcription


1 Simulating Landscape Changes Due to - habitat succession, - natural disturbance events, - and management and predicting impacts on birds Steve Shifley and Frank Thompson orth entral Research Station
2 Outline Assumptions The issues of scale and detail Classes of models Pro and Cons Example application
3 Focus on how disturbance affects forest landscapes How does a specific landscape change in response to disturbance over time Harvest, fire, wind, herbivory, land use change Attributes of interest include Vegetation composition & structure Wildlife population size or habitat quality Economic value Aesthetic Quality Water Quality How are those changes spatially arranged? How do those changes affect policy and decision making?

4 Working across multiple scales Trees vs. Wildlife vs. Everything else Our problem was to find a means to predict forest structure and composition in a spatially-explicit model capable of tracking the location of disturbance events, linking disturbances to the specific forest vegetation communities affected, and predicting how the forest vegetation, wildlife, and other attributes will change over time. Essentially this amounted to creating a dynamic map of predicted forest vegetation composition and structure through time and linking wildlife and other attributes to that.
5 Scale and Detail For wildlife modeling, figure out what you need to know about the landscape and its vegetation vs. what you d like to know. Understand the range of models available and their limitations. Settle on the best available of all the inadequate choices. Weigh requirements carefully.

6 There is a huge cost associated with requiring too much detail in a model. Death by 1,000 cuts In Western accounts, the Death by a Thousand Cuts involved having small bits of skin or flesh cut from an individual over a period of days. Excessive detail in simulation costs three times Initialization Processing Post-processing It consumes Your time CPU time Storage space Multiply that by millions of pixels and hundreds of years Those paper cuts scare me half to death.

7 But there is also a huge cost associated with failure to anticipate future options Build it and they will come Sometimes if you build on faith --with the expectation that things will work out-- they really do.but only sometimes. If you successfully go through a regional modeling project for birds, you will arouse the attention (and envy) of the people working with bats and herps, and large mammals, etc. With a little forethought you may be able to kill two birds with one stone. in a manner of speaking. Field of Dreams
8 Scale and Detail In theory we could just use tree- or standlevel data, simulate change, and aggregate that to get landscape scale inference. Maybe someday that will work. Currently we have Spatial gaps in stand-level data Limited computational capacity Limited data storage capacity Limited hours in the day So there are discrete approaches that vary with spatial and temporal scale
9 Spatial and Temporal Scale Stand (2 to 50 ha, 1 to 50+ years) Compartment (100 to 10,000 ha; 10 to 100+ years) Multiple Stands Typically one owner Often all forested Landscape (1,000 to 1,000,000+ ha, 50 to 100+ yrs) Multiple owners Mixed land cover Ecoregion(s) (Millions of ha, 50 to 100+ yrs) Mega landscape Mixed land cover Multiple owners High diversity
10 Spatial and Temporal Scale Stand Compartment Multiple Stands Typically one owner Often all forested Landscape Multiple owners Mixed land cover Ecoregion(s) Mega landscape Multiple owners Mixed land cover High diversity More detail in and detail out Greater data cost/ha initialization More effort for first output Greater total project cost
11 Spatial and Temporal Scale Stand Compartment Multiple Stands Typically one owner Often all forested Landscape Multiple owners Mixed land cover Ecoregion(s) Mega landscape Multiple owners Mixed land cover High diversity Available Options 1. Inexpensive 2. Fast 3. Useful You Can Pick Two
12 Modeling Tools By Scale Stand FVS Compartment LMS Landscape LMS, TELSA, HARVEST, LANDIS Ecoregions TELSA, HARVEST, LANDIS
13 Forest Vegetation Simulator, FVS Based on inventory plots with sampled tree lists For each sampled tree Species Dbh Per acre expansion (sampling) factor Height (optional) Crown (optional) Predicts tree growth mortality, harvest, disturbance Summarize trees to get plot/ stand change over time Easy to run with a population of inventory plots Can link to FIA plots Limited options for spatial interaction among plots Wide geographic area of applicability

14 Forest Vegetation Simulator Variants

15 FVS links to Stand Visualization System

16 Forest Vegetation Simulator Variants
17 Forest Vegetation Simulator, FVS Tree/Stand based: 2 to 100ha (often too small for wildlife issues) High resolution Good stand dynamics for growth and survival Excellent support Limited regeneration modeling in the East Data intensive Consequently limited spatial scale Initialization issues Processing issues SUPPOSE interface for multiple stands USDA Forest Service, Management Service Center, Ft. Collins
18 Landscape Management System (LMS)
19 LMS Implements FVS for tree, stand and landscape dynamics Brings in terrain, GIS interface Powerful Display tools Excellent support A few stands to perhaps >10,000 stands
20 LMS Components LMS Interface LMS Portfolio: Data Files Site and Topographic data Tree List Inventories Spatial Data (optional) Growth Simulation FVS ORGANON Other Models Treatment and Disturbance Simulation Analysis Tables Over 50 analysis tables Visualization SVS EnVision

21 LMS Data intensive Tree-level detail (same as FVS) Spatial layers Hard to find a landscape with every stand sampled so you have to work around that for initial tree lists Excellent for one ownership with good inventory data Visually compelling at a cost of time and effort
22 VDDT and TELSA Polygon based (e.g., stand based) No tree-level data Pre-defined vegetation pathways and probabilities


23 Potential Vegetation Types and Pathways Probability State Stand initiation stage Expand by by Forest type type Disturbance factors -Fire -Wind --Insect --Harvest Stem exclusion stage -Fire Understory reinitiation stage Can Can be be quite complex Mixed stage Complex stage
24 VDDT and TELSA Available from ESSA Technologies VDDT is free, TELSA is free only for research and education ArcView interface Mostly Western U.S. and Canadian applications Powerful display tools Up to about 250,000 ha Less detail, easier set up for large landscapes Visually less elegant than LMS Within-polygon detail, when needed, must be derived from vegetation types Uneven-aged forest structure Canopy gaps
25 Raster Based Models HARVEST and LANDIS. Scaleable pixel size (10m to 1km). Works with or without stand boundaries. At finer resolutions can show within-stand variability (gaps, uneven-age/size structure, multiple species) resulting from harvest or other disturbance. Large scale, large investment, potentially high utility.

26 HARVEST Model Age-based model of landscape response to timber harvest. Designed for wildlife applications. Easy-to-use, focused, flexible, fast Can be applied to a million ha or more simultaneously Good way to look at effects of harvest amount, type and placement across a landscape Limited tree species succession capabilities; primary focus is on age classes No natural disturbance (e.g., wind, fire, insects). Eric Gustafson, NCRS, Rhinelander, Wisconsin.
27 LANDIS Developed by David J. Mladenoff and colleagues, Un WI-Madison Hong He, University of Missouri at Columbia Linked to RAMAS Large number of colleagues working on applications and extensions Forest management in the Northern Lake States Effects of climate warming in N Wisconsin LANDIS in the Ozarks of Missouri LANDIS in southern Indiana LANDIS in the California Chaparral LANDIS in the Southeastern pine ecosystems LANDIS in Finland LANDIS in British Columbia Fire simulation Pest models Software enhancements
28 LANDIS model Generic framework for simulating landscape change in response to disturbance Tool for evaluating outcomes of alternative (disturbance) scenarios Handles all the basic bookkeeping and mapping Scaleable pixel size (10m to 1,000m; 0.01ha to 1km) Tracks presence/absence of tree species on each pixel by age and location Must be calibrated for local forest conditions (not trivial) Simulates stochastic fire events Simulates stochastic wind events Harvest simulator
29 LANDIS Operational Design model input climate zone soil map DEM model simulation fire wind Insect/disease harvest processes Multiple fire regimes: Ignition, size, cycle, spread, intensity and severity Wind regimes: size, cycle, spread, intensity and severity Epicenter, frequency, size, Hosts, susceptibility, intensity, and severity Harvest prescriptions: stands, management units, rotation size, species, and methods multiple species and age input maps fuel Land type Fine, coarse and life fuel Accumulation/decomposition Environmental boundaries and constrains Site and species interactions succession, seeding, disturbance history, and disturbance interaction output single species map reclassified vegetation type output disturbances species age Classes year 0 year n
30 LANDIS Representation of a Site (pixel) Species 10 year age classes 1 = present, 0 = absent Growth Age Age 240 Maple Shortleaf Wind Mortality Fire Succession Black oak Harvest White oak
31 Calibration Process for LANDIS Identify Land Units (ecological land types) Calibrate species reproduction and survival dynamics based on life history characteristics Longevity, shade tolerance, fire tolerance, dominance Sprouting, age to sexual maturity, seed dispersal Reproduction probability Calibrate wind and fire disturbance Frequency (return interval), size, severity
32 Required Input Maps (raster) Land units (ecological classification system) Initial vegetation cover and age class Additional maps required to simulate harvest Management area (any group of stands) Stand boundaries

33

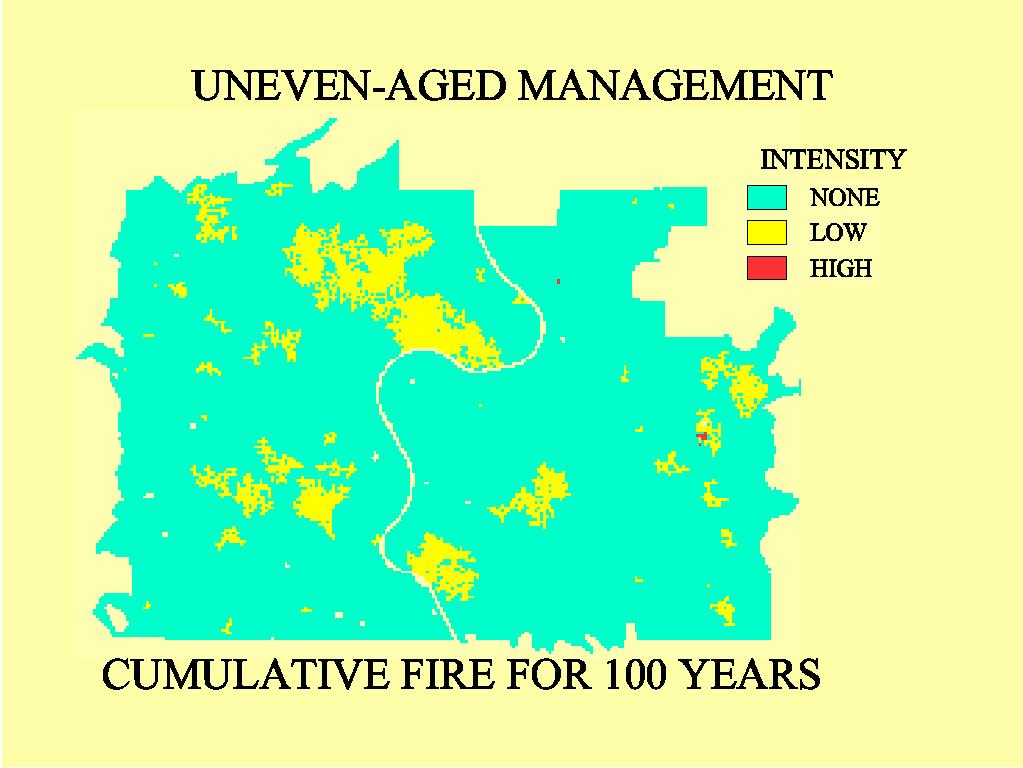
34

35

36
37

38

39 Fires once were common -- Every years in 1800 s With active suppression the mean fire return interval is now about 300 years. -- Crown fires are rare

40 Wind/weather disturbances Wind creating and Weather crown Disturbance openings affecting 0.1 to 2.5 ha per event have a return interval of approximately 800 years
41 Selected Harvest Options Harvest per decade 5% 10% Harvest treatment Even-aged (clearcut) Uneven-aged (group selection) Mixed No harvest


42 Even-aged management by clearcut

43 Uneven-aged management by group selection

44 Age 0

45 Age 5

46 Age 10

47 Age 15

48 Age 28

49 Age 50

50 Age 90

51 Age 120+

52 SIZE CLASS
53
54 450 STANDS - MARK TWAIN NATIONAL FOREST

55
56
57 SIZE CLASS
58 SIZE CLASS
59 SIZE CLASS
60 SIZE CLASS

61 SIZE CLASS
62 SIZE CLASS
63 SIZE CLASS
64 SIZE CLASS
65 SIZE CLASS
66 SIZE CLASS
67 SIZE CLASS
68 SIZE CLASS
69 SIZE CLASS
70 SIZE CLASS
71 SIZE CLASS
72 Output Maps for Each Decade of Simulation Tree species (or dominance) Vegetation age class Fire damage Wind damage Type and location of harvest Anything that can be derived from or linked to these characteristics


73 Tree size classes - year 100 Even 10% 5 km Uneven 5% No Harv.
74 Percent Percent Even-aged 5% Sawlog Pole Sapling Seedling Uneven-aged 5% Mixed 5% Even-aged 10% No harvest Area by stand size class for 200 years of simulation Year Year
75 Length of Edge Year 20 Year 200 Edge m/ha EAM05% EAM10% MIX05% MIX10% UAM05% UAM10% NOHAR
76 Core Area > 50 years old and 60 M from edge Core area (ha) Year 20 Year EAM 5% EAM 10% UAM 5% UAM 10% No Harvest
77 Species group occurrence Uneven-aged management 5% harvest alternative 120 Percent of landscape Year of simulation White oaks Pine Red oaks Maple
78 Strengths Provides the big picture. Great tool to view large scale forest change Compare management alternatives visually Generates discussion with public and across disciplines Model vegetation succession Analyze projected landscape characteristics Compare landscape statistics among alternatives Assess change over time. Operational tool to guide multiple use forest planning Make linkages to other resources Wildlife Mast Timber Down wood Cavities Enthusiastic developer and user groups
79 Limitations Not suitable for site-specific planning Maps create tendency to take results too literally Probabilistic model (+/-) (repeated runs) Requires significant GIS capability Big effort to learn to use it (getting better) Requires maps of land units and stands for most harvest simulations Needs lots of computing horsepower for big landscapes
80 Wildlife modeling process LANDIS Tree age and tree species maps Other coverages Habitat models


81 Ovenbird Habitat Suitability No harvest Even-age 10% Year 200 Year 50
82 Wildlife modeling process LANDIS Other coverages Tree age and tree species maps Habitat models Habitat suitability maps Viability modeling
83 Ovenbird viability N (1,000s) NH Even 10 Carrying capacity Year
84


85 Black Bear Habitat Suitability 4 km wide
86 Mean HSI values (year 30) No harvest Uneven-age 5% Even-age 10% Ovenbird Squirrel Black bear Prairie warbler Red bat
87
88
89
90


91 Habitat model links
92
93
94 DOMINANT
95 DOMINANT
96 DOMINANT
97 DOMINANT
98 DOMINANT
99

100
101
102
103 SIZE CLASS
104 SIZE CLASS
105 SIZE CLASS
106 SIZE CLASS
107 SIZE CLASS
108 SIZE CLASS
109 SIZE CLASS
110 SIZE CLASS
111 SIZE CLASS
112 SIZE CLASS
113 Our Basic Modeling Assumptions Vegetation is constantly responding to (recovering from) disturbance. To some degree (and to a greater degree than most other ecosystem components), patterns of vegetation change are predictable. The landscape can be divided into ecologically similar units (ECS) that affect vegetation change. If we know (or can predict) the vegetation conditions across a landscape at some future point in time, we can say significant things about other ecosystem components. Requires a multi-disciplinary team
114 Simulating Effects of Timber Management, Wind, and Fire on Forest Landscapes to Guide Multiple-use Forest Planning Stephen R. Shifley Frank R. Thompson III William D. Dijak North Central Research Station U.S. Department of Agriculture Forest Service Columbia, Missouri
115 Source: International Geosphere/Biosphere Program cgi-bin/php/frameset.php

116

117 Forest Cover 33% of Missouri is forested Minnesota Iowa Wisconsin Michigan 30% of the North Central Region is forested 33% of the U.S is forested Illinois Indiana 31% of the North America is forested Missouri 30% of the World is forested