K&C Phase 4 Status report. Retrieval of forest biomass and biomass change with spaceborne SAR
|
|
|
- Antony Hodge
- 5 years ago
- Views:
Transcription
1 K&C Phase 4 Status report Retrieval of forest biomass and biomass change with spaceborne SAR Johan Fransson 1, Jonas Fridman 1, Ivan Huuva 1 Håkan Olsson 1, Henrik Persson 1, Jörgen Wallerman 1, Maurizio Santoro 2, Leif Eriksson 3, Maciej Soja 3, Lars Ulander 3, and Anders Persson 4 1 Swedish University of Agricultural Sciences, Umeå, Sweden 2 Gamma Remote Sensing, Gümligen, Switzerland 3 Chalmers University of Technology, Göteborg, Sweden 4 Swedish Forest Agency, Jönköping, Sweden Science Team meeting #24 Tokyo, Japan, January 29-31, 2018
2 Project outline and objectives In the ongoing project, seen as a continuation of the K&C Initiative activities performed in the previous Phases 1, 2 and 3, multitemporal ALOS-1 PALSAR-1 and ALOS-2 PALSAR-2 data are used to further develop and validate methods for large-scale biomass and biomass change mapping. A biomass map covering all of Sweden will be derived using PALSAR-2 data for the year 2015 and compared to: i) the PALSAR-1 biomass (stem volume) map derived in Phase 3, ii) statistics from the Swedish National Forest Inventory (NFI), and iii) the Swedish forest map of 2015 based on airborne laser scanner data.
3 Project outline and objectives To derive the PALSAR-2 biomass map, the previously used algorithm based on the Water Cloud Model in Phase 3 is used and further developed and validated (BIOMASAR algorithm). By comparing the biomass maps of 2015 and 2010, both loss in biomass (i.e., clear-cuts, thinning cuttings, wind-thrown damages) and forest growth can be studied. An ongoing pilot study is conducted using L-band data from the BioSAR 2007 and BioSAR 2010 BIOMASS campaigns at the test site Remningstorp in southern Sweden (Ivan Huuva et al.).
4 Project outline and objectives Furthermore, change detection of the forest cover in terms of detecting and delineating clear-felled areas for all of Sweden will be performed using PALSAR-2 data from the years 2015 and The approach will be to use a similar methodology as developed in Phases 1 and 2. The clear-felled areas derived from PALSAR-2 data will be compared to clear-cut maps from: i) the Swedish Forest Agency and ii) statistics from the Swedish NFI.
5 Project outline and objectives The project will involve analysis of more than 28 million ha of boreal and hemi-boreal forests in Sweden. The differences in weather conditions, topography, forest properties, time of acquisition, number of observations and incidence angle range make it especially important to develop a robust methodology for future operational use. It is anticipated that the proposed project will advance the knowledge towards an operational use of high-resolution L- band SAR data in forestry applications. The methods and algorithms that will be developed also aim to demonstrate the large-scale forestry monitoring goals of the JAXA s ALOS K&C Initiative
6 Project outline and objectives The project supports the 4 K&C thematic drivers, i.e. Carbon Cycle Science, Climate Change, International Conventions, Environmental Conservation. In this context, for example, there is a synergy with the K&C Phase 4 project Coupling radar-based estimates of forest information with biosphere models for improved carbon flux estimation by Maurizio Santoro


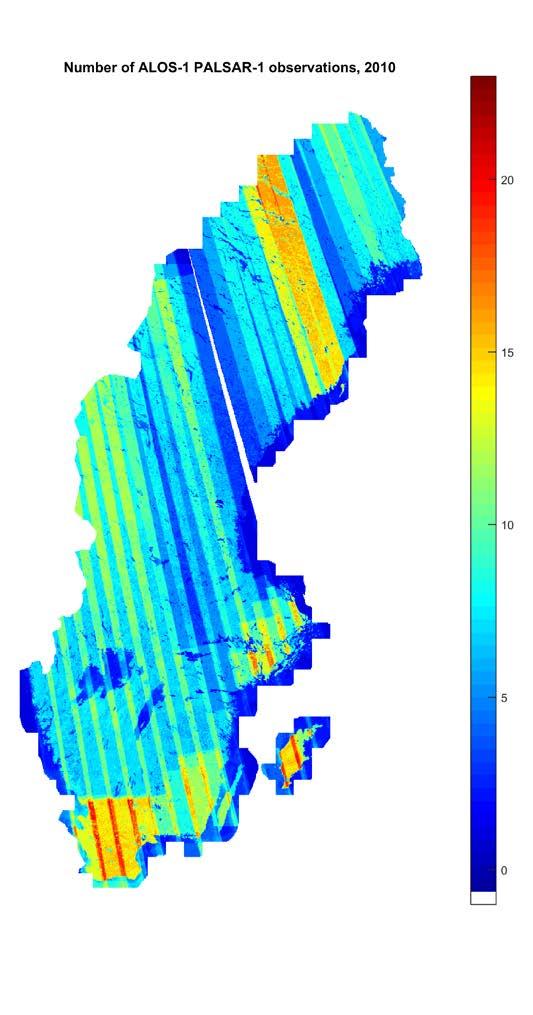
7 Project outline and objectives Left: JAXA ALOS K&C Initiative prototype areas and test sites in Sweden. Right: Stem volume map of Sweden from multi-temporal ALOS-1 PALSAR-1 images (25 m resolution).
8 The BIOMASAR approach Retrieving forest growing stock volume from SAR backscatter I i SAR images e.g., one year of ASAR data or PALSAR mosaics Training with: - MODIS VCF - Forest map - Dataset of max GSVs V i GSV maps - No in situ data required to train the model GSV map

9 Water Cloud Model Semi-empirical model: - attenuation coefficient, depends on forest structure & dielectric props. - Stem volume Inverted model for stem volume estimation: - Vegetation backscattering coefficient - Ground backscattering coefficient - Forest backscatter intensity - Measured backscatter

10 30 km 30 km Example of a tiled SAR backscatter image 006_039_ _193_FBD_HV.ortho.norm


11 NFI plots available for validation Yellow: permanent plots measured in 2005, 2010 or 2015 Purple: temporary plots measured between 2007 and 2011 (freely available)

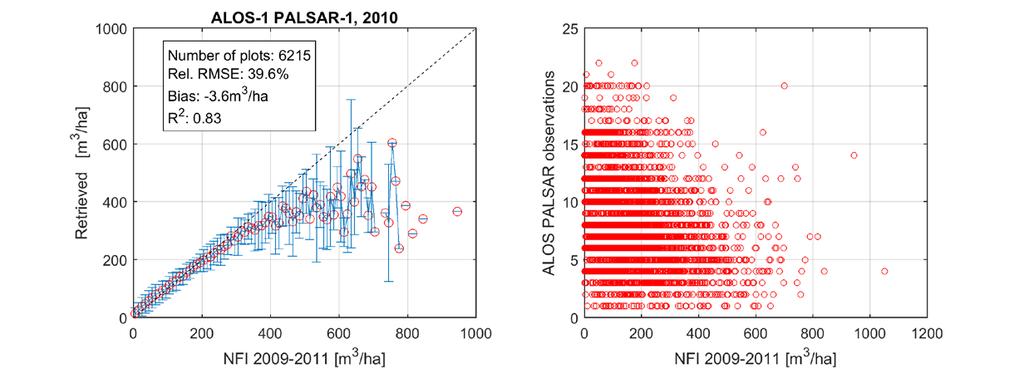
12 The size of NFI plots (10 m or 7 m radius) is comparable to the size of an ALOS pixel (25 m) A plot, however, may not fall exactly within a pixel In addition, the forest represented in a plot does not match with the forest seen by the radar Plot vs. pixel assessment is appealing, but bears complications that limit the understanding of the retrieval Plot vs. pixel neighborhood assessment is more indicative of the quality of the retrieval, but retrieval statistics need to be well interpreted Plots are meant to derive statistics it is more correct to assess retrieved biomass by looking at spatial averages
13

14 Plot vs. pixel Plot vs. neighborhood (closest estimate)
15
16 Note: averaging over 20 plots, means we are virtually validating a ~ 1 ha area
17 Retrieval from ALOS-1 PALSAR-1 data: 2010 as of January 2018, not final Forest area: 252,415 km 2 (1% of Sweden not covered by ALOS-1 data in 2010) Total volume (m 3, constrained retrieval): 2,948 m 3 Total volume (m 3, unconstrained retrieval): 3,509 million m 3 NFI statistics based on plots from (published in Skogsdata 2014) Forest land: 280,680 km 2 (including non-productive forest area) Total volume: 3,304 million m 3 (living) million m 3 (dead wood)


18 _092_FBD_HH In total, 218 image strips, acquired between and FBD mode (HH and HV) Slant range geometry calibration, terrain geocoding and topographic correction done with GAMMA software Artefacts in near range not compensated for

19 Temporal distribution of ALOS-2 data slightly skewed towards winter months Only 46% of data acquired during spring-to-fall, i.e. under best conditions for biomass retrieval using L-band backscatter
20
21
22
23 Retrieval from ALOS-2 PALSAR-2 data: as of January 2018, not final Forest area: 254,733 km 2 Total volume (m 3, constrained retrieval): n/a Total volume (m 3, unconstrained retrieval): 4,024 million m 3 NFI statistics based on plots from (published in Skogsdata 2017) Forest land: 282,630 km 2 (including non-productive forest area) Total volume: 3,445 million m 3 (living) million m 3 (dead wood)
24 Larger stem volume predicted with the ALOS-2 dataset than with ALOS-1 Biomass increase is substantially larger than growth factors (3-10 m 3 /ha year m 3 /ha) Reasons: large proportion of winter data used in 2015 and variable incidence angle range situations probably not yet well modelled in the BIOMASAR algorithm? Need to do a more in depth analysis of signatures
25 References Fransson, J.E.S., Santoro, M., Wallerman, J., Persson, H.J., Monteith, A.R., Eriksson, L.E.B., Nilsson, M., Olsson, H., Soja, M.J., and Ulander, L.M.H. (2016). Estimation of forest stem volume using ALOS-2 PALSAR-2 satellite images. In Proceedings of IEEE International Geoscience and Remote Sensing Symposium, pp Huuva, I., Fransson, J.E.S., Persson, H.J., Wallerman, J., Ulander, L.M.H., Blomberg, E., and Soja, M.J. (2017). Measurements of forest biomass change using L-and P-band SAR backscatter. In Proceedings of IEEE International Geoscience and Remote Sensing Symposium, pp Santoro, M., Fransson, J.E.S et al. (2018). Biomass estimation in boreal and tropical forest using multi-temporal L-band backscatter observations.
26 Project milestones Completion of the biomass map of Sweden 2015 (end of JFY 2017) (biomass map for the year 2010 has been delivered to JAXA at the end of Phase 3). Completion of the clear-cut maps of Sweden for the time period (end of 2018 extension requested). Completion of the biomass change map of Sweden for the time period (end of 2018 extension requested). Yearly feed-back to JAXA on quality of their data products.
27 Deliverables The following products will be delivered: Biomass map of Sweden for year Clear-cut maps of Sweden for the time period Biomass change map of Sweden for the time period Ground-truth data from the test sites Remningstorp and Krycklan.


28 Thank you!