2018 Silviculture Institute Pine Oak Hemlock 5/17/2018. New Markets for Northeastern Forest Owners? An intro to Ecosystem Markets
|
|
|
- Curtis Little
- 5 years ago
- Views:
Transcription

1 New Markets for Northeastern Forest Owners? An intro to Ecosystem Markets John S. Gunn, Ph.D. Research Assistant Professor of Forest Management Dept. of Natural Resources and the Environment NH Agriculture Experiment Station UNH Cooperative Extension Northeast Silviculture Institute for Foresters May 17, 2018 Portsmouth, NH 1 Outline What are Ecosystem Services? Ecosystem Markets What needs to be in place? What markets are there? Water, Carbon (but really just carbon) Carbon Markets 101 Silviculture and C 2 1


2 Timber Clean Water Wildlife Habitat Clean Air Climate Regulation (C storage & seq.) 3 4 2
 Clear Drivers create demand Clear identification of a")
3 Elements of Ecosystem Service Markets Clear identification of a beneficiary (buyer) Clear Drivers create demand Clear identification of a seller 5 6 3


4 Types of Watershed Markets Water quality trading & offsets Instream buybacks and groundwater mitigation 7 8 4

 2.")
 Mitigation Funds")
5 Sellers Water Quality ES Marketplace Users Water District/Utility Rate Payers PWD Stewardship Incentive Fund Recreation Industry Ground Water Users NRCS EQIP Dedicated Pool Restoration Improved Practices Preservation 1. Failure: 200,000 free riding consumers (also the beneficiaries) 2. Demand Drivers: Safe Drinking Water Act, EPA filtration exemption 3. Market Challenge: 190 mi 2 ; 82% forested (mostly private FF owners) Mitigation Funds State/Town Current Use Tax Zoning/TDR In Lieu Fee Compensation Program (ME DEP/TNC) Buyers 9 Green vs. Gray Investments 10 5


6


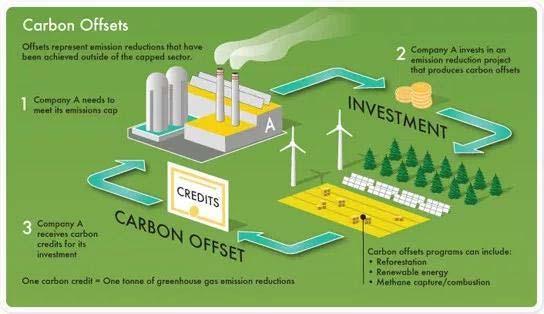
7 Carbon Offsets real, verifiable, additional, and permanent Voluntary Markets Compliance Markets 13 Navigating the Carbon Offset World Relevant US Standards 1. Verified Carbon Standard (VCS) 2. California Air Resources Board (ARB) 3. American Carbon Registry (ACR) 4. Climate Action Reserve (CAR) Markets Registries Standards Methodologies 14 7
8 Baselines and Additionality Generating Credits 15 Project Specific Baseline maximize net present value (NPV) of perpetual wood products harvests 16 8
 Dry Tons = ½ green ton weight")
9 Stocks and Flows Stocks how much C is stored in a given acre of forest? Flow what is the rate of accumulation? Depends on: Site Class; Forest Type; Development Stage; Current Management; Mgmt & Disturbance History 17 Some Notes On Units Green Tons (green cord = 3,000 5,500 lbs) Dry Tons = ½ green ton weight Carbon (C) = ½ dry ton weight (or ¼ green ton weight) Metric Tons (MT) = 2,204 lbs Metric Tons Carbon Equivalent (MTCO2e) = MTC X 44/12 (3.667) Credits based on this # Biomass volume generally calculated using allometric scaling equation 18 9
 Range (depends on site class, forest type) 25 (111) 16 32 14 (97) 7 22 16 (103) 11 23 16 (107) 7 45 16")
10 Stocks in Context Lower New England Ecoregional Supersection Lower New England Northern Appalachia Maine New Brunswick Foothills and Lowlands Central Maine & Fundy Coast & Ebayment Aroostook Hills and Lowlands White Mountains Common Practice Above Ground Carbon Mean in Metric Tonnes/acre (BA) Range (depends on site class, forest type) 25 (111) (97) (103) (107) (100) MTC/acre 16 MTC/acre 14 MTC/acre Lower New England Northern Appalachia Maine New Brunswick Foothills and Lowlands Central Maine & Fundy Coast & Ebayment Aroostook Hills and Lowlands White Mountains 25 (111) (97) (103) (107) (100) Maine Family Forest Carbon Project Data (12 landowners, 82 stands) Western, Central, & Eastern Maine Carbon Stocks in Typical Stands 20 10

 1 0.")
 to 0.99 (5 15 yrs) Smith et al. 2006 (Spr/Fir) 0.41 (125 yr mean) 0.26 (120 125 yrs) to 0.56 (5 15 yrs) Smith et al. 2006 (Oak Pine) 0.52 (125 yr mean) 0.")
11 3 to 4.7 times FIA Mean 25 MTC/acre Lower New England Northern Appalachia Maine New Brunswick Foothills and Lowlands Central Maine & Fundy Coast & Ebayment Aroostook Hills and Lowlands White Mountains 25 (111) (97) (103) (107) (100) MTC/acre 14 MTC/acre Data from: Keeton, W.S., A. A. Whitman, G.G. McGee, and C.L. Goodale. Forest Science December Late successional biomass development in northern hardwoodconifer forests of the northeastern United States. Forest Science. Mature = yrs; Old Growth= >150 yrs n=94 21 Study Brownfield OCSWCD Mean AGL (MTC/ac/yr) (100 yr mean) Range Maine C Accumulation Rates Maine FF Data 0.62 (50 yr mean) (range of means) Smith et al (Tol HW) 0.53 (125 yr mean) 0.23 ( yrs) to 0.99 (5 15 yrs) Smith et al (Spr/Fir) 0.41 (125 yr mean) 0.26 ( yrs) to 0.56 (5 15 yrs) Smith et al (Oak Pine) 0.52 (125 yr mean) 0.23 ( yrs) to 0.88 (15 25 yrs) 1 Multiply by for MTCO2e 2 USDA Forest Service GTR

12 Silviculture & Carbon improved forest management Greater within stand retention Uneven aged management (where appropriate) Set asides/reserve areas Extended rotation (even and uneven aged systems) 23 Silviculture & Carbon Nunery & Keeton, Forest carbon storage in the northeastern United States: net effects of harvesting frequency, post harvest retention, and wood products. Forest Ecology & Mgmt. Puhlick, J.J. et al., Long term influence of alternative forest management treatments on total ecosystem and wood product carbon storage. Canadian Journal of Forest Research 24 12
13 Structural Complexity Enhancement Treatment Target residual basal area (m 2 /ha) Max diameter (cm) q factor Structural objective Silvicultural prescription SCE /1.1/1.3 Re allocation of basal area to larger size class Rotated sigmoid diameter dist. High max d and target basal area Retention of trees >60 cm dbh Vertically differentiated canopy Growth acceleration of larger trees Single tree sel. with target diameter dist. Release advanced regeneration Full (three or four sided) and partial (two sided) crown release Elevated coarse woody material inputs for added structure Tree girdling/felling and leaving trees 25 Enhanced carbon storage through management for old growth characteristics in northern hardwood conifer forests Ecosphere Volume 8, Issue 4, 6 APR 2017 DOI: /ecs fig
 Proportion of forest area in Maine (7.")

14 Forest sector greenhouse gas emissions sensitivity to changes in forest management in Maine (USA) John S. Gunn and Thomas Buchholz Forestry, 2018 Area allocated to management type (%) Proportion of forest area in Maine (7.1 million ha) allocated to 7 management scenarios Set Aside Clearcut rotation 60 yr 100 yr Spruce plantation Uneven aged Heavy Harvest Shelter wood Scenario Baseline Double Set Aside Quadruple Set Aside yr Clearcut yr Clearcut Uneven aged Heavy Harvest Forest sector greenhouse gas emissions sensitivity to changes in forest management in Maine (USA) John S. Gunn and Thomas Buchholz Forestry, 2018 Uneven-aged 28 14

15 Moving C Stocks and Flows to the Offset Marketplace 29 California Air Resources Board (ARB) state agency charged with implementing California s cap and trade program (AB 32) since 2012 A 100 year commitment from the date of the last credit issuance annual monitoring and verification at least once every 6 years. % of buffer credits based on risk evaluation and is reduced by the use of a qualified easement 30 15

16 American Carbon Registry (ACR) v2.1 Climate Action Reserve (CAR) v3.3 Verified Carbon Standard (VCS) Description ACR is a non profit U.S. carbon market registry operated by Winrock International. Eligible forest offsets include: Afforestation/Reforestation Improved Forest Management Reducing Emissions from Deforestation and Degradation CAR is a voluntary carbon offset standard that grew out of the VCS was established in 2005 and offers standards and a registry California Climate Action Registry, system for creating verified carbon a voluntary carbon market credits throughout the world. created by the State of California in Eligible forest offsets include: Afforestation, Reforestation & Eligible forest offsets include: Re vegetation Improved Forest Management Improved Forest Management Reduced Emissions from Reforestation Deforestation and Avoided Conversion Degradation *40 year commitment period Currently, projects must be located in the U.S. but changes are being drafted to expand eligibility internationally. *20 year commitment period *100 year commitment period
17 Process for Developing a Carbon Offset Program/Buyer Research Project Identification Project Development $$$ Project Registration $ Verification $$ Credit Issuance Offset Sale Ongoing Monitoring and Verification $ 33 Transaction Costs It is not cheap to get a project to market Economy of scale Project developers/brokers willing to front transaction costs Make forest offsets expensive relative to other categories 34 17
18 Transaction Costs Category Transaction Costs Associated with Credits Traded Credit Transaction Costs Brokerage Fee Insurance Cost Description/examples cost per verified tonne associated with the issuance and transaction costs at the registry cost per verified tonne associated with finding a buyer using a brokerage service insurance premium in lieu of a buffer pool for first verification (periodic as well) 35 Transaction Costs Category Annual Costs Annual Reporting Costs Annual Membership Fee Post Project Monitoring Costs Associated with Monitoring Cycle Periodic Monitoring Cost Post Project Periodic Monitoring Costs Other Costs/Deductions Project Ending Costs Inventory Deduction Buffer Pool Description/examples internal time and registry fees registry fees internal field and office time Internal field and office time account closing fees e.g., if > ±10% of the mean at 90% confidence interval generally 20% of project credits 36 18

19 Revenue $/Credit Ecosystem Marketplace Summary Compliance vs. Voluntary Credit Volume Summary of transactions in forest sector 37 Market Volume and Prices 38 19
 Compliance (ARB) WI 29,087 852,630 29 Voluntary (VCS) PA 17,591 21,770 1 annually (100 year project) ex ante 6,384 VCUs annually and 370,301 Voluntary (VCS) PA 4,905 6,384 1 VCUs")
20 Volume Trends (voluntary) 39 Transaction Volume Examples Market State Acres Registered Tons Tons/acre Notes Voluntary (CAR) NH 2,141 69, NEFF (Hersey Mtn) Voluntary (CAR) NH 141,000 1,442, TFG (CT Lakes) Compliance (ARB) WI 29, , Voluntary (VCS) PA 17,591 21,770 1 annually (100 year project) ex ante 6,384 VCUs annually and 370,301 Voluntary (VCS) PA 4,905 6,384 1 VCUs total, after deduction of the 10% buffer. Compliance (ARB) ME 19, , Downeast Lakes Land Trust (Grand Lake Str.) Compliance (ARB) ME 1,460 36, Northeast Wilderness Trust (Alder Stream) 40 20

21 Making Sense of Costs and Revenue Understanding the amount and timing of transaction costs and potential revenue is fundamental to making the decision to engage in the marketplace. 41 Carbon Markets in Pine Oak Hemlock? 25 properties evaluated Property size and C stocking determined viability Not viable when under common practice baseline and under 12,000 acres 42 21


22 Forest Carbon Resources 43 John S. Gunn, Ph.D