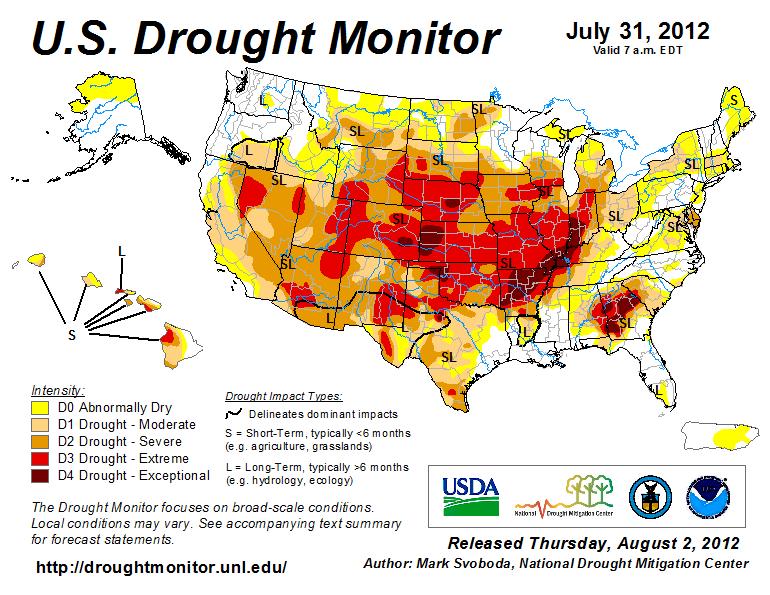
U.S. Drought Monitor, July 31, 2012
|
|
|
- Rudolf Welch
- 5 years ago
- Views:
Transcription

1 University of Nebraska - Lincoln DigitalCommons@University of Nebraska - Lincoln US Ag in Drought Archive Drought -- National Drought Mitigation Center -3-2 U.S. Drought Monitor, July 3, 2 Mark D. Svoboda National Drought Mitigation Center/University of Nebraska-Lincoln, msvoboda2@unl.edu Follow this and additional works at: Part of the Agricultural Economics Commons, Environmental Indicators and Impact Assessment Commons, Environmental Monitoring Commons, Hydrology Commons, Natural Resource Economics Commons, Other Environmental Sciences Commons, and the Water Resource Management Commons Svoboda, Mark D., "U.S. Drought Monitor, July 3, 2" (2). US Ag in Drought Archive This Article is brought to you for free and open access by the Drought -- National Drought Mitigation Center at DigitalCommons@University of Nebraska - Lincoln. It has been accepted for inclusion in US Ag in Drought Archive by an authorized administrator of DigitalCommons@University of Nebraska - Lincoln.
2
3
4 Iowa (8) Illinois () Nebraska (2) Minnesota (0) Indiana () Kansas (4) Ohio (4) South Dakota (4) Wisconsin (4) Missouri (3) Michigan (2) North Dakota (2) Texas (2) Colorado () Kentucky () North Carolina (<) Pennsylvania (<) Tennessee (<) United States Crop production percentages and associated drought intensities Approximate Percentage of Corn Located in Drought * July 3, * Drought percentages were calculated from U.S. Drought Monitor (USDM) data for the above date. More information on the USDM is available at Percent in Moderate Drought (D) Percent in Extreme Drought (D3) Percent in Severe Drought (D2) Percent in Exceptional Drought (D4) Agricultural Weather Assessments World Agricultural Outlook Board State contributions to national production (percentages in parentheses) are based upon National Agricultural Statistics Service (NASS) 5-year averages from 0-0. More information on NASS data can be found at
5
6
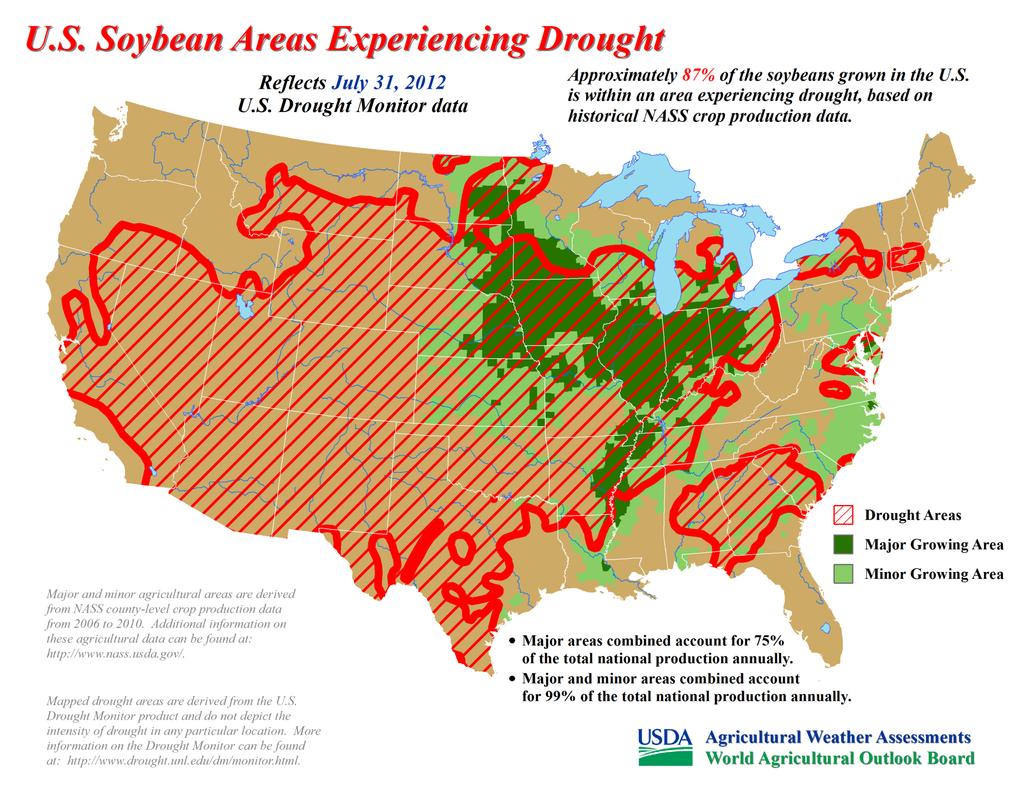
7 Iowa (5) Illinois (4) Minnesota (9) Indiana (8) Nebraska (8) Ohio () Missouri () South Dakota (5) Arkansas (4) Kansas (4) North Dakota (4) Michigan (3) Kentucky (2) Mississippi (2) Wisconsin (2) Louisiana () North Carolina () Tennessee () United States Crop production percentages and associated drought intensities Approximate Percentage of Soybeans Located in Drought * July 3, * Drought percentages were calculated from U.S. Drought Monitor (USDM) data for the above date. More information on the USDM is available at Percent in Moderate Drought (D) Percent in Extreme Drought (D3) Percent in Severe Drought (D2) Percent in Exceptional Drought (D4) Agricultural Weather Assessments World Agricultural Outlook Board State contributions to national production (percentages in parentheses) are based upon National Agricultural Statistics Service (NASS) 5-year averages from 0-0. More information on NASS data can be found at
8
9
10 Texas (8) Missouri () South Dakota () Kansas (5) Nebraska (5) North Dakota (5) Oklahoma (5) Kentucky (4) Montana (4) California (3) Minnesota (3) New York (3) Pennsylvania (3) Tennessee (3) Wisconsin (3) Arkansas (2) Colorado (2) Idaho (2) Iowa (2) Michigan (2) Ohio (2) Oregon (2) Virginia (2) Wyoming (2) Alabama () Georgia () Illinois () Indiana () Mississippi () North Carolina () Utah () Washington () United States Crop production percentages and associated drought intensities Approximate Percentage of Hay Located in Drought * July 3, * Drought percentages were calculated from U.S. Drought Monitor (USDM) data for the above date. More information on the USDM is available at Percent in Moderate Drought (D) Percent in Extreme Drought (D3) Percent in Severe Drought (D2) Percent in Exceptional Drought (D4) Agricultural Weather Assessments World Agricultural Outlook Board State contributions to national production (percentages in parentheses) are based upon National Agricultural Statistics Service (NASS) 0 Census of Agriculture data. More information on NASS data can be found at
11
12
13 Texas (5) Kansas () Nebraska () Oklahoma () California (5) Missouri (5) Iowa (4) South Dakota (4) Colorado (3) Kentucky (3) Montana (3) Wisconsin (3) Alabama (2) Arkansas (2) Florida (2) Idaho (2) Minnesota (2) New Mexico (2) New York (2) North Dakota (2) Pennsylvania (2) Tennessee (2) Virginia (2) Georgia () Illinois () Michigan () Mississippi () Ohio () Oregon () Washington () Wyoming () United States Animal inventory percentages and associated drought intensities Approximate Percentage of Cattle Located in Drought * July 3, * Drought percentages were calculated from U.S. Drought Monitor (USDM) data for the above date. More information on the USDM is available at Percent in Moderate Drought (D) Percent in Extreme Drought (D3) Percent in Severe Drought (D2) Percent in Exceptional Drought (D4) Agricultural Weather Assessments World Agricultural Outlook Board State contributions to the total national inventory (percentages in parentheses) are based upon National Agricultural Statistics Service (NASS) 0 Census of Agriculture data. More information on NASS data can be found at
14