Fred Bourland, University of Arkansas
|
|
|
- Jocelyn Cook
- 5 years ago
- Views:
Transcription


1 Fred Bourland, University of Arkansas Division i i of Agriculture


2 Variety Test Publications
3 Numbers! Numbers! Numbers! Interpreting ti Data on Cotton Varieties State 2009 No. of locations 2009 No. of entries Means per parameter (w/o across loc means) Missouri 3 Main = 36 or Tennessee 6 Main = Arkansas 4 4 Main = 31 New = Mississippi 5 Main = Delta 2 New = Mississippi - Hill 4 2 Main = 31 New = Louisiana 6 6 Early = 21 or 25 Mid = 16 or Total 32 diff. loc. 1199
4 Numbers! Numbers! Numbers! Interpreting ti Data on Cotton Varieties Number of Parameters: Arkansas Cotton Variety Test Loc Rep Parameter Observations per entry Means per entry (LY, HT, OB, SPA) (L%, SI, LI, FPS, Fden) (QS,Mic, Len, UI, Str, Elo) (Lpub, Spub, Btri) (TPB) 12 1 Total
5 Numbers! Numbers! Numbers! Interpreting ti Data on Cotton Varieties 3 zones (Eastern, Central, Western) ~ 30 locations per zone ~ 40 entries per location = ~3,600 means for each parameter 6 parameters * 3,600 = 21,600 means! Plus: Means across locations Additional parameters Usually 4 replications
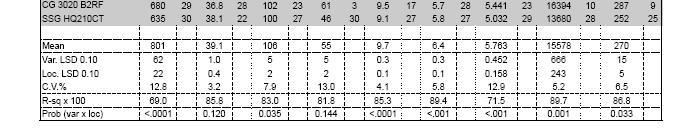
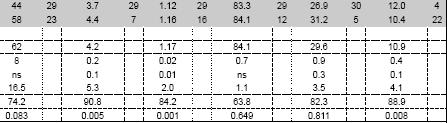
6 Yield and Yield Component Parameters Arkansas Cotton Variety Test, No. of Sign. (0.10) Sign. (0.10) Sign. (0.10) Parameter tests Variety effect Loc. effect Var. x Loc. Lint yield % 100% 100% Seed per acre % 100% 100% Lint % % 100% 63% Seed index % 94% 56% Lint index % 94% 50% Fibers per seed % 94% 56% Fiber density 6 100% 83% 50%
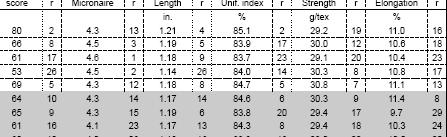
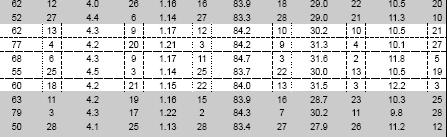
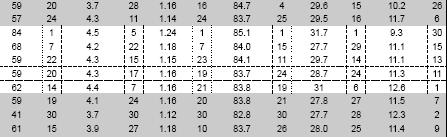
7 Maturity and Fiber Parameters Arkansas Cotton Variety Test, No. of Sign. (0.10) Sign. (0.10) Sign. (0.10) Parameter tests Variety effect Loc. effect Var. x Loc. Open bolls % % 94% 82% Plant height % 100% 44% Q-score 6 100% 33% 50% Micronaire % 94% 56% Length % 94% 38% Unif. Index % 81% 6% Strength % 81% 19% Elongation % 81% 38%
8 Variety x Location Interactions 1. Soil type Texture Surface/internal drainage; fertility 2. Diseases Verticillium wilt Root-knot nematode Reniform nematodes and other diseases 3. Insects Different technologies (various Bt s & non-bt) Insect infestations Varietal responses to insect pests 4. Mt Maturity Latitude of test site Variety differences in fruiting Stand/emergence consistency (different seed sources) 5. Management of test Irrigated or non-irrigated Timing of planting, irrigation, other inputs, defoliation Control of maturity (plant growth regulators)
9 Evaluation of Lint Yields Specific location adaptation: Examine test sites with similar soil texture, disease incidence, latitude, and irrigation status. Use multiple years (often limited). May have few similar sites. General (or wide) adaptation: Examine as many sites and years within broad area that are available. Year-to-year variation > site-to-site variation. May include non-similar sites and years, but cream-to-the-top.
10 Older Varieties Data Set - 3 years, (2 & 3 year data usually reported, these evaluated > 2 years, rank out of 20) Variety Lint yield, lb/a Keiser Judd Hill Marianna Rohwer DP 174 RF PHY 370 WR DG PHY 315 RF PHY 375 WRF AM 1550 B2RF DP 454 BG/RR, ck DP 393, ck PHY 485 WRF ST 5458 B2RF CG 3035 RF CG 3220 B2RF
11 Components of Yield Definitions Seed per acre = (Seedcotton yield * % seed)/seed index Seed index = seed size, weight of 100 seed. Lint index = weight of lint from 100 seed. Lint percentage = portion of lint in seedcotton. Fiber per seed = lint index / avg. weight of a fiber Fiber density = fibers per seed / seed size Seed per acre most closely related to lint yield. All other components are less affected by environment.
12 Using Components of Yield Most basic model: Yield = number of seed per acre * lint index Advantages of lint index over number of seed per acre : Gravimetric: ~1.6 lb of seed to produce 1 lb of lint. Energetic: 2.25x 25 as much energy to produce oil (seed) than cellulose (fiber). Increased reliance on lint index should enhance yield and yield stability. Therefore, among group of varieties with highest yield - choose ones with relative higher lint index.
13 Older Varieties Data Set: 1-year (2009) (Ranks out of 30) Variety Lint yield Open bolls Lint % Lint index Seed per acre Fibers per seed Fiber density DP 174 RF PHY 370 WR DG PHY 315 RF PHY 375 WRF AM 1550 B2RF DP 454 BG/RR, ck DP 393, ck PHY 485 WRF ST 5458 B2RF CG 3035 RF CG 3220 B2RF
14 Fiber Quality Traits Q-Score Q-score a fiber quality index of up to six HVI fiber quality parameters. Ranges from 0 to 100. Current weights used: Fiber length = 50 Micronaire = 25 Length uniformity = 15 Strength = 10 Research now underway to determine optimum weightings in relation to yarn quality


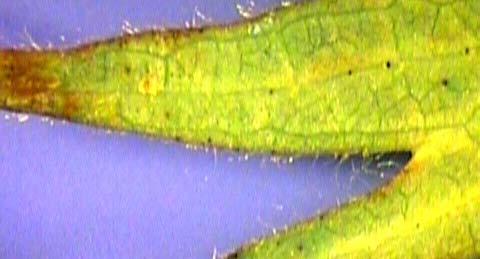
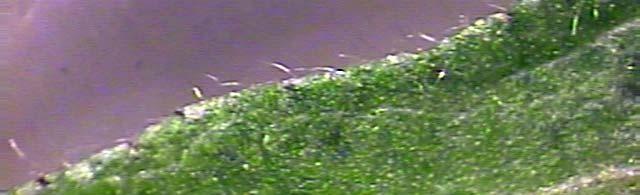
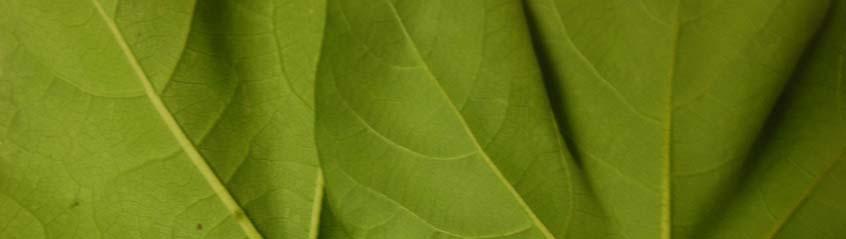
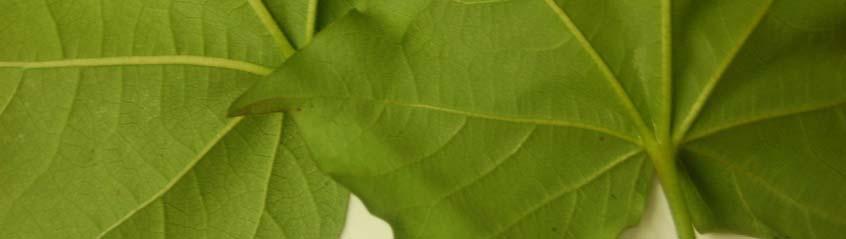
15 Fiber quality less trash Less leaf pubescence on smooth-leaf & semi-smooth smooth varieties Density of marginal bract trichomes varies among hairy and smooth leaf varieties.
16 Older Varieties Data Set: 1-year (2009) Lint yield, Q-score, Leaf pub, Bract tri. Variety rank/30 index rating rank/30 DP 174 RF PHY 370 WR DG PHY 315 RF PHY 375 WRF AM 1550 B2RF DP 454 BG/RR, ck DP 393 ck PHY 485 WRF ST 5458 B2RF CG 3035 RF CG 3220 B2RF


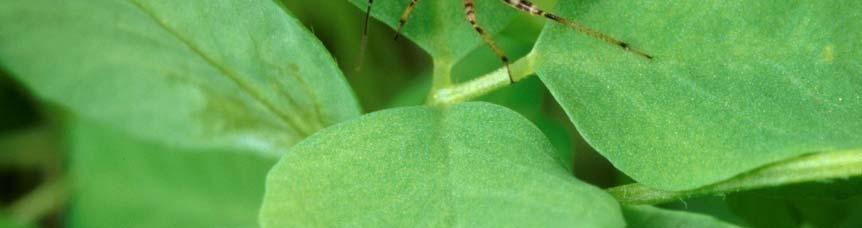
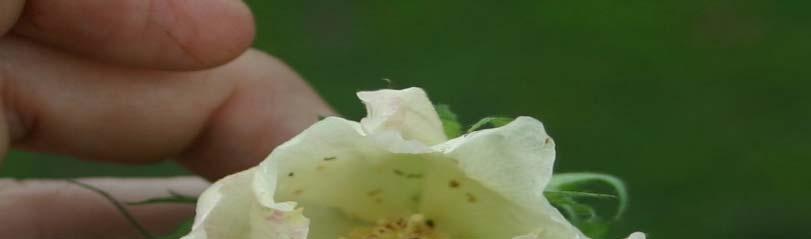
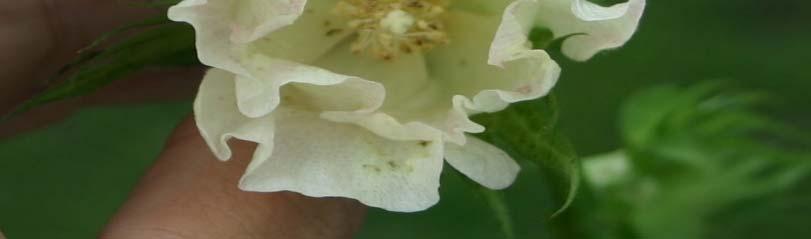
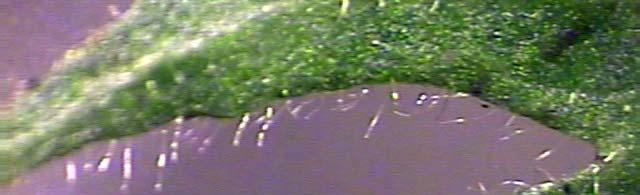
17 Tarnished plant bug, Lygus lineolaris (Palisot de Beauvois) Nectaried and nectariless leaves Damaged plants Damaged dirty flower
18 Use of Statistics Lint yield across locations, Ark. Cotton Variety Test, 2009 Significance level LSD Two types of errors: 1. Rejecting a true H 0 -Say that two means differ when they are actually equal. 2. Accepting a false H 0 -Say that two means are equal when they actually differ. Two types of mistakes: 1. Too slack ignore LSD & statistics 2. Too strict ignore trends.
19 Cotton Variety Test Results State Variety Tests: StateVarietyTrialData/ i COTVAR: On-line: p Summarizes data from all State Cotton Variety Tests 3 zones (Eastern, Central, Western) ~30 test t locations in each zone per year Other variety test summary programs from companies. Across company comparisons w/in company tests? Accuracy of state variety test data sets?
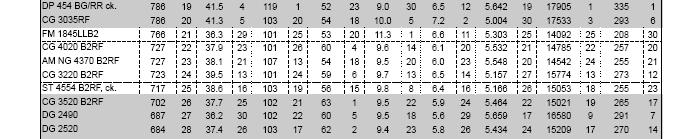
20 Using Components of Yield Most basic model: Yield = number of seed per acre * weight of fiber per seed. Increase of 5 mg fiber per seed -> 75 lb lint/a 5 mg fiber per seed = 0.5 g increase in lint index Lint index of cultivars varied from 5.0 to 7.8g in 2009 Arkansas Variety Test. Select high lint index -> large seed size. Select high h lint percentage -> small seed size. Now working on fiber density = number of fibers per unit of seed coat area. Among high yielding varieties, give priority to ones with high lint index rather than high seed per acre
21