REPORT. On contract research for. Mokgope Consulting ESKOM 765 KV NORTHERN ALIGNMENT PROJECT:
|
|
|
- Veronica Cook
- 5 years ago
- Views:
Transcription


1 REPORT On contract research for Mokgope Consulting ESKOM 765 KV NORTHERN ALIGNMENT PROJECT: SOILS AND AGRICULTURAL POTENTIAL FOR KRONOS-PERSEUS SECTION, NORTHERN CAPE AND FREE STATE PROVINCES By D.G. Paterson Report Number GW/A/2013/xx March 2013 ARC-Institute for Soil, Climate and Water, Private Bag X79, Pretoria 0001, South Africa Tel (012) Fax (012)
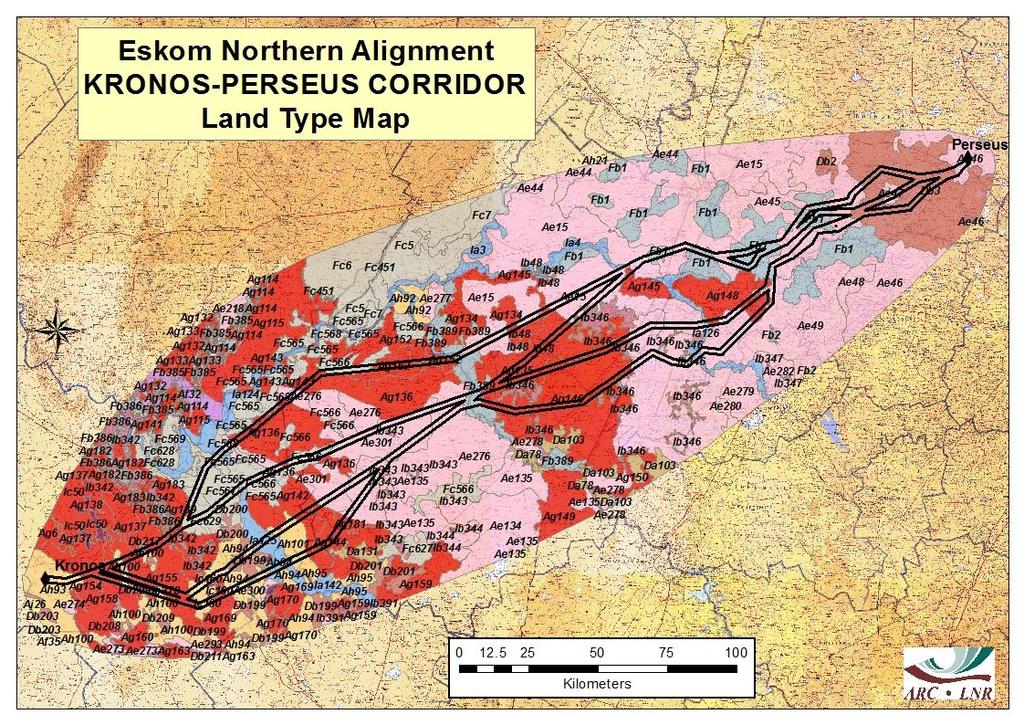
2 CONTENTS Page 1. TERMS OF REFERENCE 3 2. STUDY AREA CHARACTERISTICS Terrain Climate Parent Material METHODOLOGY SOILS AGRICULTURAL POTENTIAL Alternative Alternative Alternative Deviations IMPACTS REFERENCES APPENDIX: LAND TYPE MAP 2
3 1. TERMS OF REFERENCE The ARC-Institute for Soil, Climate and Water (ARC -ISCW) was contracted by Mokgope Consulting to undertake an investigation of the soils and associated agricultural potential for a proposed transmission line ( Northern Alignment ) between the Juno substation, near Vredendal (Western Cape), across the Northern Cape to the Perseus substation, near Dealesville (Free State Province). The objectives of the study are; To classify the soils and to produce a soil map of the specified area To assess the broad agricultural potential Site-specific surveys and analysis (classification and ranking of impacts per alternative). The route is divided into four sections. This report deals with the section between the Kronos substation, near Copperton (Northern C ape Province), and the Perseus substation, near Dealesville as shown in Figure 1. There are three different alternatives within this Section, namely the southernmost Alternative 1 (shown in blue), the central Alternative 2 (shown in pink) and the northernmost Alternative 3 (shown in green). The relative positions of the three Alternatives are shown in Figure 2. In addition, four deviations of varying lengths were identified for various reasons, namely a very short Deviation 1A (shown in yellow), close to the Perseus substation; a short Deviation 1B (shown in red), slightly to the north of Alternative 1; a longer Deviation 1C (shown in black), to the south of Alternative 1; and Deviation 1D (shown in white), to the north of Alternative 1 at the western end. 3

4 Figure 1 Kronos-Perseus Section: Alternatives 4

 River and the Riet River (the Brak River in the south-west is smaller and not perennial).")
5 2. STUDY AREA CHARACTERISTICS 2.1 Terrain The corridor crosses generally flat to slightly undulating terrain, with virtually no areas of steeper topography, except for the Doringberge, south of Prieska. The altitude varies between 1050 and 1250 metres above sea level, becoming higher towards the east. There are only two large rivers along the route, namely the Gariep (Orange) River and the Riet River (the Brak River in the south-west is smaller and not perennial). Several pans occur in the eastern portion of the route. 2.2 Climate Figure 2 Rainfall map of Northern Alignment route The climate of the Kronos-Perseus section (shown in yellow in Figure 2), can be classified as dry, with hot summers and cool, occasionally cold winters. On 5
6 the map it can be seen that the long-term average rainfall is low (between 200 and 400 mm per annum), but that the rainfall increases to between 400 and 500 mm per annum at the eastern end of the section. Temperatures show little variation. The figures vary between an average monthly maximum and minimum of 27-31ºC and 13-15ºC for January and 5-10ºC and o C for July respectively, with annual evaporation figures of between and mm per year (ARC-ISCW, 2012). Frost will occur in winter throughout the area, especially as the altitude increases. 2.3 Parent Material The parent material of the Kronos-Perseus area (Geological Survey, 1984) largely comprises of shale of the Tierberg Formation, along with Quaternary alluvium. Dolerite intrusions also occur in places. 3. METHODOLOGY ArcGIS shape files of the route alternatives were provided, and a buffer zone, 5 km outside all of the routes, was created to represent the study area. The area is covered mainly by the national land type survey (Land Type Survey Staff, ). The soils were classified (MacVicar et al, 1977) and the soils were grouped into map units, called land types. Each land type is a unique combination of soil pattern, terrain and macroclimate. This information was digitized in ArcGIS and the land type boundaries are shown on the map in the Appendix. 6
7 4. SOILS The information contained in the land type survey is of a reconnaissance nature (1: scale) and as such can only represent the dominant soils within a specific land type. It is to be expected that areas of different soils will occur, but due to the nature and scale of the survey, they can not be delineated in detail. Due to the prevailing climatic restrictions (Section 2.2), the various l and type mapping units occurring within the study area were grouped by their overall broad soil pattern. The general soil characteristics are given in Table 1 below (the colours correspond to the map units on the map in the Appendix). The soils were classified according to MacVicar et al. (1977). 7
8 Table 1 Broad Soil Pattern Ae Ag Ah Da Db Fb Fc Ia Ib Broad soil patterns occurring in the Aries-Kronos section of the Northern Alignment route Description and main soil characteristics Dominant soil forms Red, freely-drained, mostly structureless soils, not highly weathered, often calcareous. Depth will vary from shallow (<300 mm) to deep (>1200 mm). Some surface rock/calcreete may occur in places Red, freely-drained, mostly structureless soils, not highly weathered, usually calcareous. Depth is diagnostic dominantly shallow (<300 mm). Some surface rock/calcrete/dorbank may occur in places, occasionally plentiful. Red and yellow, freely-drained, mostly structureless soils, not highly weathered, often calcareous. Depth is usually at least moderately deep (>800 mm). Soil texture is diagnostic sandy (<15% clay). Red duplex soils (where a relatively sandy topsoil overlies (often abruptly) a subsoil clay layer). Soils are often saline and/or sodic, with extensive low-lying areas in the landscape. The soils are also susceptible to erosion if disturbed. Non-red duplex soils (where a relatively sandy topsoil overlies (often abruptly) a subsoil clay layer). Soils are often saline and/or sodic, with extensive low-lying areas in the landscape. The soils are also susceptible to erosion if disturbed. Mixed soil pattern, usually shallow (<450 mm), with some lime in parts of t the landscape. Surface stones and rock outcrops may occur extensively in places. Soil texture and colour will vary, usually reddish-brown, sandy/loamy soils. Mixed soil pattern, usually shallow (<450 mm), with regular lime throughout the landscape. Surface stones and rock outcrops may occur extensively in places. Soil texture and colour will vary, usually reddish-brown, sandy/loamy soils. Deep alluvial deposits, usually in low-lying positions, including river floodplains. Soil textures and colours will vary (dependant on depositional mechanisms), but soils are often saline and/or sodic. Much surface rock outcrops (diagnostic >60% of the landsc ape). Terrain is often steeper than surrounding areas, with shallow (<300 mm) soils, usually reddish - brown, not highly weathered, sandy/loamy. Dominant potential soil Hutton, Mispah Low to high (depth dependent) Hutton, Mispah Low (shallow depth) Hutton, Clovelly Estcourt, Sterkspruit, Valsrivier, Swartland Estcourt, Sterkspruit, Valsrivier, Swartland Mispah, Hutton Mispah, Hutton Oakleaf, Swartland Mispah, Hutton Glenrosa, Glenrosa, Valsrivier, Glenrosa, Moderate (sandy texture, very free drainage) Low (erodible, saline) Low (erodible, saline) Low (shallow, often stony) Low (shallow, often stony) Low to moderate (often saline) Very low (rock with shallow soils) 8
9 From the table above and the map in Appendix 1, it can be observed that the majority of the routes in this section cross a mixture of Ag and Fb soil patterns (shallow soils), along with Ae soils (deeper) and Db soils (clayey duplex soils). 5. AGRICULTURAL POTENTIAL Most of the soils in the area are shallow, with only limited zones with deeper soils. However, despite potentially favourable soils for cultivation occurring in places, the over-riding restriction is the climatic limitation of the low rainfall and high evaporative loss from the soil surface (S ection 2.2). This means that the only potential means of cultivation is by irrigation, and the soils and potential irrigation water are likely to be somewhat saline. 5.1 Alternative 1 (Southern) This alternative crosses a mixture of soils. The only soil patterns where deeper soils might be expected would be the Ae, Ah, Db (clayey) and Ia zones, which occur mainly in the central and eastern parts. Two significant areas of cultivation (mainly irrigation) occur close to the Gariep and Riet Rivers (as shown by the blue circles on the map in the Appendix). 5.2 Alternative 2 (Central) Similar to Alternative 1, this alternative crosses a mixture of soils. The only soil patterns where deeper soils might be expected would be the Ae, Ah, Db (clayey) and Ia zones, which occur mainly in the central and eastern parts. Two significant areas of cultivation (mainly irrigation) occur close to the Gariep and Riet Rivers (as shown by the blue circles on the map in the Appendix). 5.3 Alternative 3 (Northern) This alternative also crosses mainly shallow soils in the west, with deeper soils in places in the east. The only soil patterns where deeper soils might be 9
10 expected would be the Ae, Ah, Db (clayey) and Ia zones, which occur mainly in the central and eastern parts. Three significant areas of cultivation (mainly irrigation) occur, close to the Gariep and Riet Rivers (as shown by the blue circles on the map in the Appendix). The dryland (rain-fed) agricultural potential of the whole study area is thus very low. In the far eastern end of the route, despite the somewhat increased rainfall, there is little evidence of widespread cultivation, which only becomes evident to the east of Dealesville. The impact of a transmission line (with a comparatively small footprint) will be comparatively small. 5.4 Deviations At the scale of the available soil information (1: ), the relatively short deviation routes of Deviation 1A and Deviation 1B will not make a significant difference to the impacts of any of the alternative routes. Both Deviation 1C and Deviation 1D are longer, but run parallel to Alternative 1 and cross virtually the same broad soil types in more or less the same proportion. Therefore, the impacts will again be very similar. 6. IMPACTS There will be two main possible impacts. Firstly, the loss of agricultural soil due to the construction of the transmission line (mainly the pylon sites), as well as a parallel adjacent access road. Mitigation: avoid, wherever possible, any areas of cultivation, especially areas under irrigation, such as alongside streams/rivers. The second potential impact will be the possibility of increased soil erosion due to the loss of surface vegetation and the exposure of bare soil at the surface, again caused by construction activities. This could take the form of removal by 10
11 wind erosion (especially in areas where the topsoil texture is fine and sandy) or by water erosion (this will be limited to stream beds and watercourses, but such flash flooding events, though rare, may be severe). Mitigation: ensure that:- the minimum amount of vegetation is removed; great care is taken where the transmission line crosses any stream or river course, so that damage to the river banks or adjacent areas is not caused. that all possible soil conservation measures (culverts, run -off channels etc) are implemented in the construction of access roads (especially in sloping areas; regular monitoring of pylon sites and access roads is done to ensure no worsening of soil erosion. The impacts can be summarized as follows: 11
12 Table 2.1 Kronos-Perseus Section: Route Alternative 1 and Deviations 1C and 1D Impact Status Magnitude Reversibility Extent Duration Probability Significance Loss of agricultural soil Increased soil erosion No Mitigation With Mitigation No Mitigation With Mitigation Table 2.2 Kronos-Perseus Section: Route Alternative 2 Impact Status Magnitude Reversibility Extent Duration Probability Significance Loss of agricultural soil Increased soil erosion No Mitigation With Mitigation No Mitigation With Mitigation Table 2.3 Kronos-Perseus Section: Route Alternative 3 Impact Status Magnitude Reversibility Extent Duration Probability Significance Loss of agricultural soil Increased soil erosion No Mitigation With Mitigation No Mitigation With Mitigation Significance = Status x (Magnitude + Reversibility + Extent + Duration) x Probability 12
13 From the information contained in Table 2, as well as the Soil Map (Appendix), it can be seen that for most of the corridor, the three alternative routes cross similar soil patterns. There is therefore little to choose between the three alternatives as far as soils and agricultural potential is concerned. The two proposed crossing places for the Gariep River appear to have poor soils which are not cultivated, but at the Riet River, the southern crossing (Alternative Route 1 and Deviations) would appear to have the possibility of more irrigated areas in the immediate vicinity than the northern crossing (Alternative Routes 2 and 3). The conclusion is therefore: Recommended: Route Alternative 2 or 3 (equally) Least Recommended: Route Alternative 1 and Deviations 1C and 1D 13
14 REFERENCES ARC-ISCW, Agroclimatology database. Agricultural Research Council- Institute for Soil, Climate and Water, Pretoria Geological Survey, : 1 million scale geological map of South Africa. Department of Mineral and Energy Affairs, Pretoria. Land Type Survey Staff, : scale Land Type Survey of South Africa. Agricultural Research Council-Institute for Soil, Climate and Water, Pretoria MacVicar, C.N., De Villiers, J.M., Loxton, R.F., Verster, E., Lambrechts, J.J.N., Merryweather, F.R., Le Roux, J., Van Rooyen, T.H. & Harmse, H.J. von M., Soil classification. A binomial system for South Africa. Dept Agricultural Technical Services, Pretoria. 14
15 APPENDIX: LAND TYPE MAP 15
16 16