Assessing hydrologic and salinity thresholds driving ecosystem transition at Alligator River National Wildlife Refuge
|
|
|
- Lilian Wilkerson
- 5 years ago
- Views:
Transcription
1 Assessing hydrologic and salinity thresholds driving ecosystem transition at Alligator River National Wildlife Refuge John King, Asko Noormets, Jean-Christophe Domec Department of Forestry and Environmental Resources North Carolina State University Raleigh, NC Managing Forested Wetlands with Fire in a Changing Climate USDA Forest Service Joint Fire Sciences Program Symposium USFWS Alligator River National Wildlife Refuge Manteo, NC November, 2013
2 Outline Scientific interest/rationale Forested wetland C cycling monitoring at ARNWR Rationale Project description, methods and team Comparison with LCP pine forests Moving forward Effects of hydrology and salinity on ARNWR ecosystem transition Rationale Select ecosystems to monitor Methods and timeline The future
3 Scientific interest Tree Physiology and Ecosystem Science Lab at NCSU Forest ecophysiological responses to land use, management and environmental change -Integrate molecular-cellular-plant-ecosystem-landscape-regional scales through measurements and models Investigations include: -Tree physiology and forest productivity -Land-atmosphere exchanges of carbon (C), water and energy -Carbon storage and cycling in plant biomass and soils -Water use (efficiency) of managed and natural ecosystems -Changes in availability of key limiting resources: nutrients, temperature, water, and light -Feedback of tree responses to ecosystem function and biogeochemical cycling

4

5 Rationale Wetland soils contain globally significant C reserves o 2-3% of land area o 18-30% of total global soil organic carbon o Soil carbon residence time: ~500 years But poorly represented in global assessments of C cycling From: NASA, 2010.
 Dead bimss (t C ha -1 ) SOC (t C ha -1 ) Total forest (t C ha -1 ) Regional (10 9 t C) Loblolly-shortleaf 50.4 21.3 91.7 163.4 3.48 Oak-pine 56.9 26.5 82.3 165.")
6 Soil organic C (SOC) is highest along the lower coastal plain Table 1. Timberland biomass C densities for selected forest cover types of the eastern United States in From Heath et al. (2003). Forest type Live biomass (t C ha -1 ) Dead bimss (t C ha -1 ) SOC (t C ha -1 ) Total forest (t C ha -1 ) Regional (10 9 t C) Loblolly-shortleaf Oak-pine Longleaf-slash Oak-gum-cypress From: Johnson and Kern, 2003.

7 NC has ~5,200 km 2 < 1 m elevation and the sea is rising From: USFWS ARNWR, 2005.


8 Source: DOD, 2010.

9 Our site at ARNWR is part of a global C monitoring network: Long-term climate change observatory
10
11 GPP NPP(δ 13 C) δ 13 CO2 ERs NEE Monitoring C cycling in forested wetlands SRs (δ 13 CO2) Vadose zone Seasonal high GWT Seasonal low GWT DOC/DON (δ 13 C,δ 15 N)

12 Field site next to Milltail Creek, DCBR


13 Eddy covariance flux tower

14 14


15 Highly variable micro-topography 15
16 Trop. Storm Ida Hurricane Earl Trop. Storm Nicole Hurricane Irene Constantly fluctuating water table


17 One storm + one $50,000 instrument = one $10,000 repair bill 17


18 Microtopography survey At 5 survey plots All the heights were normalized relative to the groundwater probe location at micrometeorology station. Measure height in 40 cm interval 30-m transect 18

19 Microtopography survey Gamma distribution Site average elevation: 8.7 cm Used to separate flooded and non-flooded conditions in the ecosystem scale. 60% HIGH, 23% MID, 17% LOW Used to upscale soil respiration. 19

20 Simulated flood using DEM

21 Annual allometric estimation of over story tree and under story biomass and NPP


22
")

23 Decomposition of coarse woody debris (R CWD ) Four decay classes (1-4) Decay class 2 Decay class 3 23

24 These forested wetlands are a small but consistent C sink: g C m -2 y -1

25 Mid-rotation loblolly pine tower: Mean annual GEP (g C m -2 y -1 ) Mean annual ER Mean annual SR Mean annual NEE Rh > litter fall by 109 g C m -2 y -1
26 Table 2. Comparison of the unmanaged forested-wetland at Alligator River NWR to the intensively managed (drained, fertilized, thinned) loblolly pine plantations on former forested-wetland sites. Alligator River forested wetland 2009, 2010, 2011 Mature loblolly pine & (US-NC2) Young loblolly pine & (US-NC1) NEE (g C m -2 yr -1 ) +45, -113, ER (g C m -2 yr -1 ) 1397, 1681, GEP (g C m -2 yr -1 ) 1167, 1797, SR (g C m -2 yr -1 ) ~ SR:ER ~ NPP (g C m -2 yr -1 ) AR not adjusted for mortality yet ET (mm yr -1 ) 791, 983, LAI (m 2 m -2 ) GEP:LAI ~ ~577 Variable from year to year

27 Assessing transition thresholds at ARNWR
28 Table 2. Major ecosystem types to be monitored at the ARNWR Climate Change Observatory Ecosystem Transition transects. Ecosystem Dominant species Location Soils Environment Brackish marsh Juncus roemerianus Spartina patens Shoreline Anaerobic muck Brackish Saline Phragmites australis Freshwater marsh Typha sp. Very near shore Organic muck Freshwater Low shrub pocosin Ilex glabra Lyonia lucida Cyrrila racemiflora Near shore Organic muck Freshwater Pond Pine pocosin Pinus serotina Magnolia virginiana Persea borbonia Mixed pine-hardwoods Pinus taeda Quercus rubra Liquidambar styraciflua Forested wetland Taxodium sp. Nyssa sp. Acer rubrum Near shore Interior Interior (flux tower) Riparian Organic muck or histic-mineral Mineral or histic-mineral Organic muck Freshwater Freshwater Freshwater
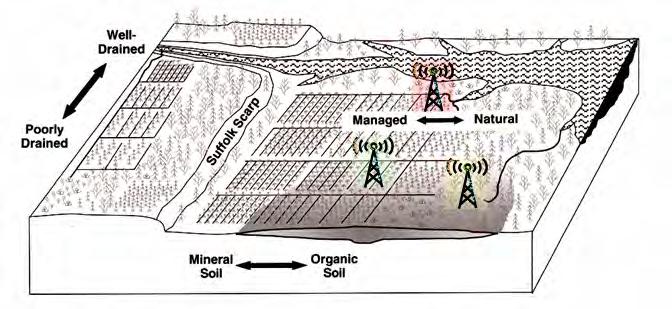
29 Habitat change wedge (a la Dennis Stewart) Determine thresholds of hydroperiod and salinity leading to ecosystem transition
30 Measurements Species composition Above- and belowground plant biomass and C Physiological performance: photosynthesis, stomatal conductance, transpiration, chlorophyll flourescence Soil organic carbon content, density fractionation, isotopic signature Ground water table dynamics Soil water content and salinity Marsh soil accretion/loss
31 The Future Incorporate fire? Ecosystem to landscape scale model development and linkage Expansion of eddy covariance studies across the Refuge Team building and collaboration Public interface


32

33 Public outreach *Workshop at ARNWR HQ -Present summary of scientific understanding of climate change and SLR -Describe research projects at ARNWR and elsewhere *Climate change driving tour at Refuge -Visit ecosystem transition sites -Posters/photos of before and after *Open discussion and solicitation of perspectives from public

34 Acknowledgements Students and staff who work so hard in the lab! ARNWR for in-kind support and scientific collaboration US Dept of Agriculture US Dept of Energy US Forest Service Weyerhaeuser Corporation Bayer CropSciences Corporation US Dept of State Fulbright Program International Francqui Foundation USGS Southeast Climate Science Center Carolinas Integrated Sciences and Assessment