Mapping the Current and Future Supply and Demand of Ecosystem Services in the Carolinas. Katie Warnell, Lydia Olander, & Jill Hamilton
|
|
|
- Vincent Merritt
- 5 years ago
- Views:
Transcription


1 Mapping the Current and Future Supply and Demand of Ecosystem Services in the Carolinas Katie Warnell, Lydia Olander, & Jill Hamilton

2 What are ecosystem services? the benefits that flow from nature to people, for example, nature s contributions to the production of food and timber; life-support processes, such as water purification and coastal protection; and life-fulfilling benefits, such as places to recreate or to be inspired by nature s diversity -National Ecosystem Services Program guidebook


3 Why are ecosystem services useful? Survey identified landowners priorities for ecosystem services Spatial analysis mapped ecosystem service distribution and identified priority areas for conservation and restoration for each service Olander et al. 2017

 Capture information on actual use of")
4 Mapping ecosystem services Considerations for mapping analyses: Publicly available data and nonproprietary methods Methods are easily updateable not overly data- or computationallyintensive Large spatial extent (10 state region initially, scalable nationally) Capture information on actual use of service
5 Current status of ES mapping analyses Analysis Native pollination potential Recreational birding Reduction of inland flood exposure Water purification Bird species richness Reduction of coastal vulnerability Green space recreation Marine fishing Status Complete Complete Finalizing Complete Complete In progress In progress In progress


6 Mapping supply and demand for ES: pollination demand: pollinatordependent crops supply: native pollinator habitat


7 Mapping supply and demand for ES: pollination


8 Identifying opportunities for restoration and conservation
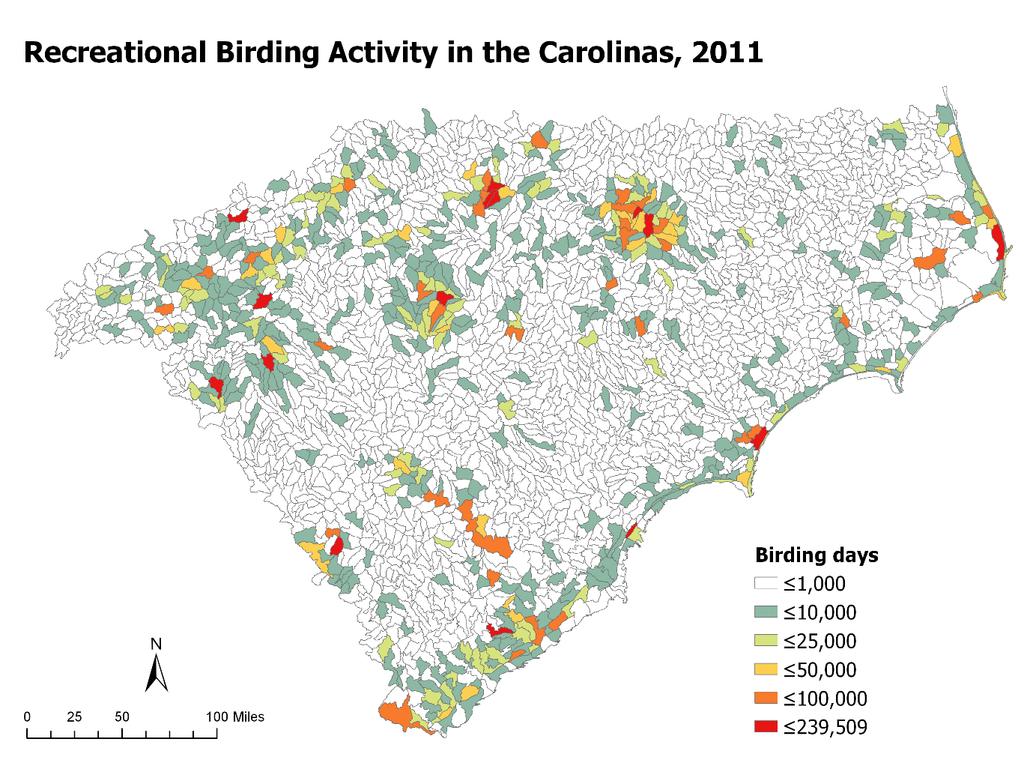


9 Recreational birding

10 Coastal vulnerability InVEST model: coastal vulnerability Index-based, assesses relative vulnerability of shoreline segments to coastal storms Arkema et al explored the influence of coastal habitats in mitigating risk by running model with and without these habitats Currently updating this analysis for the southeast (Atlantic and Gulf coasts) Arkema et al. 2013
 Soil hydraulic conductivity Slope Natural land cover Impervious surface cover")
11 Inland flood exposure and vulnerability Adapted InVEST coastal vulnerability model to assess relative potential for inland river flooding driven by precipitation Variables included: Elevation above nearest waterway Precipitation intensity (2-day duration, 5-year return interval) Soil hydraulic conductivity Slope Natural land cover Impervious surface cover preliminary

12 Inland flood exposure and vulnerability Flood Exposure Index Performance for NC & SC Flood events, (n=336) 35% 30% 25% 1.3 million people in high flood potential area in NC and SC 20% 15% 10% Potential for river flooding 5% 0% Flood Exposure Index Score (highest) preliminary


13 Future changes in ecosystem services Climate change Population growth Ecosystem Services Land use change


14 Next steps: Adding future changes Projected development: FUTURES model Downscaled climate projections Meentemeyer et al MACA mean winter temperature, , RCP 4.5, multi-model mean Abatzoglou & Brown 2012


15 Next steps: Integration into planning efforts Conservation Blueprint

16 Questions? Advisors: Ken Bagstad, USGS Jim Clark, Duke University John Fay, Duke University Christoph Hellmayr, Duke University Christa Kelleher, Syracuse University Wenhong Li, Duke University Sara Mason, Duke University Rua Mordecai, South Atlantic LCC Amanda Schwantes, Duke University Derek van Berkel, EPA Students: Jessica Coulter Isabel Hillman This project is supported The Department of the Interior Southeast Climate Adaptation Science Center, which is managed by the USGS National Climate Adaptation Science Center.