The Effects of Tree Thinning on Wildlife in Piñon-Juniper and Ponderosa Pine Woodlands in the Manzano Mountains, New Mexico
|
|
|
- Corey Ward
- 5 years ago
- Views:
Transcription

1 The Effects of Tree Thinning on Wildlife in Piñon-Juniper and Ponderosa Pine Woodlands in the Manzano Mountains, New Mexico David Lightfoot, Cody Stropki, Victoria Amato, Conor Flynn and Anne Russell SWCA Environmental Consultants Albuquerque NM Presented to the Society for Ecological Restoration, Southwest Chapter, Las Vegas, NV, November 10, 2016 Piñon mouse (Peromyscus truei)
2 Estancia Basin Watershed Health Restoration and Monitoring Project, Central New Mexico Private lands forest watershed restoration program funded by the New Mexico Water Trust Board, overseen by the Estancia Basin Watershed Health Restoration and Monitoring Steering Committee: Claunch-Pinto, East Torrance, & Edgewood Soil and Water Conservation Districts, New Mexico Forest and Watershed Restoration Institute, New Mexico State Forestry, New Mexico Environment Department. Forest tree thinning to reduce high levels of trees and wildfire fuels, and to restore forest watershed function and health, including wildlife. SWCA Environmental Consultants conducting effectiveness monitoring designed to verify the objectives of forest thinning restoration treatments on: hydrology, soils, vegetation, and wildlife.

3 Estancia Basin Watershed Health Restoration and Monitoring Project , ongoing. 5,800 acres of private lands treated to date. Tree thinning prescriptions and inspections by New Mexico State Forestry. Adjacent to similar tree thinning projects by Cibloa National Forest on USFS lands. Goal to create large-scale landscape thinning through cumulative smaller projects over time.
4 Experimental Monitoring Approach to Evaluate Forest Thinning Effects Purpose/objectives: Evaluate effectiveness of tree thinning treatments relative to achieving restoration objectives. Questions: Does prescribed tree thinning affect: Remaining tree health and productivity? Vegetation and wildlife diversity and productivity? Watershed soil infiltration and yield? Soil surface stability? How do ponderosa pine and piñon/juniper woodland responses compare? Methods: 4 particular sites chosen for standard thinning & experimental monitoring. Determine baseline pre-treatment conditions for soils, hydrology, vegetation and animals; = 3 years baseline data. (Before/After/Control/Impact (BACI) experimental design) Impose forest thinning treatments; winter 2010 / 2011, chain saws and chipper, (following New Mexico State Forestry prescriptions for the watershed) and measure responses of soils, hydrology, vegetation and wildlife over time.


5 Land Ownership Study Site Locations Vegetation Type Private lands only (funding) Ponderosa and piñon/juniper (SWReGAP land cover types)


6 Paired Watershed Study Design Attempt to control for factors other than thinning Paired sub-watersheds, one thinned, one left alone as control (treatment selection random) Paired measurement plots; similar soils, topography, vegetation. Relatively level topography chosen.

 productivity (relative abundance),")
7 Variables Measured Weather precipitation temperature Soils moisture erosion, surface stability soil minerals and organic matter Hydrology surface runoff ground-water recharge Vegetation (to the species level) productivity (cover) diversity fuel loads invasive species Wildlife (species; birds, rodents, large mammals) productivity (relative abundance), diversity (species)
; soils, vegetation.")
 protocols and plots; tree density and canopy structure (in above too).")
8 Monitoring Methods and Protocols (project developed in 2007) 1. USDA-ARS rangeland monitoring protocols and study plot layout (2005); soils, vegetation. Integrates various soils, hydrology and vegetation measures with monitoring USDA Forest Service Inventory and Analysis (version 3, 2003) protocols and plots; tree density and canopy structure (in above too) Specific literature sources; hydrology, animals, and some aspects of soils.
9 Study Plots/Subplots Vegetation/soils subplot diagram soils and vegetation measures Tree measurement subplots (overlaid on soils and veg subplot lines) Source: USDA-ARS Monitoring Manual, 2005.
10 Study Subplots Animal subplot diagram bird point counts rodent trapping grid vegetation sampling points Bird obs. point 50 m Rodent traps: 36 traps, 6 by 6 grid, 10m intervals 10 m 50 m

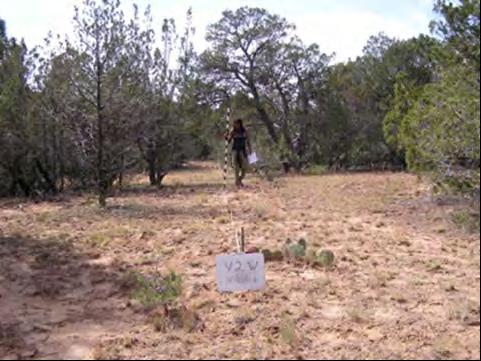
11 Example Study Site (Vigil PJ) Paired watersheds, flumes. Watersheds 3-5 acres each. Paired measurement plots. Soils, vegetation. Wildlife, vegetation. Control and Treatment plots ~ 100 m apart. Paired mini-met stations. Both grazed equally by livestock.


12 Piñon-Juniper study sites treated winter 2010/2011; Repeat Photo Points Kelly pre-treatment 2010 Kelly Treated 2011 Kelly Treated 2015 Average basal area reduction 86 sq.ft./acre to 48 sq.ft./acre Vigil pre-treatment 2010 Vigil Treated 2011 Vigil Treated 2015 Average basal area reduction 68 sq.ft./acre to 41 sq.ft./acre

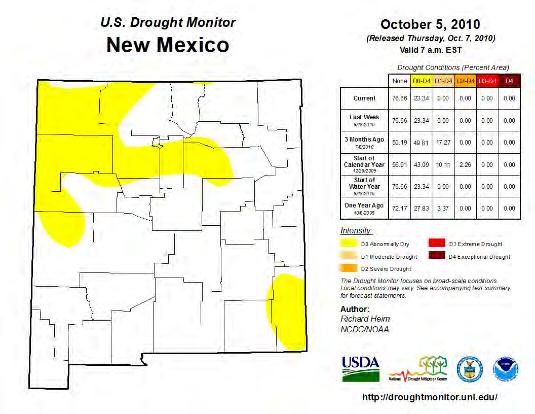
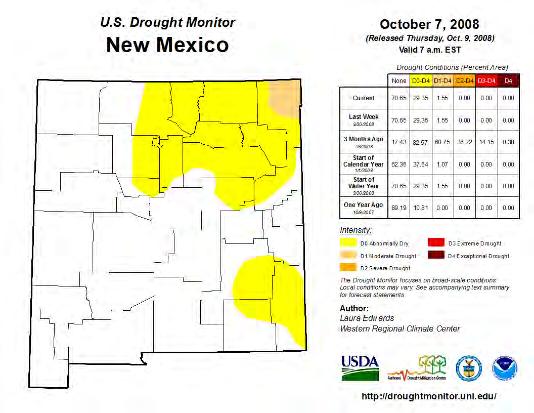
13 Weather Conditions: Temporal Context Tree Thinning Winter 2010/ Prethinning Postthinning

14 Precipitation Precipitation averaged over all 8 weather stations declined during drought, at the time of thinning treatments; major drought Automated met station on each plot continuous recording year-round; Ambient temp. Precipitation Soil moisture -10cm Soil temperature -10cm Red arrow = time of thinning treatments
15 Ambient Temperature Average annual temperatures over all 8 weather stations increased over the study period coincident with 2011, 2012 drought, then declined as the drought subsided.


16 Soil Water Content TDR, 0-10cm, 12/plot, Monthly Mulching effect? Reduced tree root uptake?


17 Wood Chip Cover - redistribution, decomposition 1m 2 quads, 36/plot Kelly PJ 2011 Vigil PJ 2014


18 Size classes of piñon/juniper trees on the control and treatment plots in 2015 (Diameter at Root Crown) Thinning targeted small diameter trees All trees permanently tagged, measured each year

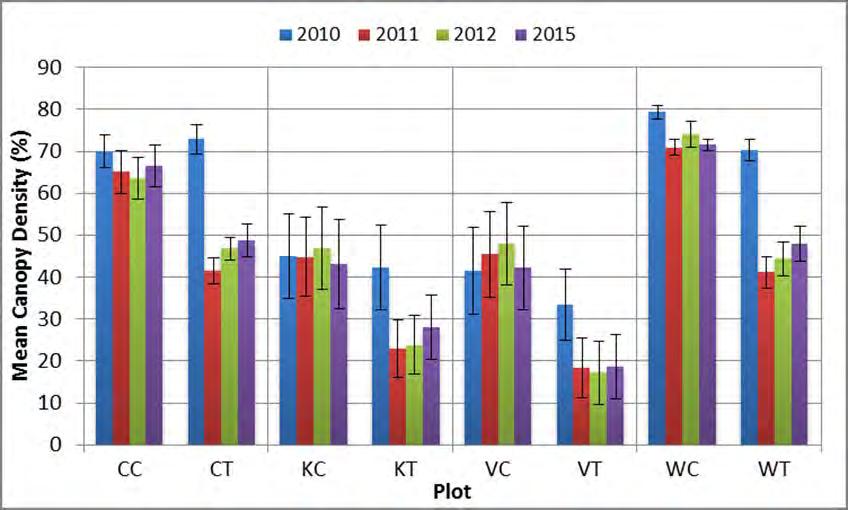
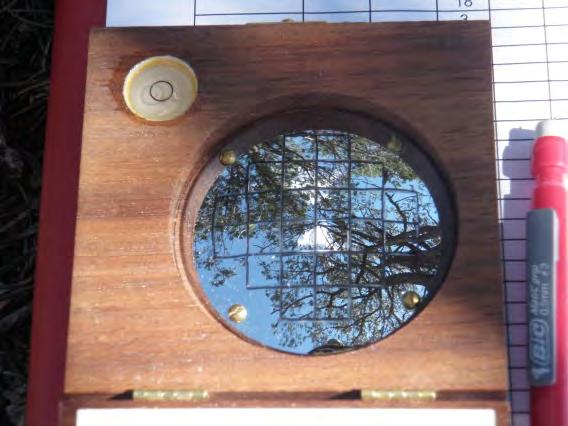
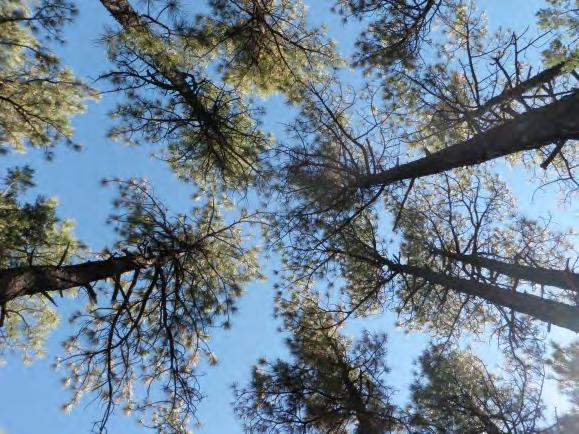
19 Tree Structure Vegetation vertical structure PP PJ PJ PP Tree canopy density PP PJ PJ PP


20 Piñon Cone Production 2015, 2016 Evidence that trees on thinned plots produce more cones and larger seeds 2016 Control Thinned Tree Count: from 25, 10m by 10m cell grids per plot.


21 Herbaceous Vegetation Above-Ground Canopy Cover (forbs+grasses) 1m 2 quads, 36/plot ponderosa sites 2011 piñon-juniper sites General significant increases in understory herb cover following treatments
22 Herb Species Community Similarity by Site and Treatment Hierarchical average linkage cluster analysis PJ T PJ T PJ T PJ C PJ C PP C PP T 2010, baseline PJ T PJ C PJ C PP T PP T 2011, immediately post PP T PP C Little pattern PP C PP C Little pattern PP C PP T PP C PP T PJ C PJ C PJ T PJ T 2015, 5 years post PJ treated plots unique PJ sites grouped by treatment following thinning, ponderosa sites did not.


23 Wildlife Does tree thinning affect wildlife in piñon-juniper and ponderosa pine woodlands? An objective of tree thinning is to improve wildlife habitat and wildlife abundance and diversity. We chose to evaluate tree thinning effects on birds, rodents and large mammals on the same study plots where soils, hydrology and vegetation responses were measured.
24 Birds Multiple Species/Trophic Groups, Habitat Specific, Abundant, Dynamic Hypothesis: No Tree Thinning Treatment Effect; change in species/numbers. Sample Locations: 50 m X 50 m Wildlife Plots; Each Site: Control, Treatment. 2 PJ sites, 2 PP sites. Sample Seasons: 1) Breeding Season (May), 2) Fall Migration (September). Sample Technique: Point Counts, 20 min, 3 Consecutive Mornings, Observer s Switch Plot Pairs Each Day. Data Obtained: Each Individual of Each Species, Heard and/or Visual, Time of Each Observation. No Distance Estimates. Data Analysis: Average 3 Consecutive Mornings for Each Year/Season, Cluster Analysis. Data Products: Species Composition, Abundance by Species, by Date, by Site, by Treatment.
25 Birds Numbers of Individuals all species combined Kelly PJ spring No treatment effect Kelly PJ fall No treatment effect Vigil PJ spring Treatment effect Vigil PJ fall No treatment effect


26 Birds: Species Spring breeding season bird species composition at PJ sites Species Total 12 Control 19 Treated Higher Richness on Treated Plots; addition of open habitat species; e.g., lark sparrow, Western kingbird, Say s phoebe, etc. 18 Species Total 10 Control 15 Treated
27 Bird Community Similarities PJ T PJ C PJ T PJ C PJ T PJ T PJ C PP T PJ little pattern, ponderosa grouped by site PJ C PP T All grouped by site PP C PP C PP T PP C PP T PP C PP C PP C PP T PP T PJ C PJ T PJ C PJ T PJ grouped by site, ponderosa by treatment 2015 PJ bird species compositions across sites/plots/treatments most similar based on location, not treatments, even following thinning. Ponderosa birds did show treatment effect.
28 Rodents Multiple Species/Trophic Groups, Habitat Specific, Abundant, Dynamic Hypothosis: No Tree Thinning Treatment Effect; change in species/numbers. Sample Locations: 50 m X 50 m Wildlife Plots; Each Site: Control, Treatment. 2 PJ sites, 2 PP sites. Sample Seasons: 1) Early Summer (May), 2) Late Summer (September). Sample Technique: Live Capture/Release/Recapture; H.B.Sherman 9 Live-Traps (36 / 50m grid), Oatmeal Bait, 3 Consecutive Nights, Ink-Mark Each New Capture/Release. Data Obtained: Each Individual of Each Species, Gender, Weight, New or Recapture. Data Analysis: Average 3 Consecutive Mornings for Each Year/Season. Cluster Analysis, MRPP, ISA. Data Products: Species Composition, Abundance by Species, by Date, by Site, by Treatment.


 / plot.")


29 Rodents Methods Paired Wildlife Plots 50m X 50m. 36 traps stations at 10m intervals (6 X 6) / plot. Sherman live traps, 3 consecutive nights, spring and fall each year. Live capture-mark/release/recapture.
30 Rodent Communities; Species and Abundance s General decline in rodent abundance from treated plots; PJ rodents dominated by piñon mice (Peromyscus truei) which are arboreal and trees are a key component of their habitat. Treatment effect Kelly PJ Vigil PJ Little treatment effect Kelly PJ Spring and fall data combined
")
")
31 Rodent Counts by Species; Fall 2015 Piñon mouse (Peromyscus truei) piñon-juniper woodlands Deer mouse(peromyscus maniculatus) ponderosa pine woodlands
32 Rodents: Community Similarities PP C PP T PP T PJ C PJ C PJ T Little pattern 2010 PP C 2011 PP T PP C PP T PJ T PJ T PJ C PJ C PJ grouped by treatment PP C PJ C PJ T PP T PJ C PJ T PP T Little pattern 2015 PJ rodent species compositions across sites/plots/treatments most similar based on treatments after tree thinning, but then little pattern 5 years later. Rodents declined during drought. Piñon mice started appearing in ponderosa sites, while deer mice declined.
33 Large Animals (mammals + wild turkeys) Multiple Species/Trophic Groups Hypothesis: No Tree Thinning Treatment Effect; change in species/numbers. Sample Locations: Near each 50 m X 50 m Wildlife Plot; Each Site: Control, Treatment. 2 PJ sites, 2 PP sites. Sample Seasons: Year-Round, Monthly Off-Loads; Each Month, Each year. Sample Technique: Automatic Wildlife Camera Traps (Primos TruthCam ). Data Obtained: Each Individual of Each Species. Data Analysis: Sum Monthly Counts Each Year, Site, Treatment. Data Products: Species Composition, Abundance by Species, by Month/Year, by Site, by Treatment.


34 Wildlife Cameras One camera at each paired plot, year-round Summary of total photographs of different animals recorded from wildlife cameras during 2015
35 Large Animals Native animals tend to be more abundant on control plots Domestic animals tend to be more abundant on treated plots
36 Large Animal Community Similarities No consistent patterns No site or treatment patterns No site or treatment patterns PJ group by site PJ thinned plots group by treatment
37 Conclusions for Piñon-Juniper Sites Wildlife Habitat; Tree density/cover decreased, while soil water content and herbaceous vegetation increased on thinned plots. Birds increased in abundance and species richness on treated plots during breeding seasons. Rodents declined in abundance on thinned plots, primarily piñon mice. Species richness showed little difference due to treatments. Among large animals, native wildlife tended to be more abundant on untreated control plots, while domestic livestock tended to be more abundant on thinned plots. This study was conducted during an exceptional drought. Results may have differed during an historic average or wet period. However, climate change predictions are for more drought and increased weather variability. These findings are limited to the sites studied; but do provide indications of patterns that should be explored with more research. Need more studies like this with larger sites, greater spatial replication and variation in topography, across elevation, and across different PJ types (these were PJ savanna type).
 has been critical to the implementation and success of this project, along with the help of Brenda Smythe and Cheri Lujan")
38 Acknowledgements We thank the New Mexico Water Trust Board for providing the majority of funding for this project. Dierdre Tarr of the Claunch-Pinto Soil and Water Conservation District (SWCD) has been critical to the implementation and success of this project, along with the help of Brenda Smythe and Cheri Lujan from the Edgewood and East Torrance SWCDs, Kent Reid and Joe Zebrowski from the New Mexico Forest and Watershed Restoration Institute, Lawrence Crane from New Mexico State Forestry, and Mike Matush from the New Mexico Environment Department. Special thanks to the Kelly, Vigil, and Wester families and to Juan Sanchez of the Chilili Land Grant for allowing us to conduct this research on their properties. Piñon mouse (Peromyscus truei)