Mike Flannigan University of Alberta and the Canadian Partnership for Wildland Fire Science Air Quality and Health Workshop 6 February 2019
|
|
|
- Jodie Hodge
- 5 years ago
- Views:
Transcription

1 Wildfire, Fuels and Management in Canada Mike Flannigan University of Alberta and the Canadian Partnership for Wildland Fire Science 2019 Air Quality and Health Workshop 6 February 2019


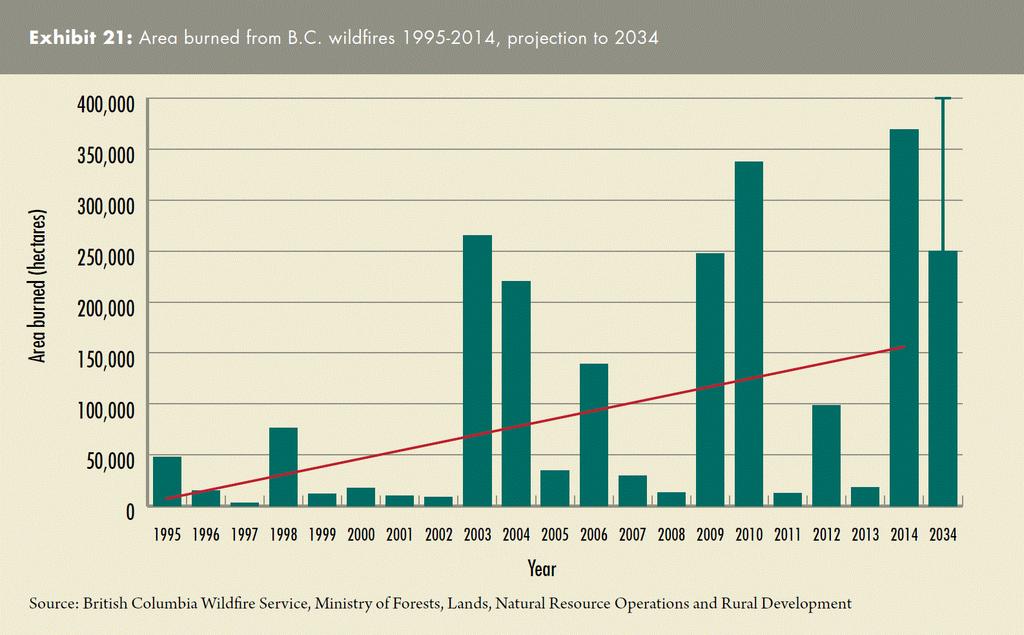
2 Canadian Fire Statistics Incomplete prior to Currently - average of 7000 fires a year burn million ha doubled since the 1970s. BC averages 1600 fires that burn nearly 400,000 hectares a year Often high intensity/high severity crown fires. Area burned is highly episodic: 0.4 to 7.6 million ha Lightning fires: 40% of total fires (BC ~60%) represent 80-90% of area burned Fire size: 3% of fires are >200 ha represent 97% of area burned 2

3

4 National map of the human-wildland interface 4

5 Fire Management Canadian fire management agencies among best in the world. Canadian Forest Fire Danger Rating System. Initial attack but if fire escapes Traditional approach has been total fire suppression now some regions use appropriate response. 5

6


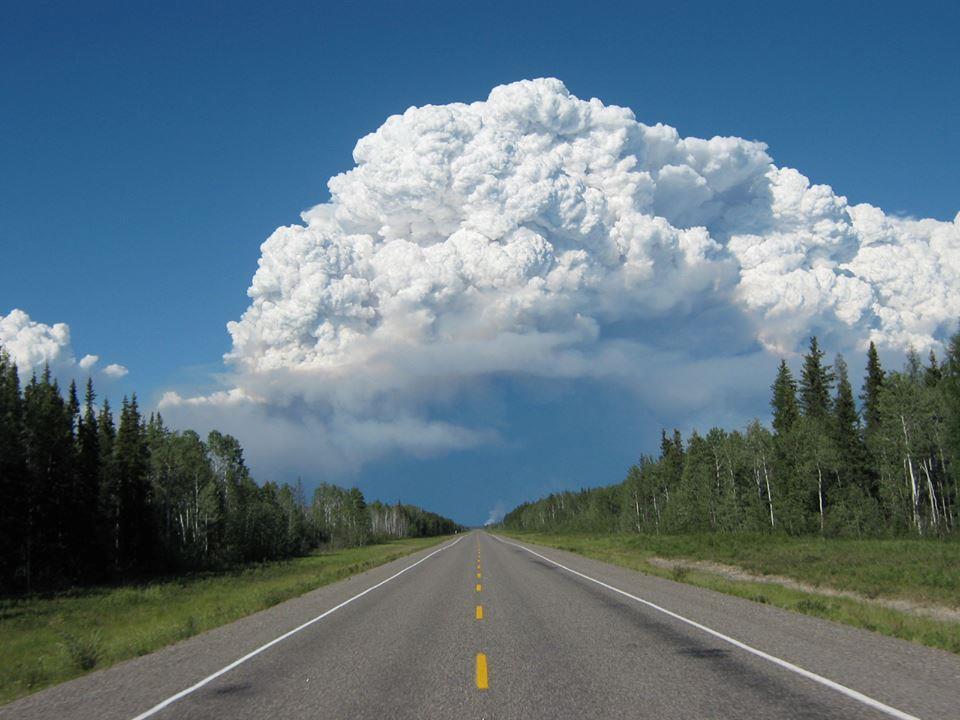
7 Forest Fires 3 Ingredients Fuel type, loading, moisture, structure. Ignition - human and lightning Weather hot, dry windy. Extreme weather


8 Fire Issues An average of $800 million spent by fire management agencies in Canada a year on direct fire fighting costs. These costs are rising Health and safety of Canadians evacuations smoke. Property and timber losses due to fire. Balancing the positive and negative aspects of fire. Traditional approaches to fire suppression (e.g., crews, air tankers) may be reaching their limit of economic and physical effectiveness. 8
 and Canada (BC, AB, NT, SK and MB).")
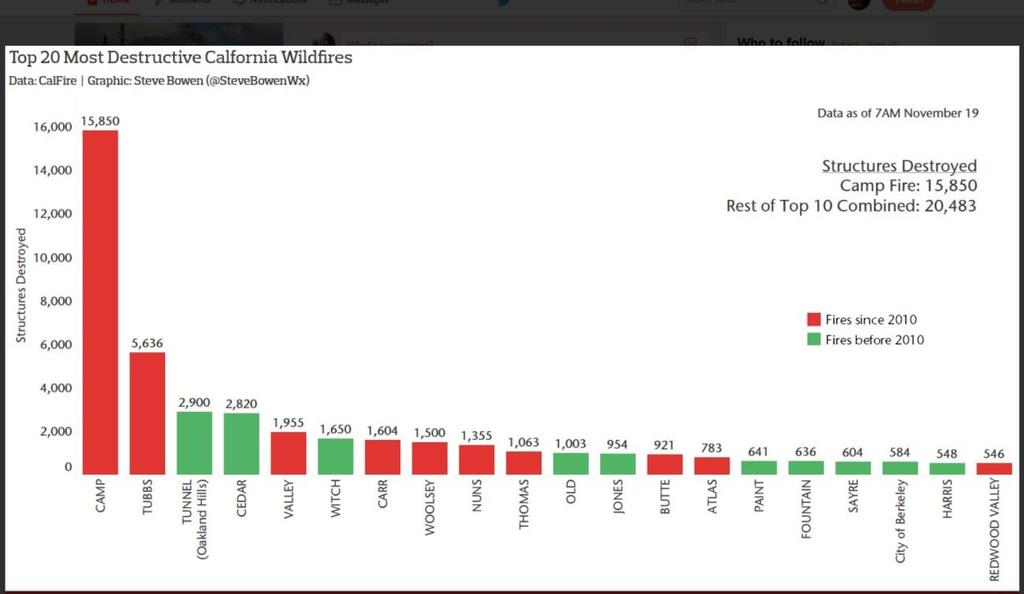
9 Fire Impacts Location, location location Slave Lake May 2011 Fort McMurray Chile, Portugal, Spain, South Africa, Ireland, Greenland, USA (CA) and Canada (BC, AB, NT, SK and MB) Greece, California, England, Sweden, ON and BC Globally, smoke related fatalities estimated at 330,000 per year 9
10

11 Wildfire Emissions Wildfire emission depend on the area burned, fuel consumed, combustion completeness (efficiency) and Emission Factor (amount of pollutant released (g per kg)) Significant variations over time and space. Combustion flaming and smouldering give rise to this variability. Major pollutant is PM. Particulates can be transported over long distances. Aged smoke particles often pose a greater health risk. Forests recently carbon sources not sinks 11
12 12

13
14

.")
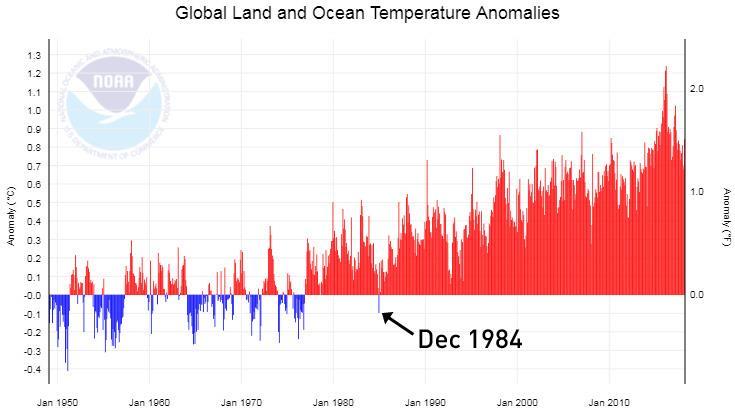
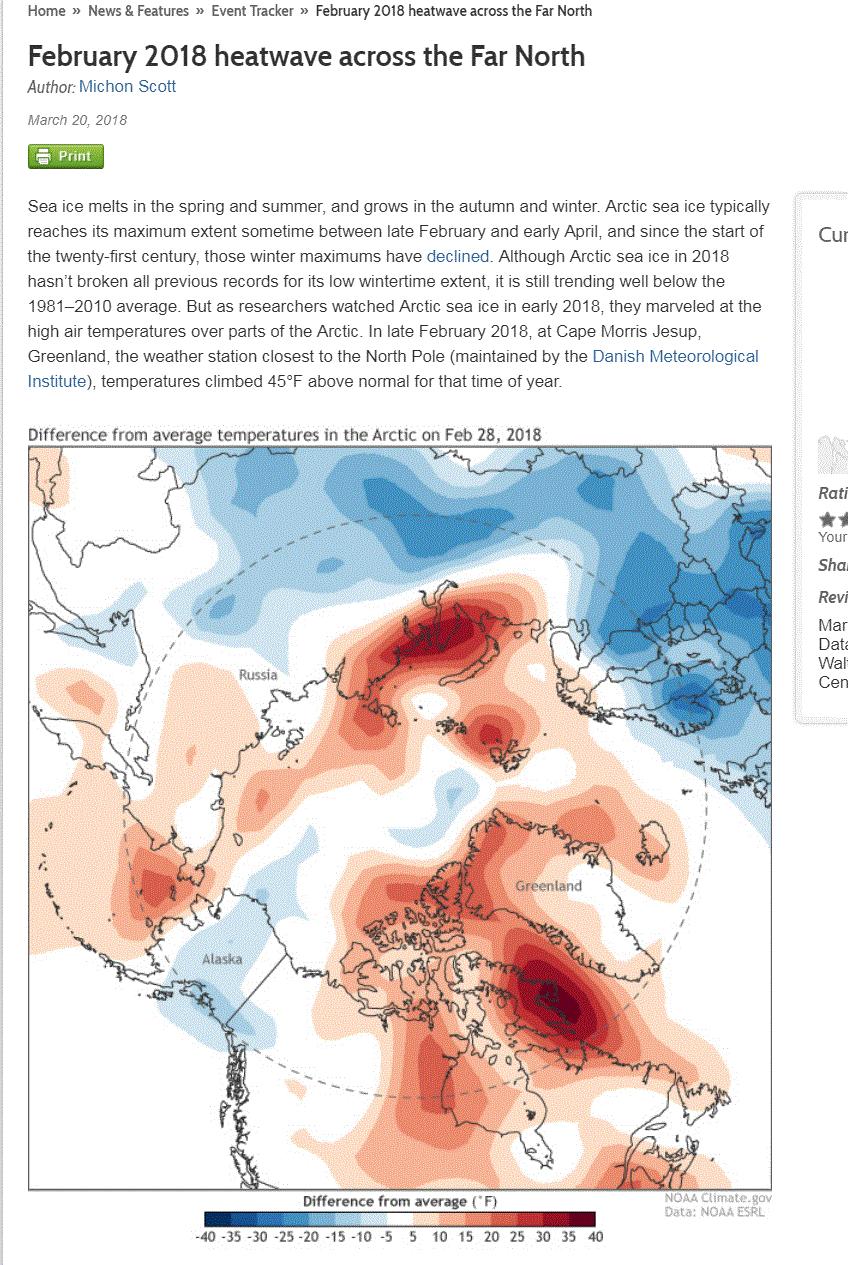
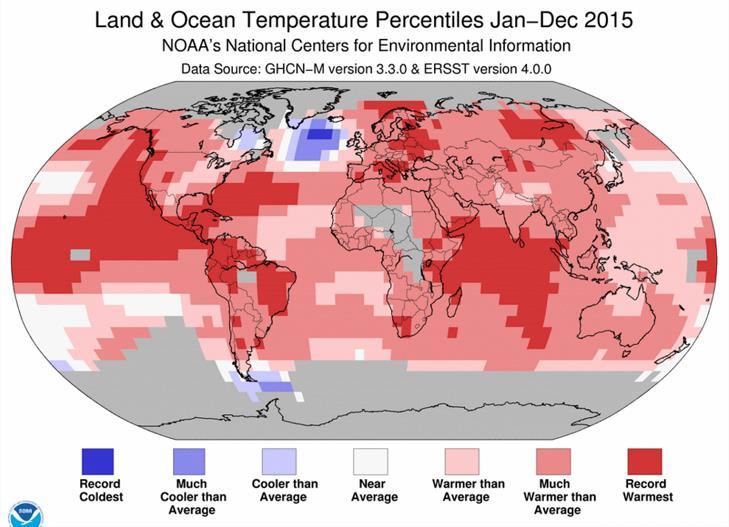
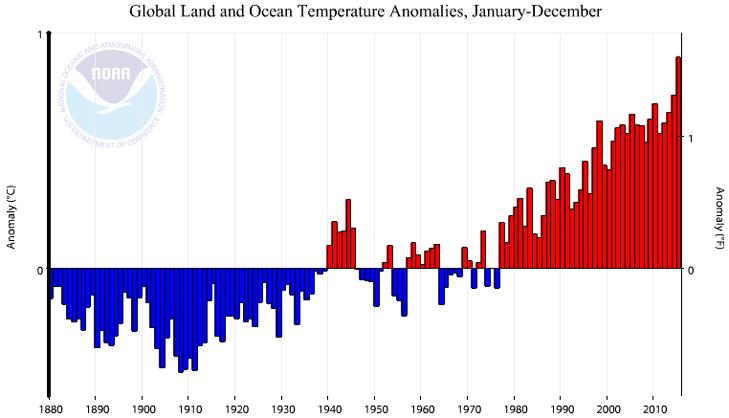
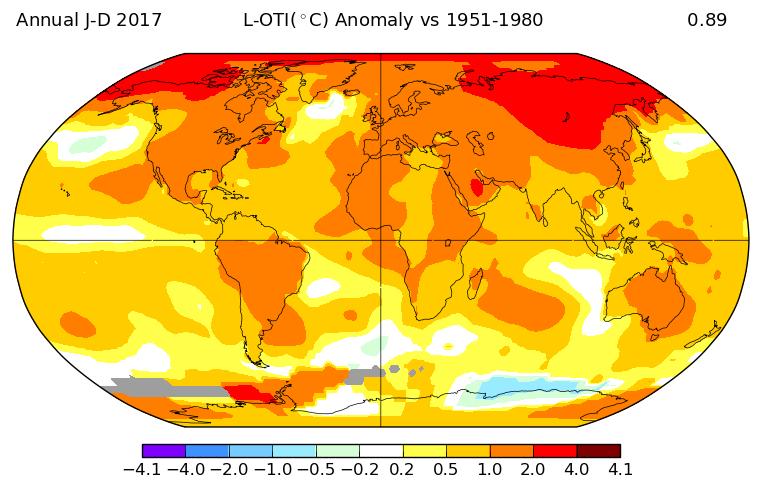
15 Climate Change Projections GCMs project up to a 6 0 C increase in global mean temperature by Greatest increases will be at high latitudes, over land and in winter/spring except the Arctic Ocean when seasonally ice-free. Projected increases in extreme weather(e.g., heat waves, drought, floods, wind storms and ice storms). Spatial and temporal variability in climate change. 15
16 Projected temperature changes vary considerably from year-to-year 16


17 Area Burned Projections Canadian 3xCO 2 Hadley 3xCO 2 Projections of area burned based on weather/fire danger relationships suggest a % increase in area burned by the end of this century according to the Canadian and Hadley models respectively 17


18 Fire & Temperature Drier fuels Lightning Fire season Photo credit: Government of the Northwest Territories
19 Surface Fuel Consumption Earlier work suggested that most of the increase in wildfire emissions were due to increased area burned. This more recent work suggests that fire intensity and fuel consumption will increase significantly. Wotton, B.M., Flannigan, M.D. and Marshall, G Potential climate change impacts on fire intensity and key wildfire suppression thresholds in Canada. Environmental Research Letters. 12 (2017) ,

20 Crown Fuel Consumption 20
21 How can we manage wildland fire Fuel, ignitions and hot, dry windy weather are part of our future so we need to learn to live with fire. That is, we have to allow fire on the landscape but when and where we want it (Appropriate Response). From the wildland fire perspective 3 ingredients but we can only manage the fuel and human-caused fires. Context for Canada climate change = more extreme weather = more fire on the landscape. FireSmart Canada fuel management, planning, education, cooperation, training and development. 21
 to identify severe fire weather episodes (Self Organized Maps). Use machine learning in building fire occurrence prediction systems.")
22 Manage wildland fire in the future Update the Canadian Forest Fire Danger Rating System. Need for an Early Warning System -Use machine learning (AI) to identify severe fire weather episodes (Self Organized Maps). Use machine learning in building fire occurrence prediction systems. Enhance existing fire decision support systems More remote sensing Focus on community zones( sprinklers) and Initial Attack Explore fuel management, in concert with harvesting, grazing and carbon management. Role of forest management and other disturbances for fire management? Emergency management phases prevention, mitigation, preparedness, response, recovery (review) Courtesy of Steve Taylor CFS 22

23 Prescribed burns versus wildfires Fire people argue for PBs -Little smoke under controlled conditions or lots of smoke - uncontrolled Where are the PBs located can be problematic. Even if it is a little smoke if it is close to the community that could be a problem. Alternate approaches include mechanical or grazing could be used. Balance PBs away from communities and other approaches near communities Complicated - Needs more research 23


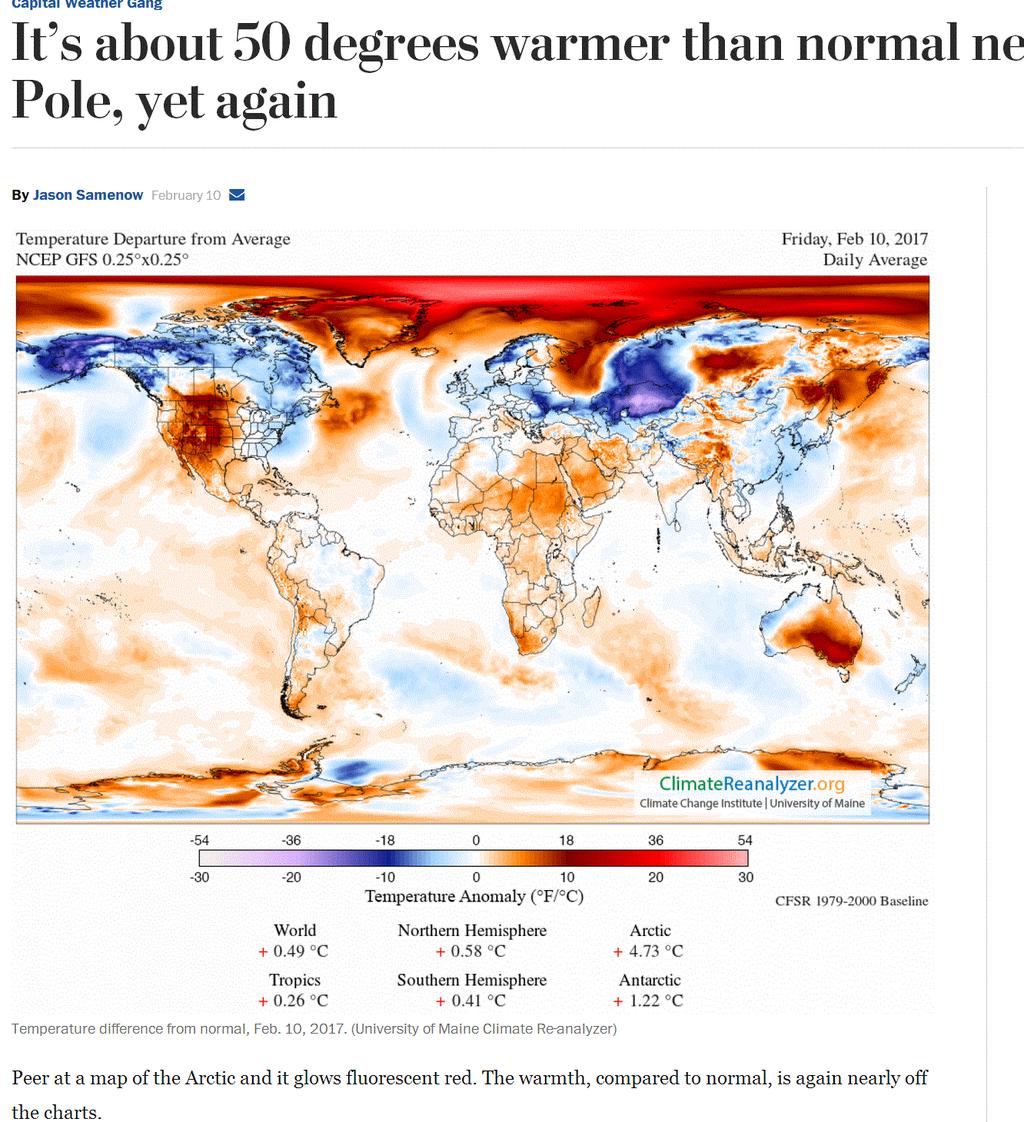
24 A wild card the Jet Stream Band of fast moving air energy derived from the temperature difference between equatorial regions and polar regions. Jet streams determine the strength and movement of the synoptic weather systems. Climate change is causing a weakened of the jet stream as the temperature difference between the equator and poles decreases. Atmospheric patterns stagnate, meandering more extremes droughts, floods, heat and cold. Important for BC as recent suggests a strengthening and persistence of a west coast ridge Can BC have 3 bad fire seasons in a row? Over 4% of the forested area of BC burned in the last 2 years. 24


25 Summary Fire and weather are strongly linked Changes in forest fires may be the greatest early impact of climate change on forests Fire activity will increase in a changing climate, but will be variable in time and space Longer fire season. Photo credit: Xinli Cai 25


26 Summary - 2 More fire occurrence, more crown fires (higher intensity), increased fuel consumption and more area burned leading significantly more emissions. More fire activity in the future and our fire management approaches have to adapt to this new reality. Photo credit: Dennis Quintilio May be entering new territory with no historical analogues. The unknown unknowns. We can not rely on only our experience. Fire and society interactions will increase in the future. We need to learn to live with fire and smoke. 26


27 @CanadaWildfire Photo credit: Dennis Quintilio 27
28

29 Wildfire Emissions Wildfire emission depend on the area burned, fuel consumed, combustion completeness (efficiency) and Emission Factor (amount of pollutant released (g per kg)) Significant variations over time and space. Combustion flaming and smouldering give rise to this variability. Major pollutant is PM. Particulates can be transported over long distances. Aged smoke particles often pose a greater health risk. 29
30 30
 System indexes for the period 1970-2099. Baseline 1971-2000.")
31 Methods - 1 Three GCMs CanESM2, HadGEM2-ES, CSIRO-Mk3.6.0 Three RCPs RCP2.6, RCP4.5, RCP8.5 Calculated the Canadian Fire Weather Index (FWI) System indexes for the period Baseline Canadian FWI System is a weather based system temperature, relative humidity, wind speed and precipitation.
 Fuels used a national fuel classification (250 m) for the forested regions of Canada.")
32 Methods - 2 Calculate the fire intensity, rate of spread, depth of burn, fuel consumption, crown fraction burned using the Canadian Fire Behaviour Prediction (FBP) System as well as days above specified thresholds (e.g., HFI > 2,000 and 10,000 KW/m) Fuels used a national fuel classification (250 m) for the forested regions of Canada. Aggregated fuels to a predominate fuel type for 40 km by 40 km cells. Time periods include baseline as well as and
33 Escaped Fires. Increased fire intensity may lead to more escapes Extended attack simulation showed that projected intensity increases resulted in very substantial increases in burned area Driven by the change in frequency of being above suppression intensity thresholds 33


34 CO2 Concentration (ppmv) CO2 concentrations are now unprecedented in at least the past 400,000 years Highest concentration in last 400,000 years $ $$! $$ $ $ $$$ $$$ $! $$ $$ #

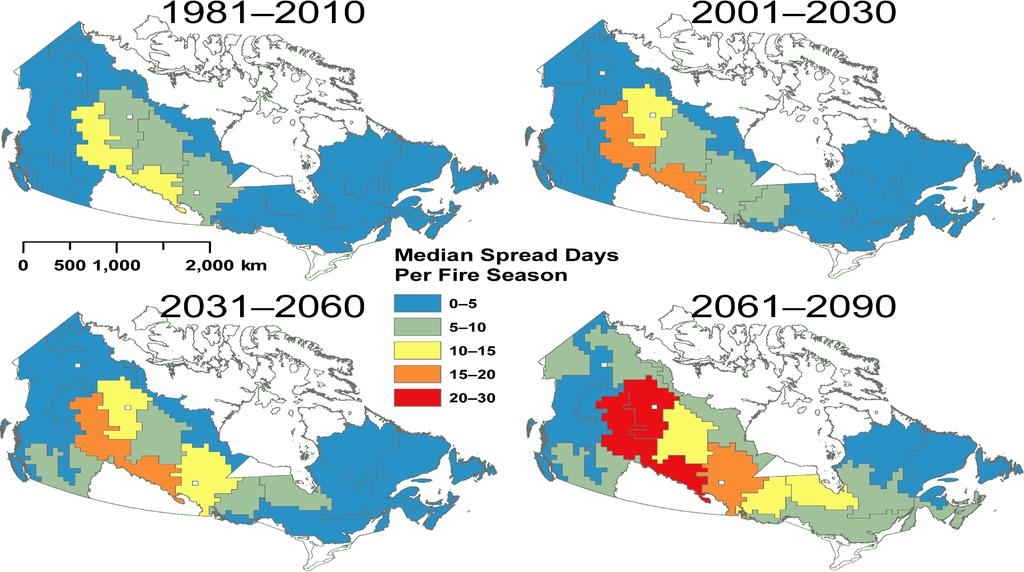
35 Change in days with HFI > 2,000 kw/m
36 Change in days with HFI > 10,000 kw/m 36
37 Area Burned Alaska W. Canada. Predicted mean annual area burned (km 2 /yr) per decade for Alaska and western Canada driven ( by the NCEP model development datasets( ) and the CGCM2 A2 and B2 climate scenarios ( ). 37
38 38
39 op.asp?data_folder=loop_of_the_day/goes- 16/ &number_of_images_to_dis play=200&loop_speed_ms=
40

41 Regional Variability Possibility of semipermanent (blocking) patterns of the synoptic weather systems. More extremes drought and fire and precipitation and flooding depending on where the ridges and troughs are. 41

42 Fire Regime Extent/size Intensity Type (surface, ground, crown) Frequency Seasonality Severity (impact on the ecosystem, mortality, depth of burn, fuel consumption)

43 Jain, P., Wang, X. and Flannigan, M Trend analysis of fire season length and extreme fire weather in North America between International Journal of Wildland Fire. 26:


44 Incoming solar energy heats the Earth, and outgoing heat radiation cools it off Incoming Energy Reflected Energy Outgoing Energy Energy Trapped By Greenhouse Gases

45 Future Fire Seasons Used NCEP reanalysis data to calculate the Canadian Fire Weather Index System components including DSR for the world As well as the fire season length using a temperature threshold. Three emission scenarios A1B, A2, B1 from three GCMS Canadian, Hadley and French IPSL.
. Forest fire occurrence and climate change in Canada.")
46 Future Fire Occurrence Increases in human and lightning-caused fires Conservative as these changes driven by fuel moisture changes alone. Significant regional variation. Wotton, B.M., Nock, C.A. and Flannigan, M.D. (2010). Forest fire occurrence and climate change in Canada. International Journal of Wildland Fire,19,
47
48 48
49 Future Fire Changes in climate (including warmer temperatures, changes in precipitation, atmospheric moisture, wind, and cloudiness) affect wildfires Direct, indirect, and interactive effects of weather/climate, fuels, and people will determine future fire activity Area burned Fire occurrence Fire season Fire intensity Fire severity Flannigan, M.D., Krawchuk, M.A., de Groot, W.J., Wotton, B.M. and Gowman, L.M. (2009). Implications of changing climate for global wildland fire. International Journal of Wildland Fire,18, Wotton, B.M., Nock, C.A. and Flannigan, M.D. (2010). Forest fire occurrence and climate change in Canada. International Journal of Wildland Fire,19, Relative change (percentage increase) in fire occurrence between future and baseline scenarios for the Canadian Climate Centre GCM. Relative change is given as the percentage increase in number of fires predicted by the GCM (future scenario minus baseline scenario) divided by the total number of fires in the baseline scenario ( i.e., (N N )/ N ); no data is shown in white.
50 50
51 51

52 Alberta is Different Spring fires 51% of the annual area burned is from May fire starts 82% of the fires in May are human-caused 10 year average of 1500 fires burning 280,000 ha
53 53
54
55 55


56 Development Now more than ever Canadians live and work in the forest. Development increasing in parts of the country. More people = more fire and more exposure to fire. We can make communities more fire-resistant but not fireproof 56