W E L C O M E. N Hotel, Cagayan De Oro City May 24, 2017
|
|
|
- Muriel McCoy
- 5 years ago
- Views:
Transcription
1 W E L C O M E N Hotel, Cagayan De Oro City May 24, 2017
2 Global and Regional State of Philippine Competitiveness N Hotel, Cagayan De Oro City May 24, 2017 MARINA N. SALDAÑA Presenter


3 Mandate: Executive Order No. 44 Advise the President on policy matters affecting competitiveness of the country Promote & develop competitiveness strategies and push for the implementation of an action agenda for competitiveness and link it to the PH Development Plan Provide inputs to the Philippine Development Plan, Investment Priorities Plan, Export Development Plan Recommend to Congress proposed legislation regarding country competitiveness Strategize and execute steps to improve PH competitiveness
4 Vision Mission Statement VISION A more competitive Philippines Instill a Culture of Excellence Public-Private Collaboration as a development engine MISSION To build up the long-term competitiveness of the Philippines through: Policy reforms Project implementation Institution-building Performance monitoring
5 Work Program Benchmark against key global competitiveness indices Map each indicator to the agency responsible Focus on lowestindicators Track city competitiveness and key indicators Concentrate on specific projects (Special Projects and Working Groups) Link work to Philippine Development Plan, National Budget, Legislative Executive Development Advisory Council, Cabinet Agenda

6 NCC Projects Working Groups RCC, CMCI PGS -Balanced Scorecards Automation EODB, GO-OBLS, IABPI, NQI EODB, Repeal Project BPLS M&E, AESC
7 GLOBAL COMPETITIVENESS REPORT CARD REPORT CHANGE 2010/11 to LATEST 1. Doing Business Report 99/ /189 95/ / / / / Economic Freedom Index 3. Corruption Perceptions Index 4. Global Competitiveness Report 5. Global Enabling Trade Index 6. Travel and Tourism Report SOURCE International Finance Corporation 58/180 70/178 76/178 89/178 97/ / / Heritage Foundation /168 95/168 85/175 94/ / / / /138 47/140 52/144 59/148 65/144 75/142 85/ n/a 64/138 n/a 72/132 n/a *92/ /136 n/a 74/141 n/a 82/140 n/a 94/139 n/a Global Innovation Index 74/128 83/ /143 90/142 95/141 91/ Global Information Technology Report 77/139 76/143 78/148 86/144 86/142 86/138-9 Transparency International World Economic Forum World Economic Forum World Economic Forum World Intellectual Property Organization World Economic Forum 9. E-Government Index 71/ / / /184 7 United Nations Fragile States Index 54/178 48/178 52/178 59/178 56/177 50/177-4 Fund for Peace Global Gender Gap Report 12. World Competitiveness Yearbook 13. Logistics Performance Index 7/144 7/145 9/142 5/136 8/135 8/135 9/ /60 41/60 42/60 38/60 43/59 41/59-1 World Economic Forum International Institute for Management Development 71/160 n/a 57/160 n/a 52/155 n/a 44/ World Bank 53 TOP 1/ Reached the Top 3 rd of the World Rankings Latest Performance
8 GLOBAL COMPETITIVENESS REPORT CARD *with 2016 Results, **reverse ranking (1 as worst) REPORT 2010/ /2017 GOAL (Top 3rd) CHANGE 4 to 6 years 1.Doing Business Report (IFC) 148/183 99/ Economic Freedom Index (HF)* 115/179 58/180* Corruption Perceptions Index (TI) 134/ / Global Competitiveness Index (WEF) 85/139 57/ Global Enabling Trade Index (WEF) 92/125 64/ Travel and Tourism Report (WEF) 94/139 79/ WIPO- Global Innovation Index (WIPO) 91/125 74/ Global Information Technology Report (WEF) 86/138 77/ E-Government Index (UN) 78/184 71/ Fragile States Index (FFP) ** 50/177 54/ Global Gender Gap Report (WEF) 9/142 7/ World Competitiveness Report (IMD) 41/59 42/ Logistics Performance Index (WB) 44/155 71/ REACHED THE TOP THIRD LATEST PERFORMANCE *with 2017 Results, **reverse ranking (1 as worst) UPGRADE DOWNGRADE

9 Country/Economy Singapore 2016 (out of 138) 2015 (out of 140) 2014 (out of 144) 2013 (out of 148) 2012 (out of 144) 2011 (out of 142) 2010 (Out of 139) Change Change Malaysia Thailand Indonesia Philippines Vietnam Lao PDR Cambodia Myanmar Brunei Darussalam GLOBAL COMPETITIVENESS REPORT PHILIPPINES and ASEAN n/a n/a n/a n/a n/a n/a n/a n/a


10 Top 4 Gains Since 2010/ No. 58 from No. 115 No. 99 from No.148 No. 101 from No. 134 No. 57 from No. 85 ECONOMIC FREEDOM INDEX DOING BUSINESS REPORT CORRUPTION PERCEPTION INDEX GLOBAL COMPETITIVENESS REPORT
11 NCC Programs and Activities N Hotel, Cagayan De Oro City May 24, 2017 FAISAH G. DELA ROSA Presenter
12 W O R K I N G G R O U P S SECTORAL FOCUS
13 Working Groups Anti-Corruption Anti-Smuggling Business Permits and Licensing System Education and Human Resources Development Judicial System National Quality Infrastructure Nutrition and Food Sec* Performance Governance System Power and Energy Transport and Infrastructure
14 E A S E O F D O I N G B U S I N E S S PROCESS IMPROVEMENT FOCUS


15 EASE OF DOING BUSINESS No. 148 out of 183 economies GAMEPLAN FOR COMPETITIVENESS +49 NOTCHES No. 99 out of 189 economies REFORMS Administrative Order 38 Ease of Doing Business Taskforce
16 PHILIPPINES vs ASEAN ( ) ASEAN 2017 REPORT (190 economies) 2016 REPORT (189 economies) Change Singapore Malaysia Thailand Vietnam Brunei Darussalam Indonesia Philippines Cambodia Lao PDR Myanmar Source: Published Doing Business Report
17 PHILIPPINES vs ASEAN ( ) Economy 2017 (190) 2016 (189) 2015 (189) 2014 (189) 2013 (185) 2012 (183) 2011 (183) Change Change Singapore Malaysia Thailand Brunei Darussalam Vietnam Indonesia Philippines Cambodia Lao PDR Myanmar NDA NDA NDA Source: Published Doing Business Report

18 Doing Business Report: Philippines rd Top third Current 190 Source: Published Doing Business Report
19 PHILIPPINES DOING BUSINESS INDICATORS ( ) INDICATORS 2017 REPORT (190 economies) 2016 REPORT (189 economies) Change Starting a Business Dealing w/ Construction Permits Getting Electricity Registering Property Getting Credit Protecting Investors Paying Taxes Trading Across Borders Enforcing Contracts Resolving Insolvency Source: Published Doing Business Report
20 PHILIPPINES DOING BUSINESS INDICATORS ( ) INDICATORS 2017 (190) 2016 (189) 2015 (189) Published Rankings 2014 (189) 2013 (185) 2012 (183) 2011 (183) Change Change Starting a business Dealing w/ construction permits Getting electricity Registering Property Getting Credit Protecting Investors Paying Taxes Trading across borders Enforcing contracts Resolving Insolvency Source: Published Doing Business Report
21 UPGRADES & DOWNGRADES Philippine Rankings ( ) Resolving Insolvency Dealing with Construction Permits Getting Electricity Paying Taxes Getting Credit From 153 to 56 From 156 to 85 From 54 to 22 From 124 to 115 From 128 to 118 Trading Across Borders Enforcing Contracts Starting a Business Registering Property Protecting Minority Investors From 61 to 95 From 118 to 136 From 156 to From 102 to 112 From 132 to 137


22 NEW ZEALAND G2G KNOW HOW Supplying New Zealand solutions to grow your capability Ease of Doing Business in the Philippines: Exploratory Support Exercise


23
 and Davao (and other regional cities) Interviewed 21 corporations, 23 sole proprietors and 15")
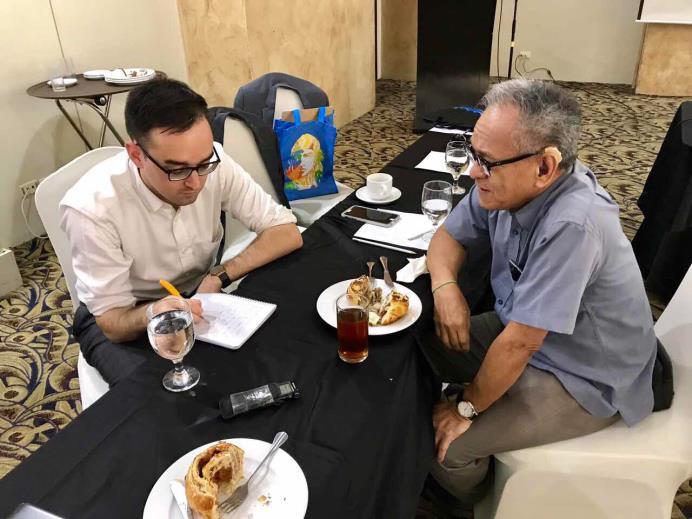
24 Scoping Mission : Methodology Individual meetings with DTI, SEC, CDA, DICT, DOF Workshops / visits with LGUs Quezon City, Lapu Lapu (and other regional cities) and Davao (and other regional cities) Interviewed 21 corporations, 23 sole proprietors and 15 co-operatives 24
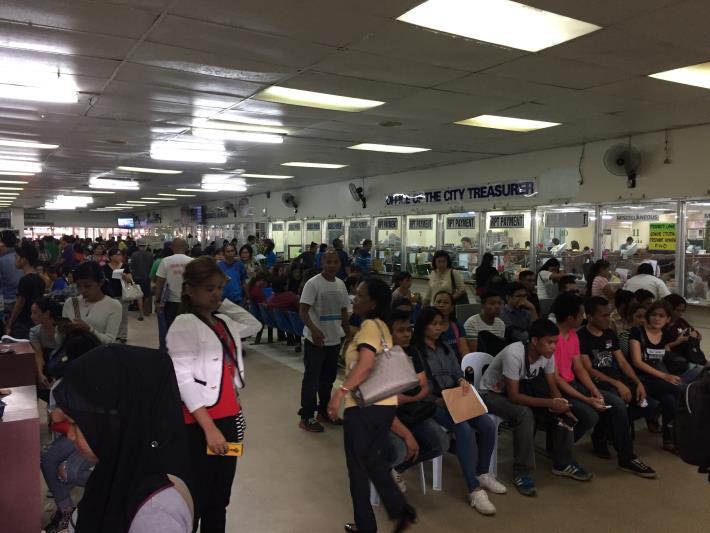
25 What NZ experts heard from businesses and entrepreneurs Elapsed time for registration of corporations (end to end) is typically 1 2 months if there are no hiccups Frequent trips to offices required as a result of: Key people not being available (e.g. for signatures) Requirements are not consistent with published information (e.g. on the website) or have changed without being communicated Online services not available / website down Waiting time is significant sometimes several hours + travel time to offices results in min. ½ day away from businesses per interaction with agency / LGU Lots of duplication of same basic information required for forms: 1. SEC / DTI / CDA 2. Clearances Barangay, Fire, Sanitation, Location, etc 3. LGU Frustration with name reservation process for corporations 10 name suggestions required until one is approved 25
26 What NZ experts heard from businesses and entrepreneurs Use 3 rd parties (lawyer, accountant, representative) to complete process because it is too much hassle to complete by business directly some with special access to agencies / LGUs User experience on websites is poor takes a long time to find information required No pro-active communication from agencies to businesses typically have to call or visit the office to find out status of processing No lunch break means that during lunch hours there may only be 1 or 2 counters open Sometimes frontline staff are not knowledgeable on specifics of the process or recent changes to the processes Mayor s permit sometimes not granted or severely delayed if mayor does not like a new business Confusion about whether Green Lane process is still available / in use 26
27 What NZ experts heard from businesses and entrepreneurs Rules in regulation (legislation) out of sync with current practices e.g. holding face to face AGMs with overseas shareholders Chicken and egg situation for paid-in capital from overseas shareholders uncertainty over which bank clearance is required (i.e. company bank account doesn t exist so needs to be paid into another account) No aggregate payment of all fees and charges in one payment some components can be paid in cash only (e.g. stock and transfer book) Lack of consistency at LGU level different requirements between LGUs (difficult for businesses with operations across LGUs) 100% of businesses / proprietors / cooperatives we asked would like a fully electronic, online process 27
28 What NZ experts heard from agencies / LGU Procurement process is lengthy and complicated many failed attempts that require re-tendering hard to make progress quickly Issue with contracting of providers in some cases no access to source code / data Internet stability, bandwidth, speed, reliability Authoritarian approach of mandating change does not always work Internal perception by staff that streamlined / online processes will lead to redundancies -> resistance to change Uncertainty over application and use of electronic signatures Many opportunities to link databases between national agencies as well as national agencies and LGUs but has been difficult to implement 28
29 General themes observed during the Scoping Mission Actual customer experience varies (significantly) from agency view Focus on immediate area of operation only limited visibility / awareness of end to end journey for customer Compliance mindset agencies / LGUs are typically referring to businesses / entrepreneurs as taxpayer Limited data on filing agent / businesses limited evidence of segmentation of the businesses and filing agents Passive feedback - limited scope of customer feedback Inconsistency - wide range of different requirements / clearances by LGU Hidden requirements - change of requirements or new, undocumented requirements Duplication multiple collection and data entry (both by customer and agencies) 29
30 Implications for businesses Process is too hard - motivation for non-compliance operating without license or use of fixers Productivity loss for the economy (1m+ days of economic activity lost) Millennials losing faith / confidence in Government (local and national) Reduced (overseas) investor confidence in processes, reluctance to invest High barriers to entry especially for young / first time entrepreneurs. Impacts the backbone of the economy hardest - micro enterprises and small/medium sized enterprises 30
31 Next steps Report with detailed findings and recommendations by July 2017 NZ Government will work with NCC to explore follow-up opportunities Ideally roadmap of initiatives and programmes in the short term to take advantage of opportunities to Step-change improvement for businesses, entrepreneurs and cooperatives Ranking for starting a business in top 60 in
32 Current EODB Current initiatives Initiatives : Proposed on EODB Expanded : ARTA The bill proposes some basic changes in the business permitting and licensing activities of government. It addresses many of the common issues faced by businesses and entrepreneurs at both at the national agency and local government level as well as the tricky issue of fees for obtaining permits.
33 Current EODB Current initiatives Initiatives : Proposed on EODB Expanded : ARTA The objectives of the proposed bill are as follows: Provide a business environment conducive to the establishment and operation of businesses in the country; Simplify business permit and licensing system procedures and streamline requirements at national and local levels; Promote transparency in government with regard to business registration and other manner of transacting with the public to reduce red tape and expedite permitting, licensing and other similar transactions in government.

34 Current EODB Current initiatives Initiatives : Proposed on EODB Expanded : ARTA NGAs and LGUs must provide a COMPREHENSIVE CHECKLIST of requirements for every type of license, clearance and/or permit being issued. A SINGLE OR UNIFIED BUSINESS APPLICATION FORM shall be used in processing new applications for business permits and business renewals which consolidates all the information of the applicant by various local government departments.

35 Current EODB Current initiatives Initiatives : Proposed on EODB Expanded : ARTA PRESCRIBED PROCESSING TIME MSMEs : maximum three (3) working days for simple applications and ten (10) working days for complex applications. For special types of businesses that require clearances, accreditation and/or licenses : 30 working days (or as determined by the government agency or instrumentality concerned, whichever is shorter). REGULATORY IMPACT ASSESSMENT All proposed regulations shall undergo regulatory impact assessment to establish if the proposed regulation does not add undue regulatory burden to business entities and national and local government agencies.
36 Current EODB Current initiatives Initiatives : Proposed on EODB Expanded : ARTA CENTRAL BUSINESS PORTAL The DICT shall establish a Central Business Portal which shall serve as a central system to receive applications and capture application data from business entities. PHILIPPINE BUSINESS REGISTRY DATABANK Business licensing and/or permitting agencies will have access to the Philippine Business Registry Databank to verify validity, existence and other information relevant to a business entity.
37 R E G I O N A L C O M P E T I T I V E N E S S C O M M I T T E E S C I T I E S A N D M U N I C I PA L I T I E S C O M P E T I T I V E N E S S I N D E X GEOGRAPHICAL FOCUS
38 Building local competitiveness is critical to enhancing long-term national competitiveness
")
39 CITIES AND MUNICIPALITIES COMPETITIVENESS INDEX (CMCI) Started 2013
 with the assistance of the United States Agency for International")
40 OVERVIEW The Cities and Municipalities Competitiveness Index is an annual ranking of Philippine cities and municipalities developed by the National Competitiveness Council through the Regional Competitiveness Committees (RCCs) with the assistance of the United States Agency for International Development.

41 ABOUT THE RCCs

42 ABOUT THE RCCs

43 USES OF THE INDEX

44 ABOUT CMCI FRAMEWORK


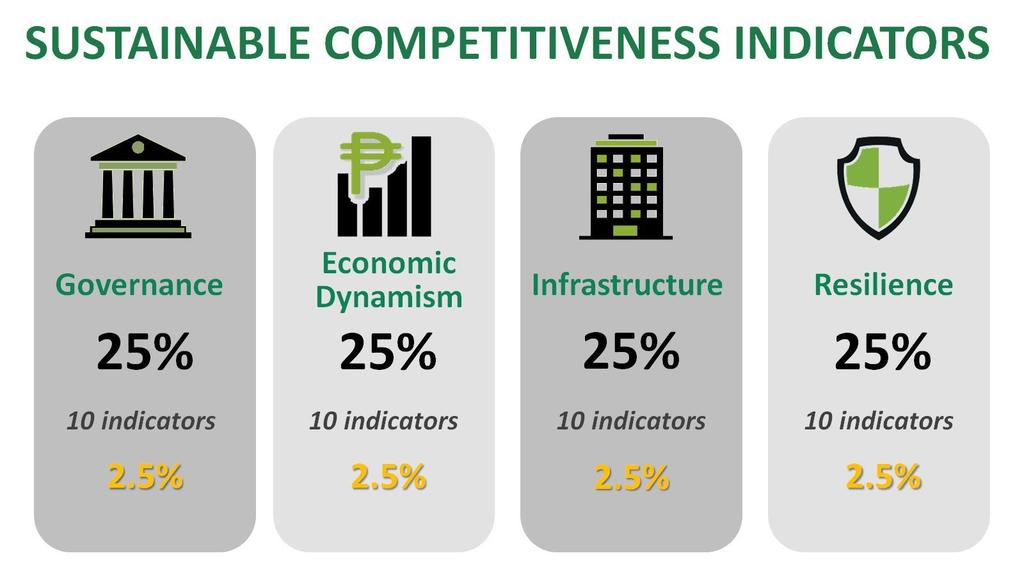
45 ABOUT CMCI PILLARS Economic Dynamism Government Efficiency Infrastructure
46 Economic Economic Dynamism Size of the Local Economy Growth of the Local Economy Structure of Local Economy* Safety Compliant Business* Increase in Employment Cost of Living Cost of Doing Business Financial Deepening Productivity Main Indicators Gross Sales and Total Capitalization of Registered Firms Percent Change of Sales and Capitalization from past year Shares of agriculture, industry and services in total registration* Number of Occupancy Permits approved*; Number of approved fire safety inspection Number of Employees from registered firms Local Inflation Rate Cost of utilities, wages and land Number of financial institutions in the LGU Gross Sales of Registered Firms divided by Number of employees Presence of Business Organizations Total number of Business Groups in the LGU 46
47 Governance Governance Compliance to National Directives Investment Promotion Capacity Main Indicators Presence of Comprehensive Development Plan (CDP); Age of CDP in years Presence of Investment Promotion Code, Unit, staff and ordinance Business Registration Efficiency Number of Steps and Days in Getting Building and Occupancy Permits Capacity to Generate Local Resource Ratio of LGU collected Tax to Total LGU revenues Capacity of Health Services Capacity of School Services Recognition of Performance Compliance to Business Permits and Licensing System (BPLS) Standards Security (Peace and Order? Law Enforcement? Police Visibility?) Social Protection Number of health professionals Ratio of Teachers and Students in secondary education Number of awards conferred to LGU BPLS Automation, Number of steps and days for new and renewal of business permits Ratio of number of policeman in locality to total population of LGU* Ratio of number of local citizens with PhilHealth Registration to total population of LGU* 47
48 Infrastructure Infrastructure Basic Infrastructure: Roads Basic Infrastructure: Ports Basic Infrastructure: Availability of Basic Utilities Basic Infrastructure: Public Transportation Education Infrastructure Health Infrastructure LGU Investment in Infrastructure Accommodation Capacity Information Technology Capacity Main Indicators Existing Road Network Distance of LGU Center to Major Ports Average hours of utility services per day; Percentage of households with utility services Number of Public transportation vehicles Ratio of Number of secondary schools and classrooms and secondary school going age population* Ratio of Number of public and private health facilities and beds to total population* Ratio of total investment of LGU in infrastructure to total LGU budget Number of DOT Accredited Accommodations Number of cable, internet and telephone/mobile providers Financial Technology Capacity Number of Automated Teller Machines 48

49 Ranks Local Governments in 5 Categories
50 Data Collection Methodology
51 START NCC sends CMCI survey forms to RCCs 151
52 RCCs distribute CMCI survey forms to LGUs 252

53 LGUs fill out CMCI survey forms 353
54 RCCs collect survey forms and validate LGU submissions 454
55 RCCs submit regional validated data to NCC 555

56 NCC processes regional data to come-up with national rankings 656
57 NCC presents results and awards best performing localities END 757

58 C M C I C o v e r a g e CITIES MUNICIP 136 CITIES MUNICIP 142 CITIES 978 MUNICIP 144 CITIES Out of 1,634 local governments in the Philippines 1245 MUNICIP
 34 Highly Urbanized Cities 110")

 755 3 rd to 6 th Class")

59 2016 Coverage (out of 1634 LGUS) 144 Cities (All Cities) 34 Highly Urbanized Cities 110 Independent Component and Component Cities 1245 Municipalities st to 2 nd Class Municipalities (326 first class and 164 second class) rd to 6 th Class Municipalities (240 second class, 179 third class, 323 fourth class, 183 fifth class and 9 Sixth class) 59

60 A total of 74 out of 81 provinces qualified for provincial ranking 60
61 Remaining Provinces Abra, CAR Catanduanes, Region V Basilan, ARMM Lanao Del Sur, ARMM Maguindanao, ARMM Sulu, ARMM Tawi-tawi, ARMM 61
62 LGU Coverage Region Number of LGUs with Data submission LGUs covered from previous year/s without submission for this year Total LGUs Covered Total Target LGUs % of completion CAR NCR Region Region Region Region 4A Region 4B Region Region Region
63 LGU Coverage Region Number of LGUs with Data submission LGUs covered from previous year/s without submission for this year Total LGUs Covered Total Target LGUs % of completion Region Region Region Region Region CARAGA NIR ARMM Total
64 Input Points P I L L A R S I N D I C A T O R S SUB- I N D I C A T O R S T O T A L N U M B E R O F I N P U T S E c o n o m i c D y n a m i s m G o v e r n m e n t E f f i c i e n c y I n f r a s t r u c t u r e TOTAL
65 Completion Rates Completion Rate P I L L A R S Cities Municipalities Cities Municipalities Cities Municipalities Cities Municipalities Economic Dynamism Government Efficiency 52% 47% 83% 69% 83% 69% 88% 72% 46% 40% 85% 74% 89% 78% 89% 79% Infrastructure 71% 63% 72% 64% 76% 71% 82% 72% TOTAL 56% 50% 79% 68% 83% 73% 87% 74% 65
66 Completion Rate per Region REGION CITIES MUNICIPALITIES AVERAGE CAR 92.28% 80.74% 86.51% NCR 92.98% 60.44% 76.71% Region % 64.79% 75.22% Region % 70.24% 79.49% Region % 78.13% 84.43% Region 4A 84.24% 83.39% 83.82% Region 4B 86.74% 74.29% 80.51% Region % 55.97% 74.46% Region % 62.06% 74.60% Region % 78.19% 74.83% Region % 62.47% 72.53% Region % 73.20% 78.64% 66
67 Completion Rate per Region REGION CITIES MUNICIPALITIES AVERAGE Region % 79.00% 75.66% Region % 60.00% 76.41% Region % 89.30% 85.37% NIR 85.43% 70.19% 77.81% CARAGA 99.43% 77.06% 88.24% ARMM 77.09% 77.09% 67
68 2016 CMCI RANKINGS
69 Highly Urbanized Cities: Overall Rankings ( ) Overall Rank (out of 34 LGUs) 7 Local Government Cagayan De Oro 29 Iligan Province Misamis Oriental Lanao Del Norte Overall Score (out of 100) Economic Dynamism Rank (out of 34 LGUs) Economic Dynamism Score (out of ) Government Efficiency Rank (out of 34 LGUs) Government Efficiency Score (out of ) Infrastructure Rank (out of 34 LGUs) Infrastructure Score (out of )
70 Component Cities: Overall Rankings ( ) Overall Rank (out of 110 LGUs) Local Government 40 Ozamis 42 Oroquieta 44 Gingoog Province Overall Score (out of 100) Economic Dynamism Rank (out of 110 LGUs) Economic Dynamism Score (out of ) Government Efficiency Rank (out of 110 LGUs) Government Efficiency Score (out of ) Infrastructur e Rank (out of 110 LGUs) Infrastructur e Score (out of ) Misamis Occidental Misamis Occidental Misamis Oriental Valencia (BK) Bukidnon Misamis 52 El Salvador Oriental Malaybalay Bukidnon Misamis 81 Tangub Occidental
71 1 st and 2 nd Class Municipalities: Overall Rankings ( ) Overall Rank (out of 490 LGUs) Local Government Province Overall Score (out of 100) Economic Dynamism Rank (out of 490 LGUs) Economic Dynamism Score (out of ) Government Efficiency Rank (out of 490 LGUs) Government Efficiency Score (out of ) Infrastructure Rank (out of 490 LGUs) Infrastructure Score (out of ) 21 Manolo Fortich Bukidnon Maramag Bukidnon Balingasag Misamis Oriental Lala Lanao Del Norte Tagoloan (MO) Misamis Oriental Quezon (BK) Bukidnon Kapatagan (LN) Lanao Del Norte Baungon Bukidnon Opol Misamis Oriental Tubod (LN) Lanao Del Norte Claveria (MO) Misamis Oriental Lugait Misamis Oriental Villanueva Misamis Oriental
72 1 st and 2 nd Class Municipalities: Overall Rankings ( ) Overall Rank (out of 490 LGUs) Local Government Province Overall Score (out of 100) Economic Dynamism Rank (out of 490 LGUs) Economic Dynamism Score (out of ) Government Efficiency Rank (out of 490 LGUs) Government Efficiency Score (out of ) Infrastructure Rank (out of 490 LGUs) Infrastructure Score (out of ) 223 Talakag Bukidnon San Fernando (BK) Bukidnon Don Carlos Bukidnon Pangantucan Bukidnon Impasug-Ong Bukidnon Lantapan Bukidnon Kalilangan Bukidnon Kibawe Bukidnon Jasaan Misamis Oriental Malitbog (BK) Bukidnon Libona Bukidnon Kitaotao Bukidnon
73 3 rd to 6 th Class Municipalities: Overall Rankings ( ) Overall Rank (out of 755 LGUs) Local Government Province Overall Score (out of 100) Economic Dynamism Rank (out of 755 LGUs) Economic Dynamism Score (out of ) Government Efficiency Rank (out of 755 LGUs) Government Efficiency Score (out of ) Infrastructure Rank (out of 755 LGUs) Infrastructure Score (out of ) 3 Calamba (MC) Misamis Occidental Jimenez Misamis Occidental Mambajao Camiguin Kolambugan Lanao Del Norte Bacolod (LN) Lanao Del Norte Laguindingan Misamis Oriental Alubijid Misamis Oriental Aloran Misamis Occidental Catarman (CM) Camiguin Plaridel (MC) Misamis Occidental Linamon Lanao Del Norte Initao Misamis Oriental Sumilao Bukidnon Legend: * = Most improved LGU
74 3 rd to 6 th Class Municipalities: Overall Rankings ( ) Overall Rank (out of 755 LGUs) Local Government Province Overall Score (out of 100) Economic Dynamism Rank (out of 755 LGUs) Economic Dynamism Score (out of ) Government Efficiency Rank (out of 755 LGUs) Government Efficiency Score (out of ) Infrastructure Rank (out of 755 LGUs) Infrastructure Score (out of ) 92 Baroy Lanao Del Norte Tudela (MC) Misamis Occidental Clarin (MC) Misamis Occidental Kinoguitan Misamis Oriental Cabanglasan Bukidnon Sagay (CM) Camiguin Medina Misamis Oriental Salay Misamis Oriental Manticao Misamis Oriental Panaon Misamis Occidental Sapang Dalaga Misamis Occidental Magsaysay (MO) Misamis Oriental Guinsiliban Camiguin
75 3 rd to 6 th Class Municipalities: Overall Rankings ( ) 233 Balingoan Misamis Oriental Naawan Misamis Oriental Mahinog Camiguin Lopez Jaena Misamis Occidental Talisayan Misamis Oriental Sultan Naga 256 Dimaporo Lanao Del Norte Dangcagan Bukidnon Damulog Bukidnon Kadingilan Bukidnon Bonifacio Misamis Occidental Sugbongcogon Misamis Oriental Maigo Lanao Del Norte Gitagum Misamis Oriental Matungao Lanao Del Norte Lagonglong Misamis Oriental
76 3 rd to 6 th Class Municipalities: Overall Rankings ( ) 364 Binuangan Misamis Oriental Tangcal Lanao Del Norte Libertad (MO) Misamis Oriental Sinacaban Misamis Occidental Baliangao Misamis Occidental Don Victoriano 564 Chiongbian Misamis Occidental Pantar Lanao Del Norte Pantao Ragat Lanao Del Norte Conception Misamis Occidental Kauswagan Lanao Del Norte Salvador Lanao Del Norte Sapad Lanao Del Norte Munai Lanao Del Norte Magsaysay (LN) Lanao Del Norte Nunungan Lanao Del Norte Poona Piagapo Lanao Del Norte Baloi Lanao Del Norte Tagoloan (LN) Lanao Del Norte
77 Most Competitive Provinces: Provincial Rankings ( ) Rank Province Region Score 1 Rizal Region IVA- CALABARZON Cavite Region IVA- CALABARZON South Cotabato Region XII - SOCCSKSARGEN Laguna Region IVA- CALABARZON North Cotabato Region XII - SOCCSKSARGEN Sultan Kudarat Region XII - SOCCSKSARGEN Bataan Region III - Central Luzon Aklan Region VI - Western Visayas Batangas Region IVA- CALABARZON La Union Region I - Ilocos Region Misamis Occidental Region X - Northern Mindanao Misamis Oriental Region X - Northern Mindanao Bukidnon Region X - Northern Mindanao Camiguin Region X - Northern Mindanao Lanao Del Norte Region X - Northern Mindanao
78 Most Improved LGUs : Highly Urbanized Cities Region 10 LGU Rankings ( ) Overall Rank (2015) Overall Rank (2016) Differenc e Rank Local Government Province Region City Classification Cagayan de Oro Misamis Oriental Iligan Lanao del Norte Region X - Northern Mindanao Region X - Northern Mindanao Highly Urbanized City Highly Urbanized City
79 Most Improved LGUs : Component Cities Region 10 LGU Rankings ( ) Overall Rank (2015) Overall Rank (2016) Difference Rank Local Government Province Region City Classification Valencia (BK) Bukidnon Oroquieta Misamis Occidental Tangub Misamis Occidental Malaybalay Bukidnon El Salvador Misamis Oriental Ozamis Misamis Occidental Gingoog Misamis Oriental Region X - Northern Mindanao Region X - Northern Mindanao Region X - Northern Mindanao Region X - Northern Mindanao Region X - Northern Mindanao Region X - Northern Mindanao Region X - Northern Mindanao Component City Component City Component City Component City Component City Component City Component City
80 Most Improved LGUs : 1 st 2 nd Class Mun. Region 10 LGU Rankings ( ) Overall Rank (2015) Overall Rank (2016) Difference Rank Local Government Province Region Income Classification Baungon Bukidnon Impasug-ong Bukidnon San Fernando (BK) Bukidnon Quezon (BK) Bukidnon Villanueva Misamis Oriental Kibawe Bukidnon Malitbog (BK) Bukidnon Balingasag Misamis Oriental Jasaan Misamis Oriental Opol Misamis Oriental Pangantucan Bukidnon Tagoloan (MO) Misamis Oriental Region X - Northern Mindanao Region X - Northern Mindanao Region X - Northern Mindanao Region X - Northern Mindanao Region X - Northern Mindanao Region X - Northern Mindanao Region X - Northern Mindanao Region X - Northern Mindanao Region X - Northern Mindanao Region X - Northern Mindanao Region X - Northern Mindanao Region X - Northern Mindanao Second Class First Class First Class First Class Second Class Second Class Second Class Second Class Second Class Second Class First Class First Class
81 Most Improved LGUs : 3 rd 6 th Class Mun. Region 10 LGU Rankings ( ) Overall Rank (2015) Overall Rank (2016) Difference Rank Local Government Province Region Income Classification Clarin (MC) Misamis Occidental Linamon Lanao del Norte Sapang Dalaga Misamis Occidental Cabanglasan Bukidnon Damulog Bukidnon Tudela (MC) Misamis Occidental Lopez Jaena Misamis Occidental Sumilao Bukidnon Initao Misamis Oriental Baroy Lanao del Norte Sinacaban Misamis Occidental Bacolod (LN) Lanao del Norte Region X - Northern Mindanao Region X - Northern Mindanao Region X - Northern Mindanao Region X - Northern Mindanao Region X - Northern Mindanao Region X - Northern Mindanao Region X - Northern Mindanao Region X - Northern Mindanao Region X - Northern Mindanao Region X - Northern Mindanao Region X - Northern Mindanao Region X - Northern Mindanao Fourth Class Fifth Class Fifth Class Third Class Fourth Class Fourth Class Fourth Class Fourth Class Third Class Fourth Class Fifth Class Fourth Class

82 NEXT STEPS ECONOMIC DYNAMISM GOVERNMENT EFFICIENCY SUSTAINABLE COMPETITIVENESS INFRASTRUCTURE RESILIENCE
83 Resilience as a Pillar It will measure how local governments have prepared their locations, environment, firms and people to respond to different kinds of shocks to ensure sustainability of their growth. Resilience is equivalent to sustainability beyond natural and man-made disasters 83
84 84
85 Resiliency Indicators Organization and Coordination: Land Use Plan Organization and Coordination: Disaster Risk Reduction Plan Organization and Coordination: Annual Disaster Drill Organization and Coordination: Early Warning System Resiliency Financing: Budget for DRRMP Sub-indicators Presence of Comprehensive Land Use Plan (CLUP), unit to implement, staff and local ordinance for implementation; age of CLUP (from Governance Pillar) Presence of Disaster Risk Reduction Management Plan (DRRMP), unit to implement, permanent staff and local ordinance for implementation (from Governance Pillar) Conduct of LGU-wide disaster drill (date of latest drill) Presence of early warning system that integrates professional responders and grassroots organization Ratio of budget for DRRMP to total LGU budget; Contingency fund for disaster as % of total LGU budget (from Governance Pillar)
86 Indicators Resiliency Reports: Local Risk Assessments Resiliency Infrastructure: Emergency Infrastructure Resiliency Infrastructure: Utilities Resilience of System: Employed Population Resilience of System: Sanitary System Sub-indicators Availability of local Geohazard Maps from DENR; LGU Risk Profile from DSWD Number of ambulance, firetrucks, bulldozer, rubber boats, public infrastructure for evacuation; (Public and Private), Presence of drainage systems in LGU Center Presence of Water Source; Distance of Water Source to LGU; Presence of Power Source; Number of Power Source to LGU, Presence of Generator Sets, Redundancy (more than 1 source of power, water, telecom, road, fuel) Share of Gross Number of Employees to Total Population of LGU, (Public (Emloyed by the LGU)+ Private(Based on BPLS)) Presence of a Sanitary Landfill; Distance of Landfill to LGU Center; Frequency of Garbage collection per month; Practice of Waste Segregation, Recycling/ Material Recovery Facility

87 Scoring
88 Scoring To standardize the computations, the standard formula for the human development index was adopted: Actual value(x) - Minimum Value (x) Maximum value (x) - Minimum value (x) The resulting value is then multiplied to the identified weight per indicator. NOTE: Some data, such as those requiring a yes or no answer or growth rates, were subject to a special scoring system so they could be reflected in the rankings. 88
89 Scoring (NCC Score Sheet) Size of Local Economy: Total Annual Business Registrations (2013 Data) City DATA Rank 215 Minimum Value 64,515 Maximum Value Sub-indicator Index Score Index Value Sub Indicator Index Score Quezon City (max value) 64, Manila City 56, Makati City 35, Davao City 33, Palayan City (min value) Bais City (no data) NDA
90 Scoring (NCC Score Sheet) Score: Size of Local Economy Gross Sales INDEX SCORE City Registratio ns Capital Permits Makati City Mandaluyong City Marikina City Quezon City Manila City San Fernando City RANK (LU) Davao City Cebu City Navotas City Cagayan de Oro City
91 Scoring (NCC Score Sheet) City Paranaque City Size Score Makati City Manila City Naga City (CS) 9 General Santos 4 City Mandaluyo ng City 8 Valenzuela City 7 Caloocan City 3 Growth Score Jobs Score Cost of Living Score Financial Productiv Institution ity Score s Score Busines s Groups Score Cost of Doing Business Score Economi c Dynamis m Total RANK
92 Scoring (NCC Score Sheet) City Province Region Makati City Cagayan de Oro City Naga City (CS) Davao City Marikina City Iloilo City Cebu City - Misamis Oriental Camarines Sur Davao del Sur - Iloilo Cebu National Capital Region Region X - Northern Mindanao Region V - Bicol Region Region XI - Davao Region National Capital Region Region VI - Western Visayas Region VII - Central Visayas Governm Economic Dynamism RANK ent Efficiency RANK Infrastruct ure RANK Overal l RANK


93 PROVINCIAL RANKING Qualification and Methodology
94 Qualification of a Province There will be two qualifying measures for the provincial ranking: -60% of the Provincial Population and -90% of the LGUs in the Province shall be covered Highly Urbanized Cities shall now be excluded in the computation of provincial scores. 94

95 Provincial Scoring -For qualified provinces, the score is calculated as the population and income weighted average of the LGUs covered. -Aggregate scores of LGUs covered. -Scores are based on overall scores of participating Cities (except HUCs) and Municipalities in the province and not the category scores. 95

96 Sample Provincial Scoring 96
97 What to expect in #CMCI2017? 97


98 CMCI2017 ranks local governments on 5 different categories Highly Urbanized Cities Component Cities 1 st to 2 nd Class Municipalities 3 rd to 6 th Class Municipalities PROVINCES 98

99 CMCI2017 also recognizes Most Improved Cities and Municipalities Highly Urbanized Cities Component Cities 1 st to 2 nd Class Municipalities 3 rd to 6 th Class Municipalities 99
 Highly Urbanized Cities (15) Component Cites (15) 1 st and 2 Class")
 1 st Place Most Competitive City OVERALL COMPETITIVE NESS")
100 A total of 75 awards will be given to the best performing local governments Categories Provinces (3) Highly Urbanized Cities (15) Component Cites (15) 1 st and 2 Class Cities (15) 3 rd to 6 th Class Municipalities (15) Most Improved Cities (6) Most Improved Municipalities (6) 1 st Place Most Competitive City OVERALL COMPETITIVE NESS CATEGORY 100
101 you cannot manage what you don't measure Peter Drucker 101
102 Measurement is the first step that leads to control and eventually to improvement. If you can t measure it, you can t understand it, If you can t understand it, you can t control it. If you can t control it, therefore you can t improve it H. James Harrington 102
103 CONCLUSION MEASUREMENT=IMPROVE MENT 103 NCC Philippines
104 M O N I TO R I N G A N D E VA L U AT I O N CUSTOMER FOCUS
105 BUSINESS PERMITS AND LICENSING SYSTEM As of December 2016, 1,422 out of 1,516 LGUs (excluding ARMM LGUs) reported to have completed and undergo BPLS streamlining program. For its part, the National Competitiveness Council (NCC), in partnership with DTI Regional/Provincial Offices annually conducted two kinds of BPLS surveys as follows: (1) Field Monitoring and Evaluation Survey and (2) Customer Experience Survey for Renewal of Mayor s Permits.
106 BUSINESS PERMITS AND LICENSING SYSTEM Last August 30, 2016, a new Joint Memorandum Circular (JMC) on Revised BPLS Standards was signed by Department of the Interior and Local Government (DILG), Department of Trade and Industry (DTI), and Department of Information and Communications Technology (DICT) in compliance with the administration s pronouncement to further streamline business permitting procedures in all cities and municipalities.


107 OLD vs NEW BPLS STANDARDS PROCESSING TIME JMC 2010 JMC 2016 New : 10-5 days Renewal : 5 days or less New : 1 2 days Renewal : 1 day or less NUMBER OF STEPS Max of 5 steps for New and Renewal of business registration Max of 3 steps for New and Renewal of business registration NUMBER OF FORMS Unified Form Unified Form (Print and Electronic document) NUMBER OF SIGNATORIES Max of 2, Mayor and Treasurer/BPLO Max of 2, Mayor and Treasurer/BPLO with alternatives
108 BPLS FIELD MONITORING AND EVALUATION SURVEY
109 SURVEY OBJECTIVES As part of the Good Governance and Anti-Corruption Cluster (GGAC) initiatives under the present administration. The survey was commissioned by the National Competitiveness Council (NCC) through the regional and provincial offices of the Department of Trade and Industry (DTI) and local academe to: determine the profile of the businessmen in selected LGUs who applied for new and renewal of business permits; determine the compliance rate of the selected LGUs in terms of the BPLS standards set for both new and renewal process; ensure the implementation of the Nationwide Streamlining of BPLS Program through performance and customer feedback.

 Based on the list of LGUs submitted by DILG-LGA [reported to be")
![compliant] was provided to all regional focal person.](/docs-images/94/120064689/images/110-3.jpg "A sample size of 20 respondents [10 for new and 10 for renewal] per")
110 SURVEY METHODOLOGY The survey was conducted by local academe through triangulation method as follows: INTERVIEW FOCUS GROUP DISCUSSION SECONDARY RESOURCES (Articles, Circulars, etc.) Based on the list of LGUs submitted by DILG-LGA [reported to be compliant] was provided to all regional focal person. A sample size of 20 respondents [10 for new and 10 for renewal] per LGU was determined in the conduct of the survey.
 Processing Time 90% 78% 10% 22% 93% 80% 7%")


111 NATIONWIDE COMPLIANCE RATE 2014 NEW RENEWAL 2015 NEW RENEWAL A R E A (Example) Processing Time 90% 78% 10% 22% 93% 80% 7% 20% CAR, IX VII, VIII 58% 65% 72% 73% CAR, I Procedures/Steps 42% 35% 28% 27% VII, XII 59% 58% 69% 69% CAR, I, II, and XII Unified Form Signatory 41% 42% 86% 85% 14% 15% 31% 31% 90% 89% 10% 11% IV-B, V, VI, VII, AND VIII CAR, I, II, and XII
112 BPLS CUSTOMER EXPERIENCE SURVEY
113 SURVEY OBJECTIVES To assess the experience of the businessmen who renewed their Mayor s Permit in the renewal period of January to February 2016 To determine the satisfaction level of businessmen based on the CSI framework with the process of renewing their Mayor s Permit in their respective local government units (LGUs) To encourage/facilitate private sector participation in the conduct of the survey through institutional support and active engagement in BPLS activities
114 SURVEY METHODOLOGY The survey was composed of two (2) parts: Business Profile of Renewals; Assessment of the renewal process in terms of BPLS Standards (Based on JMC no.1 s. 2010); Customer Satisfaction Index (CSI) Framework The framework of the BPLS CES is based on the American Customer Satisfaction Index (ACSI), a customer-based measurement system for evaluating and enhancing a performance. A set of indicators such as customer s expectations, perceived quality, perceived value for money, and overall satisfaction comprise the BPLS CSS index or score.
115 SURVEY METHODOLOGY Customer Satisfaction Indicators 1. Expectations of the overall quality of the renewal process 2. Services of the LGUs considering all expectations 3. Speed of the renewal process 4. Number of steps involved 5. Number of signatures affixed to the business permit 6. Number of forms issued by the LGU to facilitate the renewal process 7. Delivery of the services of the BPLO frontliners 8. Cost of fees paid to renew business permit 9. Overall quality of the renewal process this year 10. Overall quality of the renewal process last year

116 COMPLIANCE RATE: Renewal Period J A N T O F E B J A N T O F E B 2016 CHANGE Processing Time 89% 11% 88% 12% 1% Procedures/Steps 77% 22% 80% 20% 3% Unified Form 73% 27% 71% 29% 2% Signatory 86% 14% 85% 15% 1%

117 THANK YOU! Fb.com/compete.philippines