A software tool to support farmers decisions on Ecological Focus Areas
|
|
|
- Elinor Oliver
- 5 years ago
- Views:
Transcription
1 A software tool to support farmers decisions on Ecological Focus Areas Ref: JRC/IPR/2014/H.4/0022/NC Dr John Tzilivakis & Dr Doug Warner Agriculture and Environment Research Unit (AERU) University of Hertfordshire, UK 23 October 2015 GAEC Greening Workshop, Prague
2 EFA Calculator Project Project commissioned by JRC: Title: Guidance and tool to support farmers in taking aware decisions on Ecological Focus Areas Reference: JRC/IPR/2014/H.4/0022/NC Duration: January-September 2015 (currently being finalised) Aim: To develop a software tool that helps farmers identify the most ecologically sound and pragmatic solution for implementing Ecological Focus Areas (EFAs) Objectives/functions of the software: Calculate the contribution of different farm features to meeting the 5% EFA target (including checking implementation rules) Calculate the potential impact of different features on ecosystem services, biodiversity and management Guide farmers towards features which offer the greatest potential benefits (minimising burdens & maximising benefits)
3 The key challenges Calculate the contribution of different farm features to meeting the 5% EFA target Relatively straightforward Although collating all the implementation rules across the EU has been difficult Calculating the potential impact of EFA features is more difficult: 15 to 20 different type of features/land uses Across the EU-28 Many different spatial and ecological contexts


4


5

6


7


8 EFA Calculator software
9 Literature review 350+ papers & reports guides were collated and reviewed The synthesis report structured using the 19 EFA elements This formed the foundation for the EFA calculator software However, this knowledge needed to be structured into to a set of criteria and rules that could be embedded in the database that underpins the software An impact assessment was required
10 Impact assessment Used a relatively simple scoring approach to capture a range of complex information Examined the knowledge and identified the key parameters (and classes) that affect the potential impact of EFA features on ecosystem services, biodiversity & management e.g. Soil texture: Coarse, Medium, Medium fine, Fine, Very fine e.g. Hedgerow cutting season: Winter, Spring, Summer, Autumn Impact scores have been derived for all combinations of parameter classes, for each feature, for each impact 230 feature-impact combinations, characterised using 138 different parameters containing 708 parameter classes
11 Scoring impacts Two approaches: 1. A semi-quantitative approach, which draws upon metamodelling. A score is awarded for each possible combination of parameters, based on modelled results 2. A qualitative (risk factor) approach, where scores are awarded for each class, then the scores for the classes selected are summed and weighted for each parameter The semi-quantitative approach has the advantage that all impacts are comparable across features. The qualitative approach requires a cross feature calibration (CFC) (weighting) factor to be applied to each feature-impact to determine the relative significance of the impact of two or more features All scores normalised to a -100 to +100 scale, to reflect negative and positive impacts
12 Overview of scoring approaches Approach 1 Feature X Approach 2 Impact A Impact B Parameter 1 Parameter 2 Parameter 5 Parameter 7 (W: 20) Parameter 9 (W: 10) Class A Class D Class G Class J (5) Class M (-10) Class B Class E Class H Class K (10) Class N (10) Impact B Class C Class F Class I Class L (20) Class O (5) Feature X (CFC = 1) Feature Y (CFC = 0.5) Value based on combination of classes selected: A-F-G = 10 A-F-H = 15 A-F-I = 10 Value based on sum of class scores and weighting factor for each parameter Impact Score = class score Parameter weight (Parameter weights)
13 Impact categories Ecosystem services: uses the Common International Classification of Ecosystem Services (CICES) system (Haines-Young & Potschin, 2013) Biodiversity: uses the European Nature Information System (EUNIS) species groups (EEA, 2015) Management: currently limited to potential impacts on labour only Impacts are aggregated using the CICES hierarchy for ecosystem services (Section > Division > Group > Class) (and a similar approach for Biodiversity) EEA (2015b) EUNIS Groups. European Environment Agency (EEA). (Last accessed: 05/06/2015) Haines-Young, R. and Potschin, M. (2013) Common International Classification of Ecosystem Services (CICES): Consultation on Version 4, August-December EEA Framework Contract No EEA/IEA/09/003
14 Impact matrix for fallow land Ecosystem services Biodiversity Mass stabilisation and control of soil erosion Nitrate leaching Pest control Phosphate run-off Pollination and seed dispersal Parameters None (bare soil) 0 Adjacent vegetation structure Natural regeneration 67 Adjacent water bodies quality Adjacent wildlife corridors Sown bird seed mix 5 Annual rainfall Sown wildflower 35 Distribution density of adjacent Sown grass only 67 water bodies Field size Ground cover (fallow) Old trees or buildings present within 1 km² Slope Soil texture South aspect Topography Amphibians Bats Birds of prey Flowering plants Insectivorous birds Pollinating invertebrates Parameter classes Reptiles Seed eating birds Score Small mammals (mice, shrews, voles) Soil surface invertebrates
 fully protected under European legislation: Bern")


15 Impact on biodiversity - Habitat Suitability Index (HSI) Great crested newt (Triturus cristatus) fully protected under European legislation: Bern Convention 1979: Appendix III EC Habitats Directive 1992: Annex II and IV Conservation (Natural Habitats etc.) Regulations 1994: Schedule 2 Development of a robust indicator of habitat quality ARG UK (2010) Oldham R.S., Keeble J., Swan M.J.S., Jeffcote, M. (2000)
")

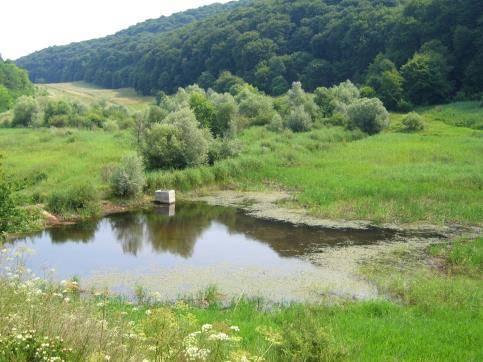
16 1 km2 Habitat Suitability Index (HSI) 250 m radius Pond boundary Suitability index Ponds per km2
17 Habitat Suitability Index (HSI)


18 Habitat Suitability Index (HSI) Spatial scale: 250 m Presence of EFA elements within this area


19 Habitat Suitability Index (HSI)

20 Habitat Suitability Index (HSI)
21 The EFA calculator software A standalone Windows application, with three core functions: 1. To calculate the contribution of different farm features to meeting the 5% EFA target (including checking implementation rules) 2. To calculate the potential impact of different features on ecosystem services, biodiversity and management 3. To steer farmers towards features which offer the greatest potential benefits (with respect to minimising burdens and maximising benefits) Freely available to download from: Two points to clarify before the demonstration
 Buffer strips (Other) Agroforestry Strips along forest edges (NO PRODUCTION) Strips along forest edges (WITH PRODUCTION)")
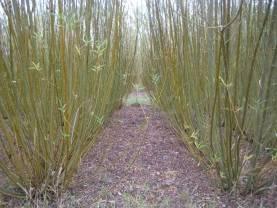
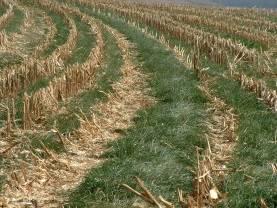
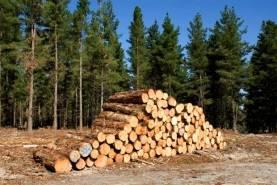
22 EFA elements & farm land and features EFA Element Fallow land Terraces Hedges or wooded strips Isolated trees Trees in line Trees in groups and field copses Field margins Ponds Ditches Traditional stone walls Other landscape features Buffer strips (GAEC1, SMR1 or SMR10) Buffer strips (Other) Agroforestry Strips along forest edges (NO PRODUCTION) Strips along forest edges (WITH PRODUCTION) Short rotation coppice Afforested areas Catch crops or green cover Nitrogen fixing crops Farm land and features Fallow land Terraces Hedges or wooded strips Isolated trees Trees in line Woodland Land strips (adjacent/parallel to water) Land strips (other) Hedges or wooded strips Ditches Ponds Land strips (adjacent/parallel to water) Ditches Traditional stone walls Ancient monuments Ancient stones Archaeological sites Garrigue Hedges or wooded strips Isolated trees Natural monuments Ponds Terraces Field margins in Scotland, UK Land strips (adjacent/parallel to water) Land strips (other) Agroforestry Land strips (other) Land strips (other) Short rotation coppice Woodland Catch crops or green cover Nitrogen fixing crops
23 Impact icons Conscious decision not to present potential impacts using numerical data within the software, reasons being: The impact scores are relative impact indices and do not use any established units the use of numbers could be interpreted differently or imply an incorrect level of precision To provide a more visual means of communicating impacts Icons for impact categories and indicator bars to reflect positive and negative impacts
24 Overview of the EFA software interfaces New file creation wizard Land and feature manager EFA assessment New feature ranking tool Welcome screen Report builder Settings and options 'Show Me' help centre
25 EFA Calculator Software demonstration
26 EFA Calculator Version currently available Contact: