Prioritizing restoration activities for salmonid habitat within a watershed
|
|
|
- Letitia Sarah Butler
- 5 years ago
- Views:
Transcription
1 Prioritizing restoration activities for salmonid habitat within a watershed Author: Lisa Lackey Co-author: Laurel Marcus Abstract Maacama Creek, a tributary of the Russian River has 45 miles of tributary creeks and 70 sq mile drainage basin. In order to prioritize the most effective types of restoration projects for improved salmonid habitat, an integrated approach was taken to evaluate the entire watershed. The condition of a creek is a culmination of past and present watershed conditions and natural features. The watershed assessment was done using a wide variety of GIS layers, coupled with interpretation of historical aerial photography. Photographs from and 2000 were georeferenced using the Georeferencing tool in ArcMap and used to compare watershed and creek features. Photointerpretation documented changes over time in vegetation, roads erosion, sites and riparian corridors, which are limiting factors to fish populations. Understanding watershed conditions currently and historically creates an understanding of where effective projects could be implemented to restore the system for salmon habitat. Introduction and Background In Sonoma County, California, Laurel Marcus & Associates, working under contract with the Sotoyome Resource Conservation District, has been developing watershed analyses of various tributaries of the Russian River. The purpose of these analyses is to prioritize restoration activities to identify the most effective use of funds for salmonid habitat restoration. Since fish habitats in creeks are a culmination of watershed processes, the condition of the entire watershed was evaluated. One such watershed assessment was completed for the Maacama Creek Watershed. It investigated and evaluated current and historic conditions of the Maacama Creek watershed then recommended a prioritized set of actions and programs to improve water quality as well as riparian and aquatic habitat conditions, integrated with continued monitoring and assessment. Maacama Creek is a major tributary of the Russian River, and its watershed encompasses nearly 70 sq miles of land, with 45 miles of tributary creeks and 7 major tributary subbasins. The conditions evaluated were: the current and historic condition of creek channels, the historic and current condition of watershed, vegetation and vegetative clearing, extent of riparian forest, watershed land use and erosion sources of fine sediment in the watershed. Methodology The analysis was accomplished using ArcView 9.0 with the Spatial Analyst extension. In order to evaluate changes in the watershed, historic aerial photographs from 1942 and 1961 were obtained from the Natural Resource Conservation Service (NRCS) in
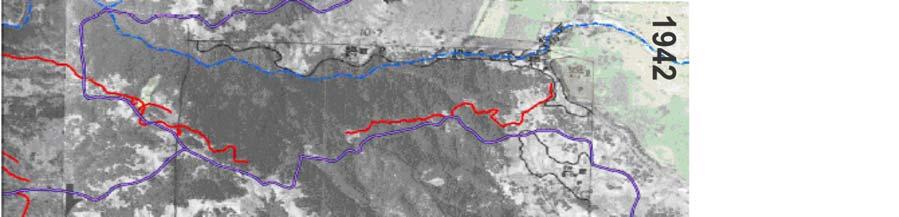
2 Petaluma. Although these photographs did not cover the entire watershed, a large portion of the watershed could be seen in the set of photos available. These were scanned and georeferenced using Sonoma County digital orthophotography from 2000 as the reference data. Georeferencing was performed using the ESRI ArcMap Georeferencing tool. From these georeferenced aerial photos, the following layers were created for 1942, 1961 and 2000: Vegetative clearing for agriculture and timber harvest Watershed roads Extent and density of riparian corridor Caution must be used with this technique, since the ArcMap Georeferencing Tool does not provide an orthorectified image product. The more mountainous an area, the more of an offset results between the historical georeferenced image and the orthorectified image. We digitized several areas in both sets of imagery and the orthorectified imagery, where we could recognize the area as being the same in the different datasets. These test areas were roughly the same size as the cleared areas. We found that the same area digitized in a historic georeferenced image calculated a different acreage than the same area in the orthorectified image, but the acreages were +/- 10% of the orthorectified acreage, even in the more mountainous areas of this watershed. Digitizing lines, such as roads, we came within +/-6% of the orthorectified image. When comparing acreages and lengths between the dates, this is an important consideration. To evaluate the current condition of the watershed, the following layers were needed: streams, stream confinement, stream slope, riparian corridor width and extent, geology, roads within the watershed, areas in excess of 30% slope, vegetation, fire extent and year, and stream monitoring sites. These were acquired from the NOAA/Circuit Rider Russian River GIS, USGS, California Department of Forestry (CDF) and created in house from Sonoma County s orthophotography. Also, California Department of Fish and Game had performed habitat surveys in each sub-basin that depicted levels of siltation within the creeks. Results We were able to visually assess the changes that had taken place from 1942 to 1961 to 2000 without having to flip through hardcopy photos and spending time locating the same place on the photo, which can be very challenging with the many land cover changes that have occurred in this watershed over this time period. In 1942, there was little forestry activity because of the Great Depression. From the 1870s to 1910, quicksilver mining had been prevalent in the region. The mines required large coniferous timbers for mining shaft development and burned 6-7 cords of hardwood a day for processing. The forests that had been cut for lumber and mining, using manual saws and oxen in the 1800 s had re-grown. Grazing on hillsides and conversion of valley and riparian areas to agriculture in the 1800s had a broader long-term effect of removing riparian and seasonal wetland habitats and, on hillsides, of increasing erosion potential. The 1942 aerial photographs depict dense coniferous forest in many areas of the
3
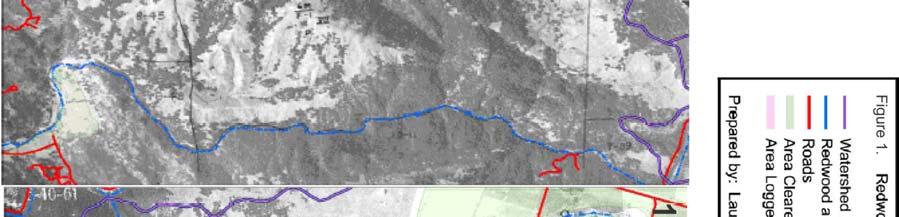
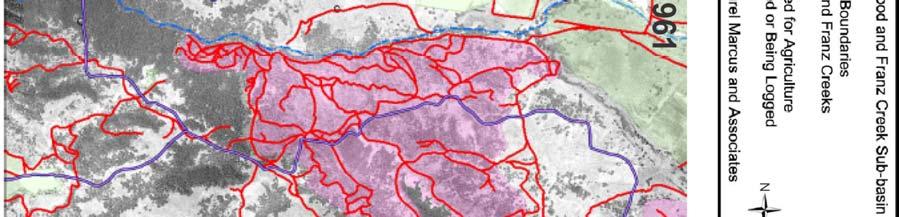
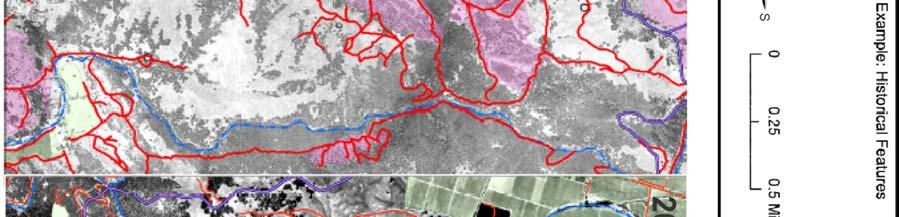
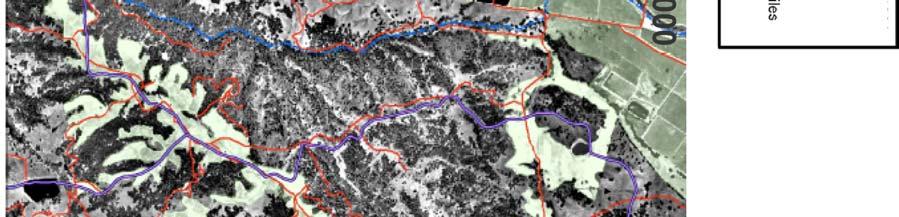
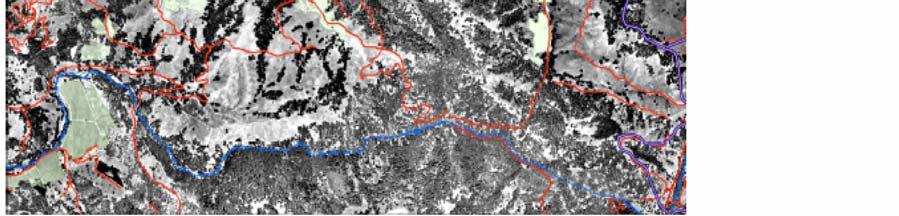
4 Maacama Creek watershed. The 1961 aerial photographs show widespread logging, vegetation clearing and road-building. The 2000 aerial photographs and CDF digital layer of vegetation types show that many of the areas that were clear-cut logged in 1961 have not regenerated coniferous forest, but have re-grown as hardwood forest. Additionally a relatively few roads have been added since the flourish of road building in the 1961 photos. (See Figure 1) Although it was very apparent visually, digitizing these areas allowed evaluation of numbers (Table 1). These numbers show a significant trend over the years evaluated, even though they may have some inaccuracy, as noted earlier. Table 1. Areas of cleared vegetation and roads from 1942 to 2000 Miles of Year Acres of Cleared Vegetation Miles of Road Road /sq Mile of Watershed , , , These numbers were also evaluated at the sub-basin level so that sub-basin recommendations could be made. Insights found Changes in Coniferous Forest Cover An evaluation was made of the vegetation today, as mapped by CDF, with the cleared and logged areas seen in the historical photos and the CDF mapped fires that have occurred since the 60s. It showed that most of the coniferous forest occurs today where there were no fires following the logging in the 50 s and 60 s. In areas where this sequence of logging, fire and flooding from the 1960s occurred, much of the conifer forest has re-grown as hardwoods. Additionally, the CDFG stream surveys show a low level of riparian canopy and, in the case of one of these creeks, relatively warm water temperatures and high siltation. The one area on this same creek with high levels of riparian cover and relatively cool water temperatures coincides with an area of coniferous forest that was not logged in the 1960s. Hardwood species do not typically grow as tall or have as dense vegetation as conifers, and for confined channels especially, do not provide the same level of shading. The results of the watershed assessment clearly demonstrate the need for reforestation of slopes to improve creek conditions in many areas. A field review based on today s condition may not come to the same conclusions and result in in-stream or bank stabilization projects which do not address the true cause of the habitat degradation. Logging in the 1960s Greatly Increased Road Densities For all of the sub-basins with historic aerial photograph coverage, the density of roads doubled, and in some areas more than tripled, between 1942 and Road networks
5 are concentrated in coniferous forest areas. Most of the roads visible in the 1960s are still visible in 2000 and, in most sub-basins, more roads have been built since Of the seven major creeks, CDFG surveys show relatively high siltation levels in the entire length of one, large parts of two other creeks and a few areas of two additional creeks. Unmaintained dirt roads, especially on steep slopes and those originally designed for temporary use for logging, are well documented sources of fine sediment and represent a major potential source of degradation for streams (Reid and Dunne 1984, North Coast Regional Water Quality Control Board, 1988). The hydrological evaluation of the Maacama Creek watershed identified the high likelihood of debris flows in many of the steep areas of the drainage during high rainfall events (Hunrich et al., 1998). Roads on steep slopes can increase the likelihood of debris flows, landslides and other mass movements and should be addressed as a first priority. While road repair and decommissioning is often done as part of habitat improvements, most projects are opportunistic and based on interest from a landowner, rather than directed by a prioritized plan. Current Hillside Disturbance from Vineyard and Rural Residential Housing Development is Less in Most Sub-basins that the 1960s The cumulative acres of clearing are much lower in 2000 than 1961 in the areas studied. The one exception to this is the Maacama Creek sub-basin where hillside vineyard development is more widespread. Because hillside development is regulated by both Sonoma County and the CDF, the environmental impacts of vineyard development in 2000 are less than those of the 1960 s logging and clearing. Riparian Corridors Have Largely Remained Stable in Size and Extent Riparian vegetation and corridor size were delineated for the unconfined channel reaches in the 2000 imagery and then compared to the available aerial photographs of 1942 and The corridors on most creeks were the same size in 2000 as the earlier 1942 or 1961 photographs. These areas were developed for agriculture in the 1800s and the riparian floodplain was cleared, leaving a narrow band of riparian forest in most locations. One creek, Redwood Creek, is an alluvial fan of high slope. As such, its vegetation differs from the linear streamside corridor seen on other creeks. In 1942, Redwood Creek had a dense, but scattered forest covering a wide swath near the creek. The vegetation distribution did not follow the creek channel and, in fact obscures it. As agricultural development in the main agricultural valley of Redwood Creek has continued, Redwood Creek has been channelized and much of the broad swath of scattered vegetation has been cleared. Only a narrow single thread of creek corridor remains. However, the attempt to change the creek to look like a low-slope, meandering valley stream does not change its function as an alluvial fan. The Redwood Creek channel is composed of cobble and gravel. In large flood events, particularly those where debris flows occur, the Redwood Creek alluvial fan will likely move cobble and gravel to the valley and deposit bedload into the fan by changing channel locations and undergoing typical alluvial fan processes. In these flood events, the current channelization of the Redwood Creek channel will likely have little effect on the direction of flow and depositional processes of the fan.
6 Conclusion and recommendations Recommendations by sub-basin were given in the assessment for restoration actions. These recommendations were prioritized to address tributary areas with the apparent lowest levels of watershed disturbance first. The disturbances were from logging, vegetation clearing, road building, extensive wildfires and major floods, which mostly occurred in the 1960 s and could be seen in the historic photography. High priority areas are areas where creeks have adequate cold water for summer rearing, but need projects either to increase riparian cover or reduce siltation. These sub-basins generally coincide with areas of less vegetation clearing and no major fires. Medium priority areas were identified where creeks have higher temperatures and generally coincide with areas that have had extensive vegetation clearing and fires and coniferous vegetation has been replaced by hardwood. Lastly, low priority areas are the bottom of the watershed where fish spawning habitats are severely degraded due to upstream warm waters and sediment from other sub-basins upstream. The water is being warmed upstream by lack of coniferous forest cover, and the sediment is being carried downstream to this area from the sub-basins with the legacy of fires and vegetation clearing of the 1950 s and 60 s. This lower area would be treated for fish passage only. ArcView 9.0 gave us the ability to see the watershed as it changed throughout time over the last 60 years. Being able to view the exact same spot as it looked in 1942, 1961 and 2000 gave an understanding of the changes that have occurred and will continue to occur. It helped to pinpoint the true causes of fish habitat degradation. Often fish habitat restoration projects focus on the creek itself, but without addressing the drainage basin, these projects will likely not provide any long term improvement (Roni et al 2002). Instead the focus should be on the watershed first and foremost with revegetation of the creek corridors included. Having a GIS and image overview of the watershed with a historic context is a very helpful tool to analyze watershed condition. References California Department of Forestry and Fire Protection GIS layers vegetation and fires. Hunrich, R.A, David Pratt and Robert W. Meyer, Magnitude and Frequency of the Floods of January 1997 in Northern and Central California Preliminary Determinations, USGS Open-File Report , Laurel Marcus & Associates Maacama Creek Watershed Assessment. National Marine Fisheries Service and Circuit Rider Productions, Inc Russian River Watershed Geographical Information System.
7 North Coast Regional Water Quality Control Board Water Quality Control Plan for the North Coast Basin. North Coast Regional Water Quality Control Board. Oakland, CA. Reid, L.M. and T. Dunne "Sediment Production from Forest Road Surfaces." Water Resources Research 20: Roni, Philip. T. J. Beechie, R. E. Bilby, F. E. Leonetti, M. M. Pollock, and G. R. Pess A Review of Stream Restoration Techniques and a Hierarchical Strategy for Prioritizing Restoration in Pacific Northwest Watersheds. North American Journal of Fisheries Management. 22:1-20. Sonoma County ISD/GIS Group Digital Orthophotography. United States Department of Agriculture - Natural Resource Conservation Service. Aerial photographs of Maacama Creek watershed 1942, 1961.