Regulation of water fluxes by dry-land forest ecosystem
|
|
|
- Crystal Price
- 5 years ago
- Views:
Transcription
1 Regulation of water fluxes by dry-land forest ecosystem Weizmann Institute of Science Eyal Rotenberg, Gabriel Schiller*, Tongbao Lin,, Kadmiel Maseyk, Naama Raz Yaseef, Ilya Gelfand, Ruth Ben Mair and Dan Yakir * The Volcani Center, Bet Dagan Support: EU, KKL, GLOWA-JR, BSF, ISF, IALC, Minerva-Avron

2 South and East Mediterranean countries are relatively poorly forested Proportion of forest by countries - percentage of land area (FAO 2000, Global forest assessments) About 17% of the Earth land surface categorized as semi-arid land, and is poorly forested. Forest plantations area at the Mediterranean countries (FAO, 2000) Country Natural forest Forest plantation Plantation /Natural forests/ Count area Country Natural forest Forest plantation Plantation /Natural forests/ Count area K ha K ha % % Morocco Algeria Tunisia Egypt Israel K ha K ha % % Lebanon Syria Turkey Italy Spain Avg forest area: Europe 46%; World 29.6%
: 0.")
3 Study site overlook: o o o o o Annual rain fall: 280 mm Length of the dry season: >200 days Mid day temperature: winter 13, summer 31 0 C Bowen ratio: Jan 1.7, July 13 Aridity factor (precipitation/potential evaporation): 0.18 Forest main properties: Semi-arid afforestation: planted Main vegetation type: Pinus halepensis Canopy height: 10 m LAI: ; DBH: 18 cm Trees density: 300 trees ha -1 Forest area: 2800 ha

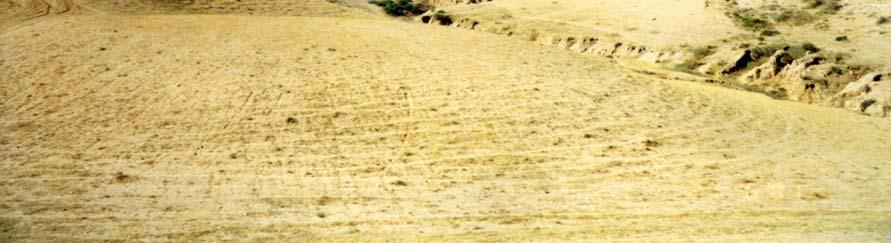


4 The forest and the surroundings area Afforestation preparations (treatment) Over Grazing (untreated)

5 Yatir flux-station is part of a global net-work, covers vest area of climate condition which currently is under-studied. Yatir

 and heat fluxes. Canopy and ecosystem parameters: LAI, litter fall, carbon stock in trees and soil.")
6 Yatir s instrumented tower and main measure variables: Fluxes of CO 2, H 2 O and heat (sensible and latent). Meteorological variables wind speed and direction, temperature, humidity, rain... Radiation fluxes (SWR, PAR and LWR) above and below the canopy. Soil sensors of temperature, water content (up to 1.2 m) and heat fluxes. Canopy and ecosystem parameters: LAI, litter fall, carbon stock in trees and soil... Phonology, foliage and woody tissues activities. Nutrients cycles Others
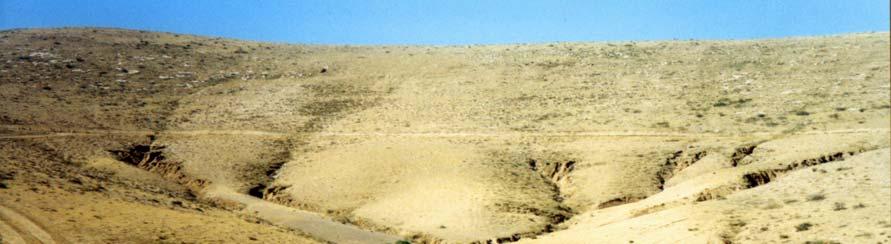
7 Forest eliminating runoff in the Yatir Watersheds During the years : 22 runoff events in the unforested watershed 1 runoff event in the afforested watershed Event December 2002: watershed area km 2 average raindepth mm peak flow m 3 /sec specific discharge m 3 /s km 2 volume m 3 runoff mm runoff coefficient un treated treated afforested Data source: Shmuel Arbal
8 Annual rain fall (P), evapotranspiration (ET) and ET/P during 7 studied years ( ; growing year: Oct. to Sep.) Rain; ET [mm ȳ 1 ] ET/P Growing year 0.00 The forest uses most of the input rain (above 90%), and in dry years part of left over water from previous wetted years. Trees transpire 60% or more of the incoming rain, the rest comes from the soil. Not much water left for other uses!
9 Carbon uptake strongly function of SWC Winter to early spring (Jan.to mid May) is the activity period of the Pine trees. During summer carbon accumulated only at early and late hours of the day. Water availability in soil dominants the ecosystem activities, cf. photosynthesis rate, soil respiration Sequestrated carbon by the forest is around 250 gcm -2 y -1, similar to the European average forests.
10 High water use efficiency (WUE) of the forest ecosystem WUE(GPP) is high all year around and among years: WUE >5 in wet season, ~2 in the dry season. The high WUE is one of the key parameters to explain the success and high productivity of this forest. WUE [gc/kg H2O] Monthly WUE as GPP/DT_ET and 24h NEE/ET; 02-03, and GPP/ET(DT) Nov Feb May MOS Aug Annual rain-fall: wet year (368 mm) wet year (373 mm) drought year (224 mm) GPP NEE GPP NEE GPP NEE Blue line Wet season. GPP - gross primary production (trees) calculated from NEE and scale up respiration measurements. ET ecosystem (trees, understory & soil) evapotranspiration.
11 Tree rings isotopes study at Yatir and northern forests in Israel reveals higher water use efficiency (Assimilated carbon/water loss) with time (Angart, Yakir et al.,): It is possible that the atmospheric CO 2 raises during the last 250 years (280 to 380 ppm) enables the establish and the well developed of the Yatir forest in such harsh conditions

 With global climate change scenarios and possible extend of dry conditions into humid areas, results from Yatir teach us of the")
12 Conclusions Semi-arid areas occupied about 17% of the Earth land surface, the success of forest like Yatir shows the potential of expanding afforestation activities into those areas. Carbon sequestration potential by forests at dryland area is high, and if apply even in small areas could pass redactions proposed by other mechanisms. Any afforestation efforts in drylands should also consider aspects as: effects on water yield, feedbacks on climate, influences on biodiversity and also social and economical aspects (e. g., source for wood-fire, grassing activities, tourism ) With global climate change scenarios and possible extend of dry conditions into humid areas, results from Yatir teach us of the implications and the management tolls for those areas in the future.
13 Thanks
14 Annual sequestrated carbon (from atmosphere) by the forest ecosystem. The net gain carbon by the forest is the difference between vegetations CO 2 assimilation to respiration by the ecosystem (soil and vegetation). This measured directly and constantly by the instruments at the tower top. Carbon takes by the vegetation (as CO 2 ) reduces the rate of accumulated CO 2 in the atmosphere due to fusel fuel burnings. Growing season Units Rainfall (KKL)* mm Evapotranspiration mm 190 NA Net Carbon gain (NEE) gc m Growing season: October September years average carbon uptake by the forest gc m -2. European average ~ 260 gc m -2. Annual rainfall during the study years was somewhat above the long term average 310 vs. 284 mm y -1
15 Additional emerging results: Trees likely to consume about 70 80% of the incoming rain, the rest probably evaporates from understory and the soil (Raz Yaseef, et al., Schiller et al.,). About 850 ± 164 gc m -2 y -1 is the amount of carbon trees are assimilating (GPP, Maseyk et al.,) Respiration of CO2 from soil is at about 404 ±40 gc m -2 y -1 (Gruewnzweig et al.,) and about 300 ±30 gc m -2 y -1 from the trees (Maseyk et al.,). Nitrogen is not a limiting factor for the trees growth (Galfend at al.,) While net uptake of CO 2 from the atmosphere act to cool the Earth, the lower refelctivity of sun lights by the forest acts to warm the surface. At first the heating process dominates, only later after ~50+ years, the process of CO2 reduction from atmosphere seems to dominates. And many more