Assessing Your Local Urban Forest. David J. Nowak USDA Forest Service Northern Research Station Syracuse, NY
|
|
|
- Raymond Wilfred Bailey
- 5 years ago
- Views:
Transcription


1 Assessing Your Local Urban Forest David J. Nowak USDA Forest Service Northern Research Station Syracuse, NY 1
2 Measurement is Critical Structure Function Value 2

3 Assessing Urban Forests Top-down approach Aerial-based Bottom-up approach Ground-based 3
 Statistical sample Same types of data from aerial, plus: Species Condition Sizes Number of trees Local, specific benefits")
4 Data Collection Aerial Spatial cover data; available space Limited information (cover types; heights) Ground-based Limited geography of data (unless inventory) Statistical sample Same types of data from aerial, plus: Species Condition Sizes Number of trees Local, specific benefits 4
 Photo-interpretation")
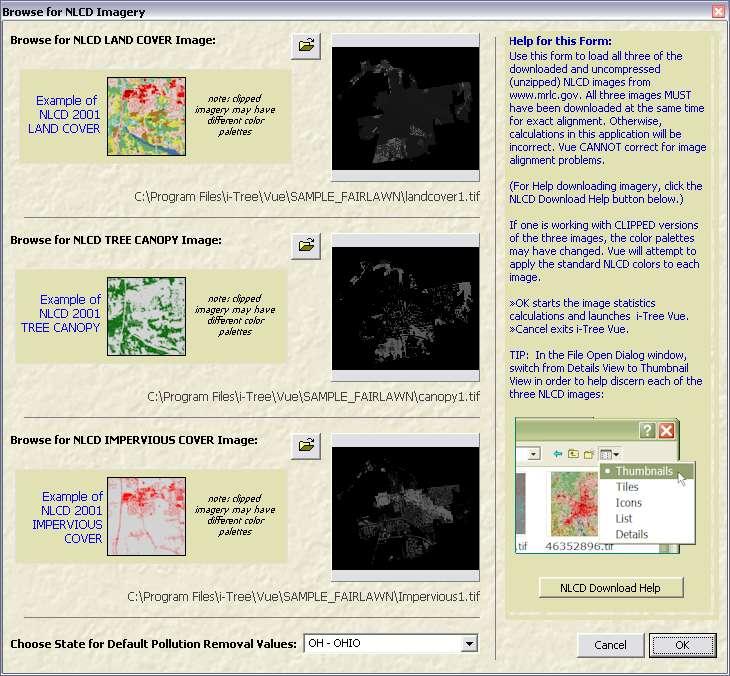
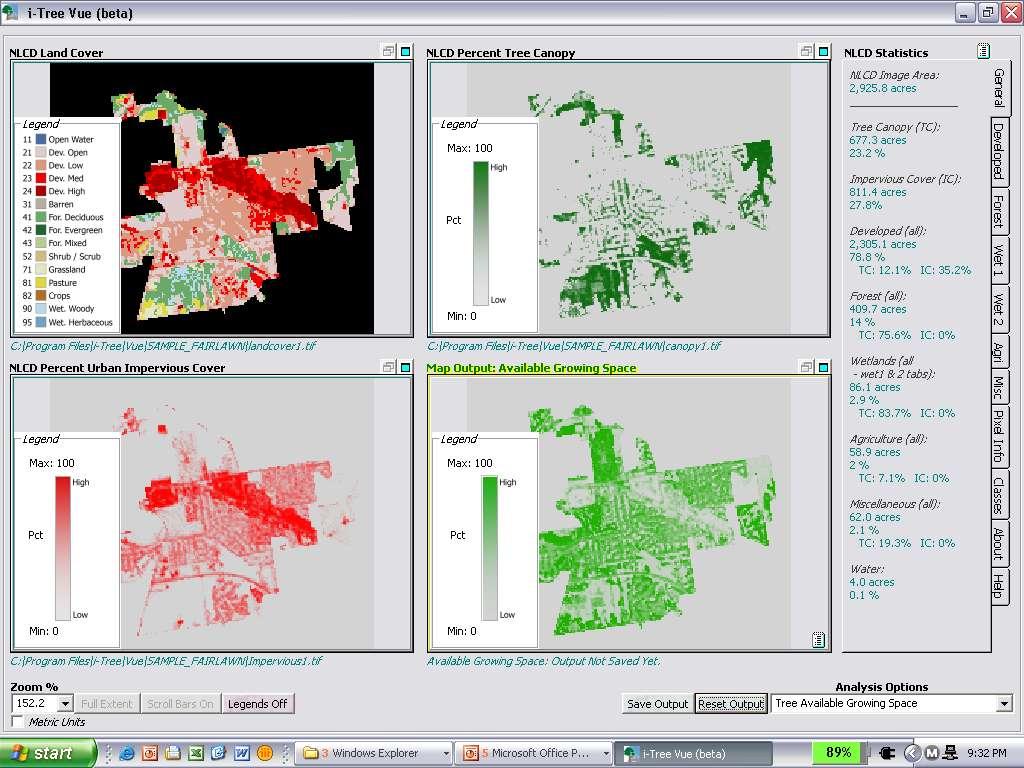
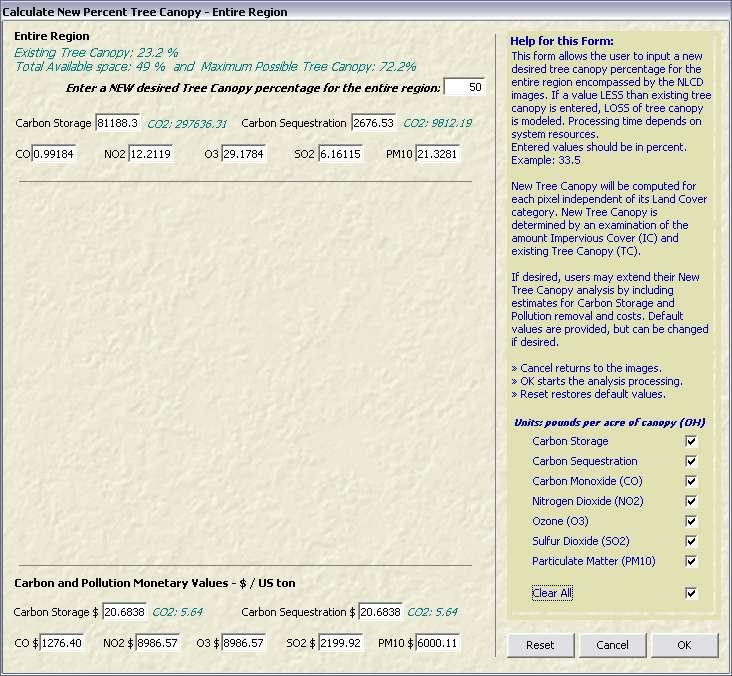
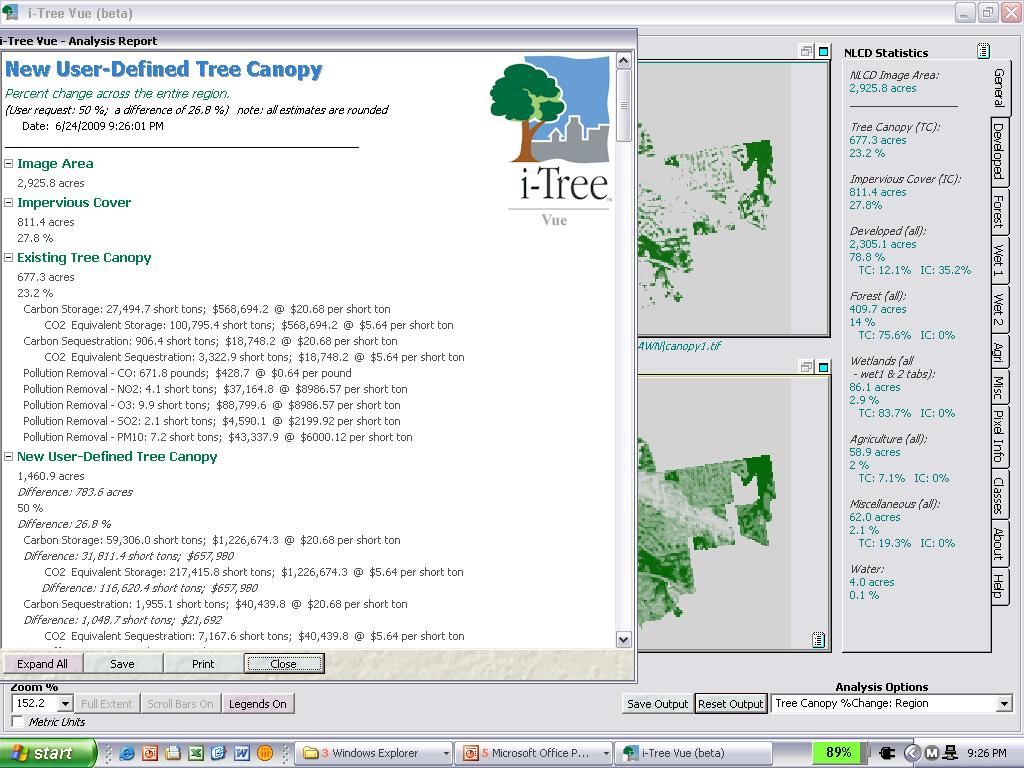
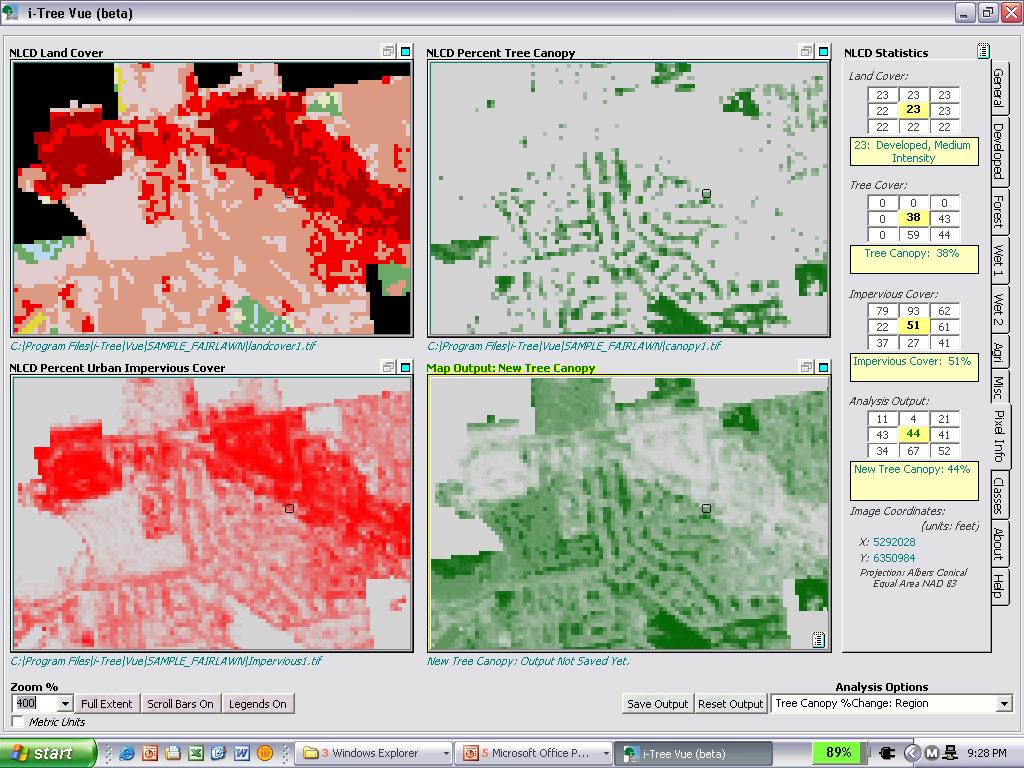
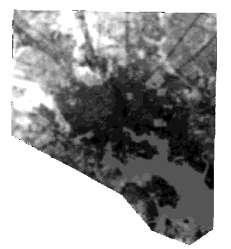
5 Top-down Approach Cover Data NLCD (30 m) Hi-resolution (~1 m) Photo-interpretation 5


6 Testing NLCD Tree and Impervious Cover Maps 100% 0% 6

7 Tree Cover Tree cover: National underestimation = 9.7% Maximum underestimation = 28.4% Underestimation in 64 of 65 zones Impervious cover: National underestimation = 1.4% Maximum underestimation = 5.7% Underestimation in 44 of 65 zones 7


8 State Reports All reports in publication group for layout and printing State Reports New England - CT, MA, ME, NH, RI, VT Mid Atlantic - NJ, NY, PA South Atlantic - DE, MD, WV, VA, DC, NC, SC, GA, FL East North Central - IL, IN, MI, OH, WI West North Central - IA, KS, MN, MO, NE, ND, SD East South Central - AL, KY, MS, TN (May 2010) West South Central - AR, OK, LA, TX (May 2010) Mountain Region - AZ, CO, ID, MT, NV, NM, UT, WY Pacific Coast - CA, OR, WA Uncorrected cover data Correction factors given 8
 analyses (better for regional analyses) 9")
9 NLCD Adv: Free wall-to-wall coverage of lower 48 states maps of canopy cover distribution can integrate with GIS Disadv: relatively course resolution tends to underestimate tree cover not designed for local scale (e.g., city) analyses (better for regional analyses) 9


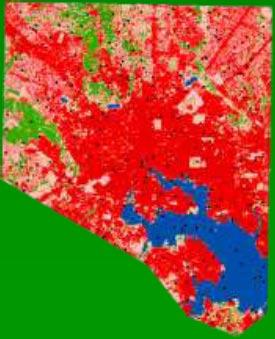
10 Tree Cover Mapping High resolution (typically sub-meter) cover data 10
11 High resolution data Adv: high resolution cover map good estimates of cover amount / location Integrates with GIS can locate potentially available spaces for trees Disadv: costly (time and $) cloud cover can be an issue, requiring multi-date images significant effort and time 11
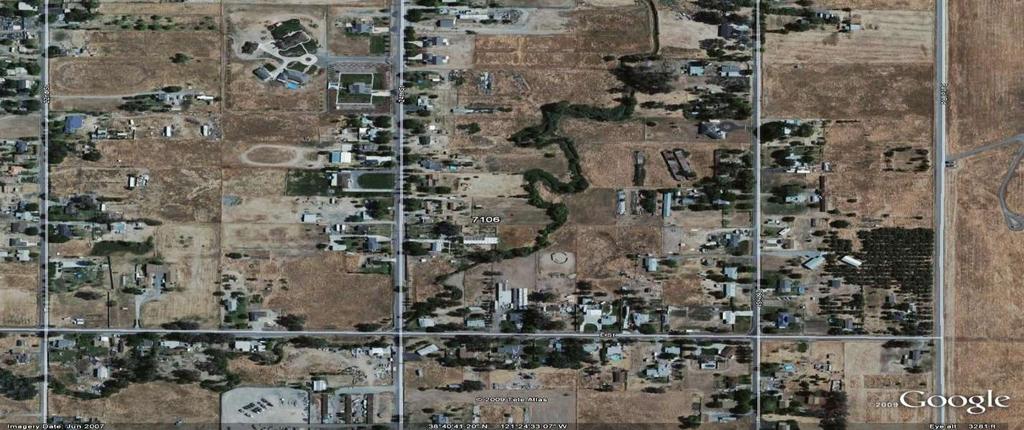
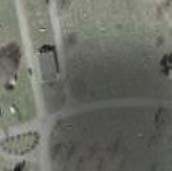
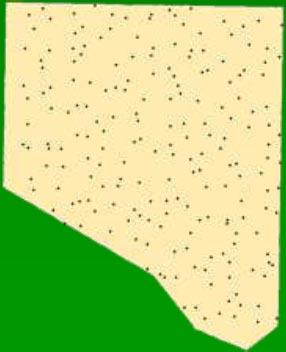
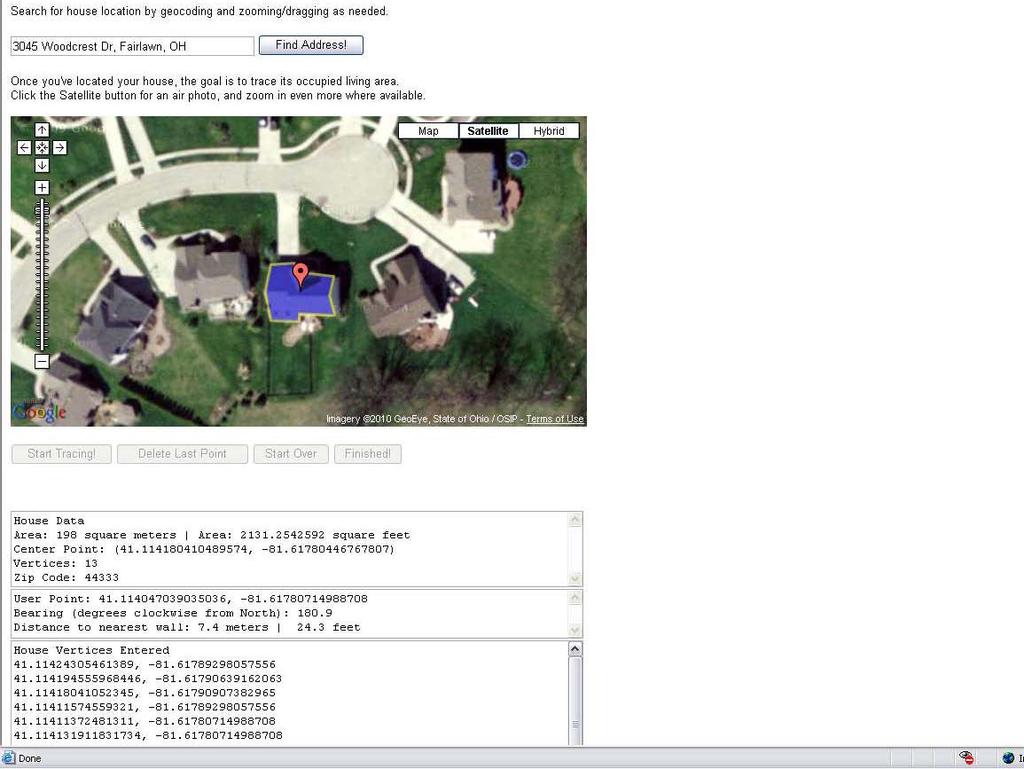
12 Photo Interpretation 12


13 PI Mapping 13

14 Photo Interpretation ret Adv: low cost free through Google Earth quick and easy accuracy increased with more points all cover types (e.g., available planting space, tree, impervious Disadv: does not produce detailed cover map photo-interpreter potential error 14

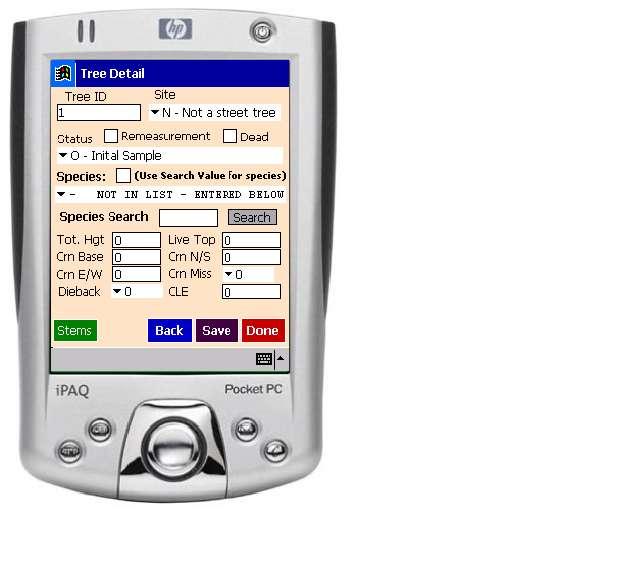
15 Ground-based Approach: i-tree 15
16 What is i-tree? A suite of tools to assess urban vegetation and their ecosystem services and values i-tree Eco = UFORE 16


17 Public-Private Partnership USDA Forest Service Davey Tree Expert Co. National Arbor Day Foundation Society of Municipal Arborists International Society of Arboriculture 17
 Distributed to over 80")
18 i-tree Use Eco has been used worldwide in over 60 cities (9 countries) Distributed to over 80 countries 18
19 Canadian Cities and Towns Ajax, ON Bolton, ON Brampton, ON Caledon, ON Calgary, AB Edmonton, AB Halifax, NS Kelowna, BC London, ON Markham, ON Mississauga, ON Oakville, ON Pickering, ON Toronto, ON Vaughan, ON 19
20 Assessing Urban Tree Populations i-tree Eco assesses: Structure Function Energy Air pollution Carbon VOC emissions Value Management needs Pest risk Tree health Exotic/invasive spp. 20

21 The Foundation: Local Data Local Sample or Inventory Local information: Weather Pollution Environmental variables Hourly simulations 21


22 How is an assessment done? i-tree Step 1 Determine Study Area 22


23 i-tree Step 2 Determine if street tree or area-based inventory or sample 23

24 i-tree Step 2a Determine Number of Plots Typically 200 1/10 acre plots 24

25 i-tree Step 3 Determine what data to collect Required core variables (spp, dbh) Optional variables Crown parameters Tree health Distance to buildings Shrub data Ground cover data 25


26 i-tree Step 4 Lay sample points Random Pattern Random Grid Pattern Stratified by LU 26

27 i-tree Step 5 Set up project 27


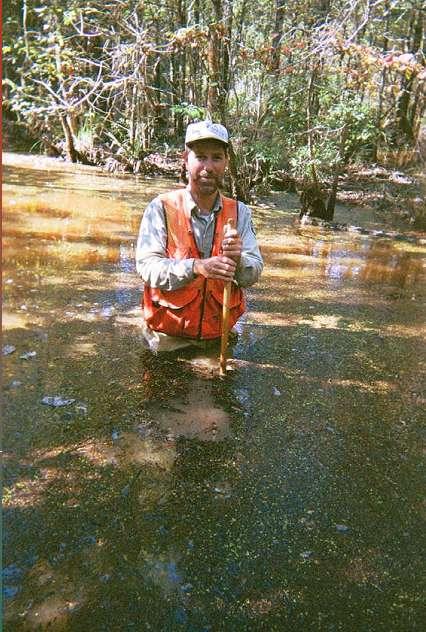
28 i-tree Step 6 Train crews and collect field data 28


29 i-tree Step 7 Enter data and analyze Enter data and analyze 29


30 i-tree analyses 30

31 i-tree Step 8 Use data and reports to make a difference Automatic Report Generator 31

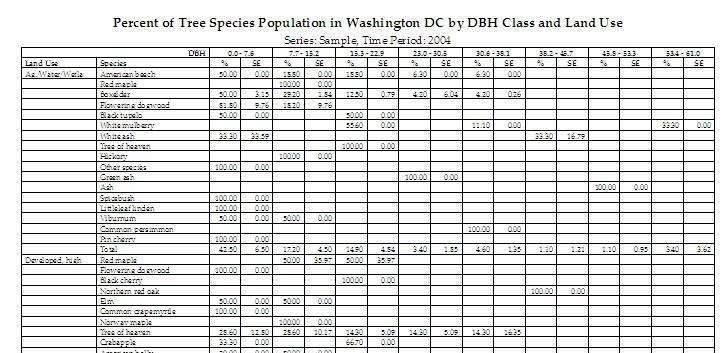
32 DC analysis Data collected by Casey Trees and National Park Service Data collected 2004 and randomly located plots 32

33 Species Composition American beech 11.8% Callery pear 6.0% Tulip tree 4.8% Boxelder 4.6% other species 52.5% Black cherry 2.4% Red maple 4.6% Other species 4.4% Slippery elm 3.1% Black tupelo 3.0% Tree of heaven 2.8% 2.6 million trees 33

34 Tree Distribution Number of Trees 1,800,000 1,600,000 1,400,000 1,200,000 1,000, , , , ,000 0 Total Trees Per acre Trees per acre 34


35 Leaf Area % of total leaf area % of all trees 10 Percent


36 Carbon Sequestration Sequestration (tons / year) 2,500 2,000 1,500 1, Carbon Sequestration U.S. Dollars 50,000 45,000 40,000 35,000 30,000 25,000 20,000 15,000 10,000 5,000 0 Value (dollars / year) Total Storage = 595,000 tons ($12.3 million) Total seq. = 19,000 tons/yr ($390,000/yr) 36

37 Structural Value Structural value (millions of dollars) Total = $4.0 billion 37

38 Other Values (2004) Energy Conservation = $2.6 million/yr Air Pollution Removal = 540 tons /yr ($2.5 million/yr) 38

39 i-tree Tools 39
40 40
41 41

42 42
43 43

44 44
45 45
46 46
47 47
48 i-tree-hydro Separate GIS program Calibrates against stream flow data 48
 Tree Cover (%) 0")
49 i-tree Hydro Annual Flow Change (%) Impervious Cover (%) Tree Cover (%) 0 49
50 50


51 Population Projectors 51
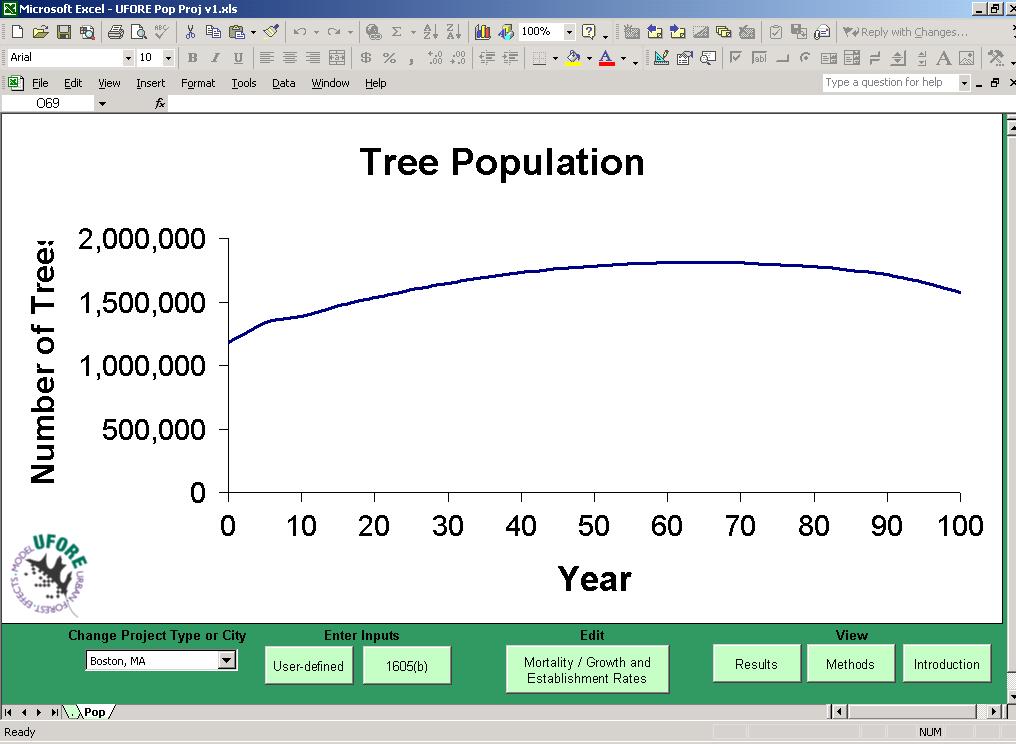

52 52

53 Priority Planting Index 53

54 Pollution Distribution Conc. Vd Temp. Flux 54

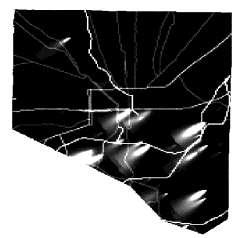
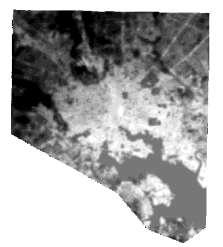
55 Temperature Mapping Heat Island Baltimore, Maryland - - Source: Heisler et al., USFS 55

56 Heat Island Baltimore, Maryland - - Source: Heisler et al., USFS 56

57 Heat Island Baltimore, Maryland - - Source: Heisler et al., USFS 57


58 Questions? nrs.fs.fed.us/units/urbanurba 58