Forest Accounts.
|
|
|
- Shanon Simon
- 5 years ago
- Views:
Transcription

1 Forest Accounts 1
2 Outline Why accounts? 1. Land Accounts 2. Forest Asset Accounts 3. Supply and Use Accounts Suggest policy applications as we discuss the accounts. 2
 Comprehensive view (all forests, all timber, all uses and users) SEEA uses same classifications as SNA to link to economic")
3 Why accounts? Apply accounting principles (stocks/flows) Comprehensive view (all forests, all timber, all uses and users) SEEA uses same classifications as SNA to link to economic statistics Consistent units of measure (hectares, m 3, tonnes, currency) Consistent valuation methods Identify inconsistencies in data (coverage, errors, concepts) 3
 Other naturally generated (Area, value) Planted (Area, value) Timber (Volume, value) Timber (Volume, value) Timber, NTFP, Ecosystem services (Volume, value) Timber, NTFP, Ecosystem")
4 Land Accounts Forest accounts Subset of Land, Ecosystems, Forestry Assets Primary forest (Area, value) Timber (Volume, value) Flows Timber, NTFP, Ecosystem services (Volume, value) Tree-covered (Area, value) Other naturally generated (Area, value) Planted (Area, value) Timber (Volume, value) Timber (Volume, value) Timber, NTFP, Ecosystem services (Volume, value) Timber, NTFP, Ecosystem services (Volume, value) Other wooded land (Area, value) Timber (Volume, value) Timber, NTFP, Ecosystem services (Volume, value) 4

5 It s not all in one place! Source: World Bank Forest Accounting Sourcebook. SNA = System of National Accounts: records economic production, investment and wealth SEEA-CF = System of Environmental-Economic Accounting: records assets and flows SEEA-AFF = Agriculture, Forestry and Fisheries: Industry focus on assets and flows SEEA-EEA = Experimental Ecosystem Accounting: records contribution of ecosystems 5
6 SEEA forest-related accounts SEEA Central Framework (SEEA-CF) 1. Land accounts 5.13 Land Cover: Tree-covered area (hectares) Land Use: Land used for forestry (also other uses) (hectares) 5.16 Monetary asset account for land (currency units) 2. Forest asset accounts 5.15 Physical asset account for forest and other wooded land (hectares) 5.19 Physical asset account for timber (cubic metres) 5.20 Monetary asset account for timber (currency units) SEEA Experimental Ecosystem Accounting (SEEA-EEA) 3. Supply and use (physical and monetary) Marketed forest goods and services (in SNA) Other forest goods and services (not in SNA) 6

7 1. Land accounts Land cover Land use Land value 7
8 1. Land accounts Scope land area of a country (including inland waters, coastal water bodies and intertidal areas). Purpose Put forests into context (% of total land area ) Agreement on what exists on surface Spatial infrastructure for administration (consistent names, classifications, overlay maps) Good if based on National Spatial Data Infrastructure (NSDI) (total area, boundaries, shorelines, projections) 8
: changes due to updated information")
9 Managed expansion/regression: increase/decrease in area of a land cover type due to human activity Natural expansion/regression: increase/decrease in area resulting from natural processes Reappraisals (upward or downward): changes due to updated information
")
10 1. Land Accounts Land cover classes (based on FAO Land Cover Classification System) 10
")
11 1. Land Accounts Land cover classes (based on FAO Land Cover Classification System) 11
")
12 1. Land Accounts Land cover classes (based on FAO Land Cover Classification System) 12
")
13 1. Land Accounts Land cover classes (based on FAO Land Cover Classification System) 13
14 1. Land Accounts 5.14 Land cover change matrix (hectares) Compares land cover maps over two periods of time Consistent classifications, scales, methods, time of year What has changed to what? e.g., forest to crop e.g., crop to artificial surfaces (urban) 14

15 Matching entry Beginning of accounting period Changed to Crop End of accounting period
16 1. Land Accounts Land use classification How land is being used, managed or designated Forest = cover; Forestry = use Land use classification (SEEA-CF, Table 5.11, p. 176; and Annex 1 p. 289) 1. Land 1.1 Agriculture 1.2 Forestry 1.3 Land used for aquaculture 1.4 Use of built-up and related areas Forest land Primary regenerated forest 1.5 Land used for maintenance and restoration of environmental functions 1.6 Other uses of land n.e.c. 1.7 Land not in use! 2. Inland waters 2.1 Inland waters used for aquaculture or holding facilities 2.2 Inland waters used for maintenance and restoration of environmental functions 2.3 Other uses of inland waters n.e.c. 2.4 Inland waters not in use! 3. Coastal waters 4. Exclusive economic Zone (EEZ) 16
17 1. Land Accounts 5.16: Monetary asset account for land (currency units) Value of land by type of land use Market value of land Based on recent transactions (observed prices) Also consider: land is a composite asset (includes soil, buildings, infrastructure, improvements, biological resources) Changes in value due to changes in use, improvements, changes in quality 17

18 Acquisition/Disposal = change in land use (e.g., purchase/sale between economic units) Revaluations = changes in price
19 2. Forest asset accounts 5.15 Physical asset account for forest and other wooded land (hectares) Subset of land accounts 5.19 Physical asset account for timber (cubic metres) Accounts for stock of exploitable timber 5.20 Monetary asset account for timber (currency units) Accounts for value of exploitable timber 20
20
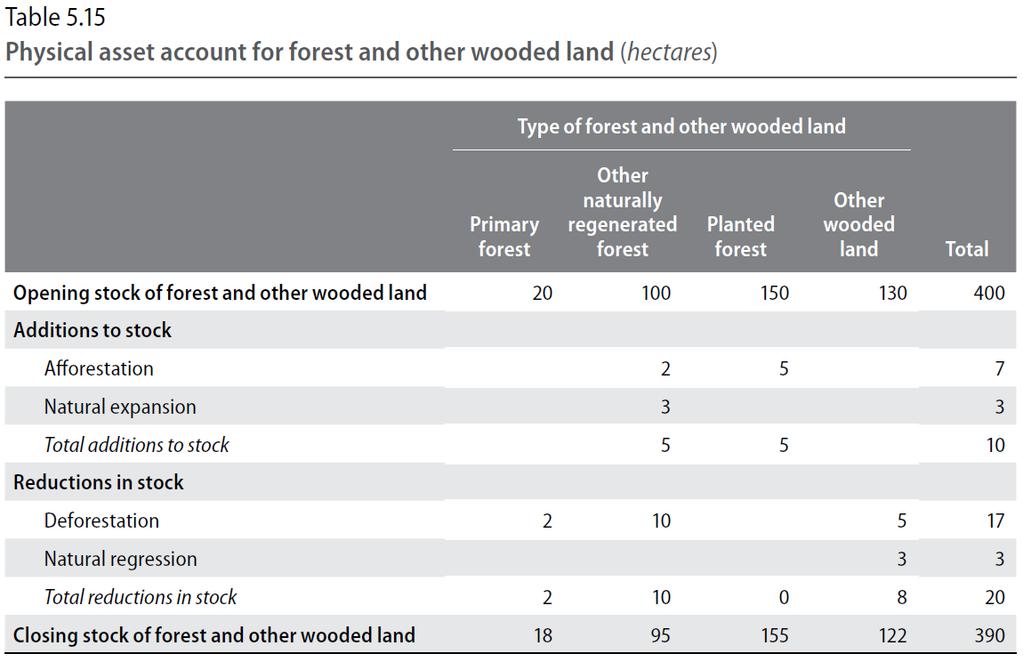
21 2. Forest Asset Accounts 5.15: Physical asset account for forest and other wooded land (hectares) Forest and other wooded land types Forest land Primary forest Other naturally regenerated forest Planted forests Other wooded land land spanning more than 0.5 hectares naturally regenerated forest of native species clearly visible indications of human activities. trees established through planting and/or deliberate seeding. land not classified as forest land, spanning more than 0.5 hectares with trees higher than 5 metres and no clearly visible indications of human activities and with trees higher than 5 metres and canopy cover of more than 10 %, or trees able to reach thresholds in situ ecological processes are not significantly disturbed. canopy cover of 5-10% or trees able to reach these thresholds in situ Excludes treecovered land used for agricultural or urban purposes or a combined cover of shrubs, bushes and trees above 10% 22
22 2. Forest Asset Accounts 5.15: Physical asset account for forest and other wooded land (hectares) Reasons for additions and reductions Afforestation Natural expansion Deforestation Natural regression increase in stock of forest and other wooded land increase in area from natural seeding, sprouting, suckering or layering. decrease in the stock of forest and other wooded land decrease due to natural reasons (e.g., landslide, fire, disease) due to the establishment of new forest on land that was previously not classified as forest land, due to the complete loss of tree cover and transfer of forest land to other uses (e.g., to agriculture, settlements) or as a result of silvicultural measures such as planting and seeding. 23
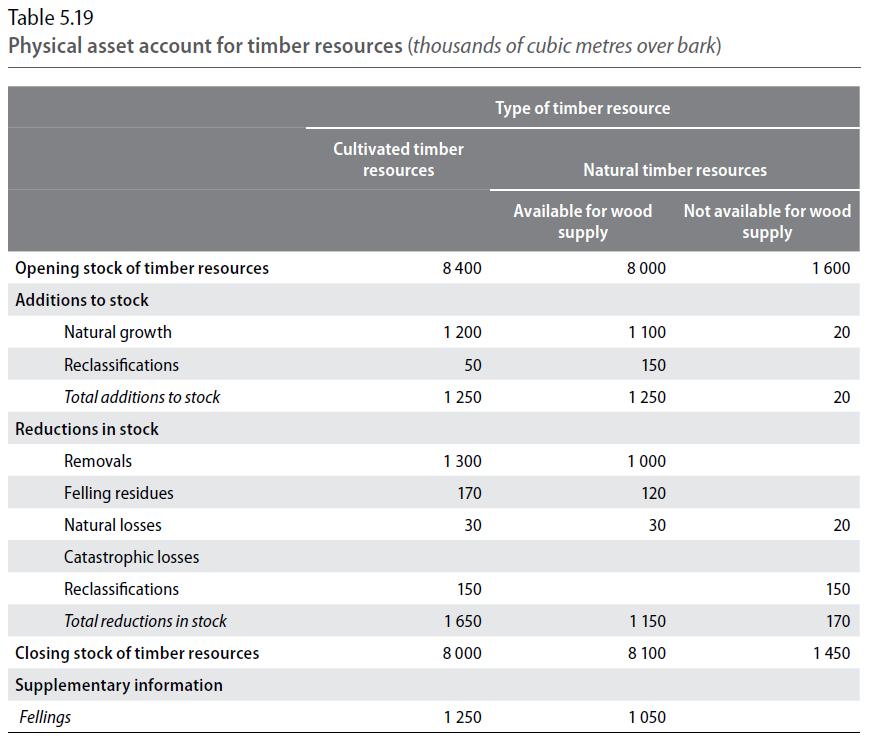
23 2. Forest Asset Accounts 5.19: Physical asset account for timber resources (cubic metres) Scope Timber resources found in areas of forest and other wooded land (and other land, if of interest) Timber resources Volume of trees, living or dead Include all trees regardless of diameter, tops of stems, large branches and dead trees lying on the ground that can still be used for timber or fuel. Units of measure Thousands of cubic meters over bark (before bark removed) Depletion of natural timber resources Removals less sustainable yield (SY) e.g., SY = 90; Removal = 100 depletion = = 10 24
24
25 2. Forest Asset Accounts 5.19: Physical asset account for timber resources (cubic metres) Cultivated timber resources Natural timber resources (Available for wood supply) Natural timber resources (Not available for wood supply) Under the direct control, responsibility and management of institutional units Accessible and economically viable Protected, inaccessible, not economically viable Growth is recorded as an increase in inventories of those enterprises undertaking the cultivation Growth is recorded only at the time the tree is removed (not in inventory of enterprise) Important for other analysis (e.g., carbon accounting) 26
26 2. Forest Asset Accounts 5.19: Physical asset account for timber resources (cubic metres) Reasons for additions and reductions Natural growth Reclassifications Removals Felling residues Natural losses Catastrophic losses The gross annual increment, i.e., of all trees with no minimum diameter Increases / decreases in the area of forest land Volume of timber resources removed from forest land, other wooded land and other land areas Rotten, damaged or in excess in terms of the size requirements Mortality from causes other than felling (e.g., diseases) Exceptional and significant losses of timber resources due to natural causes (e.g., fire) Changes in management practice that shift timber resources from cultivated to natural or vice versa Include removals of trees felled in earlier periods and the removal of trees killed or damaged by natural causes Excludes small branches that are also excluded from the scope of timber resources Recorded only when there is no possibility that the timber resource can be removed Include fellings, silvicultural and pre-commercial thinnings and cleanings 27
27 2. Forest Asset Accounts 5.20: Monetary asset account for timber (currency units) Contribution to national balance sheet (not GDP) Monetary value of opening and closing stock of timber and changes in value over the accounting period Based on volume of timber resources that can be harvested Reflects changes in stock (additions and reductions) but also changes in timber prices Resource rent on timber resources can be derived as the gross operating surplus from the harvest of timber resources (after taking into account specific taxes and subsidies) less the value of the user costs of produced assets used in the harvesting process. Also derived from stumpage price (the amount paid per cubic metre of timber by the harvester to the owner of the timber resources) Multiplied by volume of timber resources 28

28 Reclassification = change in status cultivated natural Revaluations = changes in price
29 2. Forest asset accounts Key policy considerations Physical asset account for forest and other wooded land (hectares) Is forest area increasing or decreasing? Economic dimension: fewer benefits in future. Environmental dimension: ecosystems, flood control Social dimensions: population dependence on forests Physical asset account for timber (cubic metres) Is stock of timber being depleted? Monetary asset account for timber (currency units) What is contribution of timber to national wealth? Do benefits of harvesting justify the costs (e.g., concession prices)? 30
30 Questions/comments? Next: Group exercise 20 minutes to prepare 10 minutes to report answers 31
31 Group exercise Situation Have 5 years of historical data on forest area, deforestation and natural regression Need to model afforestation, natural expansion, opening and closing stock Need to produce SDG forest area as a proportion of total land area Objective (Groups of 3-5 persons; 20min to prepare) Calculate afforestation, natural expansion, closing stock, opening stock for each year Calculate SDG indicator for 5 years Report & discuss answers (10min) 32

32 Group exercise Step 1: Calculate afforestation, natural expansion, opening stock and closing stock for years 2 to 5 Opening stock for Year 2 is Closing stock for Year 1 Afforestation is 5% of previous year Natural expansion is 2% of Opening stock 33
33 Group exercise Step 2: Calculate SDG indicator forest area as a proportion of total land area (Forest area/total land area)*100 Total land area = 30,000,000 hectares Use Closing stock of forest area Calculate for 5 years 34
34 Group exercise Is everyone clear on the objectives? 20 minutes group work Please ask questions Results: Report SDG indicator

35 The answers 36
36 3. Physical and monetary flows Timber is only one product (= goods and services) Other marketed goods (fuelwood, NTFP) Non-market ecosystem services Regulating and maintenance: flood control, habitat, Cultural: recreation, scientific, spiritual SNA defines monetary flows of forest products Attributed to supplying sector (usually Forestry Industry) SEEA-CF defines Material Flow Accounts Physical and monetary supply and use of marketed products SEEA-EEA Includes marketed forest products (provisioning services) Also defines Ecosystem Services 37
37 3. Physical and monetary flows Based on SEEA-CF Material Flows Physical and monetary supply and use (marketed) Forest Other + Industry Imports + supplies Imports supply Environment Lumber to Supplies Furniture Total Supply to Households = Total Other Use + Timber to Residuals Forest Industry and Exports (+Residuals) Supply (Million tonnes) Industry Forest Other Households Import Environment Total Timber Fuelwood Natural Inputs NTFP (cork, gum, fodder, medicine, peat, food, etc.) Lumber Furniture Products NTFP (cork, gum, fodder, medicine, peat, food, etc.) Residuals Wood waste, etc Total Use (Million tonnes) Industry Forest Other Households Export Environment Total Timber Natural Inputs Fuelwood NTFP (cork, gum, fodder, medicine, peat, food, etc.) Lumber Products Furniture NTFP (cork, gum, fodder, medicine, peat, food, etc.) Residuals Wood waste, etc Total
38 3. Physical and monetary flows Monetary flows already in SNA Value of timber harvested by timber industry Value of lumber sold and imports (to furniture industry) Value of furniture sold and imports to households and exports Physical flow accounts Include flows from the environment (natural inputs) Include flows to the environment (residuals) Can be estimated from price/volume (e.g., $/tonne of lumber) 39
39 3. Physical and monetary flows Ecosystem services Can be valued, but not all within SNA; Why? SNA records market exchanges between economic units SNA Benefits: (e.g., timber, NTFP) Produced by economic units Potential to be bought and sold on market Value in terms of potential market value Non-SNA Benefits: (e.g., water regulation, air purification, carbon sequestration, spiritual) Not produced by economic units Not bought and sold on market Still very important to human well-being (health, stable climate, clean air, lower risk from extreme events, exposure to nature ) Important to measure in physical terms first Can apply valuation methods appropriate to purpose 40
40 3. Physical and monetary flows Ecosystem services Based on Common International Classification of Ecosystem Services (CICES) Not mutually exclusive A list of final services Detailed (48 at 4-digit) Does not include supporting or intermediate services (= ecosystem processes & conditions) Physical measures and valuation methods not standardized (yet) Section Division Group 01. Provisioning 02. Regulation & Maintenance 03. Cultural Nutrition Materials Energy Mediation of waste, toxics and other nuisances Mediation of flows Maintenance of physical, chemical, biological conditions Physical and intellectual interactions with biota, ecosystems, and land-/seascapes [environmental settings] Spiritual, symbolic and other interactions with biota, ecosystems, and land- /seascapes [environmental settings] Source: CICES, Biomass Water Biomass Water Biomass-based energy sources Mechanical energy Mediation by biota Mediation by ecosystems Mass flows Liquid flows Gaseous / air flows Lifecycle maintenance, habitat and gene pool protection Pest and disease control Soil formation and composition Water conditions Atmospheric composition and climate regulation Physical and experiential interactions Intellectual and representative interactions Spiritual and/or emblematic Other cultural outputs 41
41 Biomass Water Biomass Water Biomass-based energy sources Mechanical energy Mediation by biota Mediation by ecosystems Mass flows Liquid flows Gaseous / air flows Lifecycle maintenance, habitat and gene pool protection Pest and disease control Soil formation and composition Water conditions Atmospheric composition and climate regulation Physical and experiential interactions Intellectual and representative interactions Spiritual and/or emblematic Other cultural outputs Which ecosystems provide which services? Nutrition Ecosystem service 01. Provisioning 02. Regulation & Maintenance 03. Cultural Materials Energy Mediation of waste, toxics and other Mediation nuisances of flows Maintenance of physical, chemical, biological conditions Spiritual, Physical and symbolic and intellectual other interactions interactions with biota, with biota, ecosystems, ecosystems, and and land- land- /seascapes /seascapes Tree covered areas Provisioning Nutrition Food Drinking water Ecosystem type Materials 01. Artificial surfaces 02. Herbaceous crops Biomass 03. Woody crops 04. Multiple or layered crops Water 05. Grassland 06. Tree covered areas Energy 07. Mangroves 08. Shrub covered areas Biomass 09. Shrubs and/or herbaceous vegetation, aquatic or Regulation & Maintenance regularly flooded 10. Sparsely natural vegetated areas Mediation of wastes, toxics 11. Terrestrial barren land 12. Permanent snow and Mediation of flows (mass, water ) glaciers 13. Inland water bodies Maintenance of physical, chemical 14. Coastal water bodies and inter-tidal areas 15. Open ocean and biological conditions 16. Atmosphere 17. Groundwater Carbon sequestration 18. Soil Cultural Note: The circles show the proportion of cells within a cluster of ecosystem and service types for which there was consensus of four authors: 2/3-1 1/3 - < 2/3 Physical 0 - < 1/3 Intellectual Spiritual Source: Bordt,

42 Physical and monetary flows Example (services in physical units) Note: Units of measure are very different Source: Remme et al., 2014 (Limburg, the Netherlands) 43
43 3. Physical and monetary flows Key policy considerations The true economic value of forests: What is the full economic value of forests, including nonmarket values, and who are the beneficiaries? Is economic growth based on the depletion of forests? What is the [long-term social] cost of deforestation? Are policy decisions based on the total economic value of forests, taking into account linkages throughout the economy and impacts on all stakeholders? The impact on forests of non-forestry policies: What are the economic trade-offs among competing sectors or optimizing forest ecosystems that produce benefits to multiple stakeholders? How will economic growth, macroeconomic and other policies affect forests? Source: Lange, in FAO, Cross-sectoral policy impacts between forestry and other sectors 46
44 Forest accounts Take home points Accounts harmonize & validate statistics Land Cover Account defines Tree covered area Land Use defines land designated for Forestry Asset Account for Forest Land is a subset of Land Cover Area and value Asset Account for Timber includes all exploitable timber Volume and value Forests are ecosystems, providing timber, NTFP, Regulating & Maintenance and Cultural Services Opportunity to assess trade-offs between economic, environmental and social policies 47
45 References Bordt, M Which ecosystems provide which services? In: Bordt, M. (Ed.), Improving Convergence and Aggregation in National Ecosystem Accounting. University of Ottawa, Ottawa, Canada. Doctoral Thesis. FAO Global Resources Assessment 2010 FAO 2016, Land Cover Classification System; Classification Concepts Lange, in FAO, Cross-sectoral policy impacts between forestry and other sectors (Chapter 4: Monitoring and Measuring Cross-Sectoral Impacts with Environmental Accounts) Remme, Roy P., Matthias Schröter, and Lars Hein Developing spatial biophysical accounting for multiple ecosystem services. Ecosystem Services 10:6-18. SEEA-Central Framework (2014) World Bank, Forest Accounting Sourcebook: Policy applications and basic compilations 49