Vetorial Group is one of the biggest independent pig iron producers in Brazil with accumulated experience since 1969.
|
|
|
- Hector Stevens
- 5 years ago
- Views:
Transcription
1


2 Vetorial Group is one of the biggest independent pig iron producers in Brazil with accumulated experience since Vetorial detain the ISO 9001 certification and is audited by PriceWaterhouseCoopers. The activities of the company are concentrated in Mato Grosso do Sul, where is responsible for more than direct jobs.
3 Vertically integrated with independent businesses: Vetorial Energy: Forestry management and charcoal production. The actual own forests are ha and its expanding to reach the forest sustainability and the total of ha in Vetorial Steel Mill: Pig Iron production with a capacity of ton per year shared among the three industrial units. Vetorial Mining: Exportation and production of iron ore with resources estimated in more than 10bi ton. Today its part of VETRIA Holding. Log Brasil: Logistic company with a shared control (50%). 3
4 CHARCOAL SUSTAINABLE SUPPLY 4


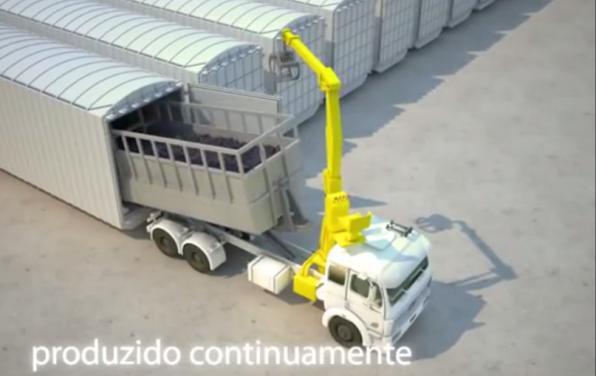
5 Charcoal Production Flow Eucalyptus forest Wood Harvesting Wood Carbonization Wood Transportation Mechanized Loading Charcoal Cooling


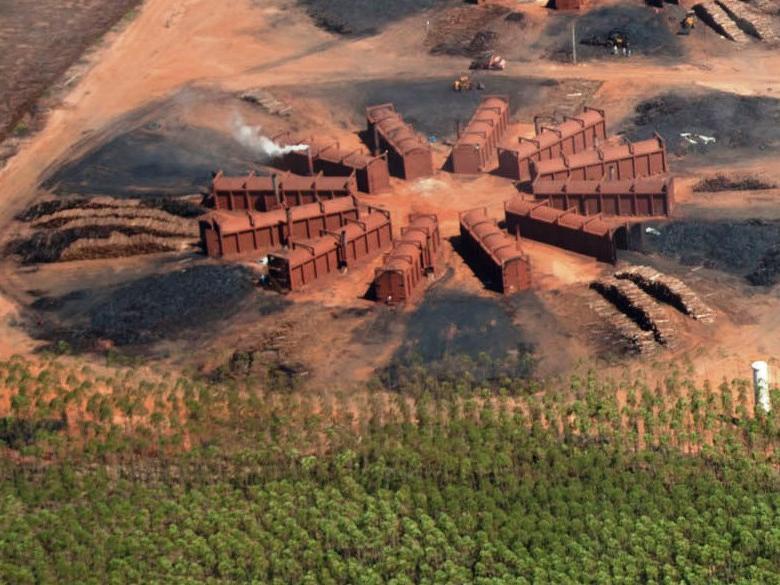
6 Charcoal Production Sites and Vetorial Pig Iron Mills
7 Harvesting and Charcoal Production by Site Sites Anual Harvesting Charcoal Production (hectares) ( m 3 x 1000) 1 Nova da Mata Verde Mar Cabeceira Funda Pantano Yara Jatobá Sonora Ribas * Sonora II *Dois Irmãos Total * In negotiation
8 Work Force Productivity (m3/man/month) Productivity improvements with new technologies PROCESS CONTROL PLUS GAS BURNING AND WOOD DRYING PLUS CHARCOL COOLING SYSTEM Work Force Evolution Productivity (m3/h/month) Social Contribution: Company will more than double the work force High Productivity means: Lower costs and increase of work force benefits


9 Production (1000 m3/year) Monthly Production (1000 m3/month) Charcoal Production Monthly Charcoal Production Yearly Charcoal Production


10 Brazil s Planted Forest by State Eucalyptus: 4.9 million hectares Pinus: 1.7 million hectares Fonte: AMS e IBGE,2013

11 Participation of planted forest area by Brazil's States (%) 100% 90% 3% 80% 4% 6% 4% 5% 4% 5% 3% 6% 3% 7% 7% 7% 3% 7% 3% 9% Tocantins, Piauí e outros Mato Grosso 7% 11% 10% 10% 10% 10% 7% 3% Goiás 70% 7% Amapá 60% 11% 11% 10% 10% 10% 50% 14% 14% 14% 14% 13% 10% 9% Maranhão 10% 10% Pará Mato Grosso do Sul 40% 30% 20% 10% 0% 13% 12% 20% 19% 19% 19% 19% 18% 18% 24% 23% 23% 23% 24% 23% 23% Espírito Santo Rio Grande do Sul Bahia Santa Catarina Paraná São Paulo Minas Gerais Fonte: AMS,2013


12 Planted Forest Consumption by Sector 37% 51% 12% Cellulose and Paper Charcoal Industrial Wood Total of 163 million cubic meter per year Wood Charcoal: 20 million cubic meter per year Source: AMS, 2010
13 1,3 1,4 1,4 1,8 2,3 2,1 1,9 1,8 1,9 2,2 2,0 1,9 2,4 2,9 3,0 3,7 3,7 3,7 3,7 3,7 4,0 3,8 3,6 3,6 3,6 4,7 3,7 4,5 4,0 4,1 3,8 4,2 4,0 3,8 3,6 3,6 4,0 3,9 Production (Mton) Native Wood Used (%) Charcoal made by: Planted Forest x Native Wood 10,0 60% 56% 9,0 53% 52% 51% 51% 8,0 45% 50% 7,0 6,0 38% 32% 36% 33% 32% 38% 40% 33% 35% 33% 33% 40% 5,0 25% 27% 30% 4,0 3,0 20% 2,0 10% 1,0 0,0 0% Native Wood Charcoal Planted Forest Charcoal Native Wood (%) 13
14 Planted Forest need to Supply Pig Iron Production Average Pig Iron Production Mton/year 9,51 Blast Furnace Consumption t CH / t PI 0,73 Charcoal Need Mton/year 6,90 Charcoal Production Technology Baseline Wood to Charcoal Conversion - Yield % 29% Forest Planted Need - dry basis mass Mton/year 23,8 Wood Density ton/m 3 0,55 Forest Planted Need - volume Mm 3 /year 43,2 Today Forest Planted available Mm 3 /year 20 Available forest planted area for charcoal kha 805 Area harvested per year (for 7 year cyclo) kha/year 115 Clonal productivity available on market m 3 /ha 280 Potential total volume to be harvested Mm 3 32 Anual wood deficit to produce charcoal Mm 3 /year -11,0 Equivalent area to be planted per year kha/year 39
15 Carbonization improvements to guarantee wood supply Average Pig Iron Production Blast Furnace Consumption Charcoal Need Mton/year t CH / t PI Mton/year 9,51 0,73 6,90 Charcoal Production Technology Baseline Process Control Metalic Kilns Wood to Charcoal Conversion - Yield % 29% 36% 39% Forest Planted Need - dry basis mass Mton/year 23,8 19,2 17,7 Wood Density ton/m 3 0,55 Forest Planted Need - volume Mm 3 /year 43,2 34,8 32,2 Today Forest Planted available Mm 3 /year 20 Available forest planted area for charcoal Area harvested per year (for 7 year cyclo) Clonal productivity available on market kha kha/year m 3 /ha Potential total volume to be harvested Mm 3 32 Anual wood deficit to produce charcoal Mm 3 /year -11,0-2,6 0,0 Equivalent area to be planted per year kha/year
16 CARBORAAD SIMULATION SOFTWARE TO CONTROL THE CARBONIZATION PROCESS AND THE CHARCOAL QUALITY 16


17 CARBORAAD - SIMULATION SOFTWARE TO CONTROL THE CARBONIZATION PROCESS AND CHARCOAL QUALITY Kiln thermal profiles to control the evolution of wood pyrolysis during the whole process;

18 CARBORAAD - SIMULATION SOFTWARE TO CONTROL THE CARBONIZATION PROCESS AND CHARCOAL QUALITY Integrated management system to control production plans and real results (daily, monthly and yearly) 18
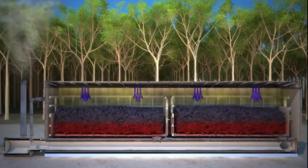
19 HEAT EXCHANGE SYSTEM TO REDUCE CHARCOAL COOLING Kiln with heat exchange = Taxa de 0,56 oc/hora Kiln without the system = Taxa de 0,20 oc/hora Increase the kiln productivity in about 20% related to total cycle


20 VETORIAL and its partnership with new technologies Total Production with Carbonization Software Control Development of Wood Drying System together with the MILL Technology Market Players to run together with the LIVEN rectangular kilns DPC Vetorial has rented and it will running by itself a Pilot DPC Plant at Parana State to validate process gains and the business plan


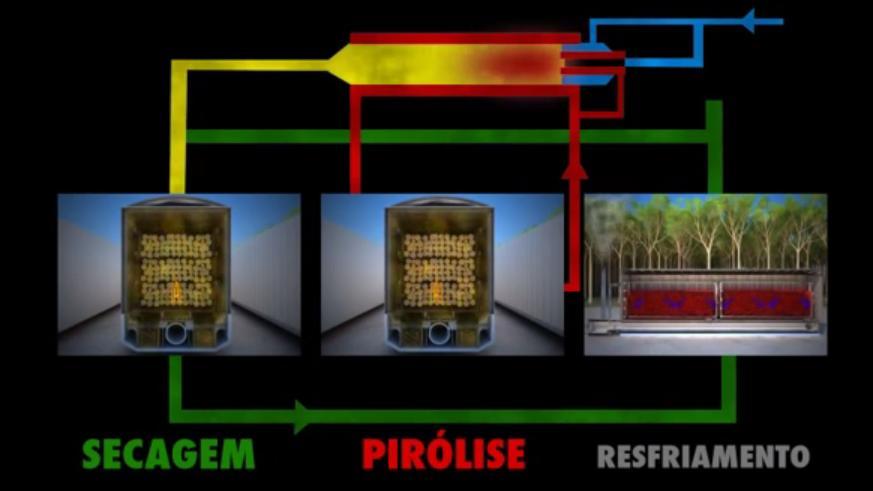

21 DPC Drying Pyrolysis Cooling 21
22 RG Wood Charcoal Yield Better Volumetric Wood Chacoal Conversion Yield improvements with new technologies 40% 3,30 38% 3,15 3,10 36% 35,8% 36,0% 36,1% 36,3%36,6%36,8% 34% 32,9% 33,4%33,8% PROCESS CONTROL PLUS DRYING PROCESS 2,90 32% 2,70 30% 29,3% 2,40 2,50 28% 2,30 26% 2,13 2,10 2,08 2,10 24% 22% 20% 22,3% 1,96 1,95 1,95 1,93 1,92 1,91 1,90 1,70 Better Gravimetric Yield Volumetric Yield 22
23 MAIN ENVIROMENTAL IMPROVEMENT WITH THE NEW TECHNOLOGIES TO PRODUCE CHARCOAL Improve the charcoal yield from 22% to 36% means: VETORIAL GAS EMISSION REDUCTION = tons of CO2 eq. per year 23


24 Thank you for your visit.