Past is not Prologue: How Climate Change alters the Science & Art of managing Ecosystems Stewardship Network Conference, January 23, 2015
|
|
|
- Edward Hopkins
- 5 years ago
- Views:
Transcription

1 Past is not Prologue: How Climate Change alters the Science & Art of managing Ecosystems Stewardship Network Conference, January 23, 2015 Rosina Bierbaum Professor & Dean Emerita University of Michigan


2 A TALE OF TWO FUTURE WORLDS by 2100 IPCC, WG 1, TS-1, 2013
3

4

5

6 US National Climate Assessment,

7 1. Human-induced climate change has moved firmly into the present. Photo: Cedar Rapids, IA during the 2008 flooding Source: AP photo/jeff Robertson

8 2. Americans are already feeling the effects of increases in some types of extreme weather and sea level rise. Stan Honda/AFP/Getty Images

9 3. Impacts are apparent in every region and in important sectors including health, water, agriculture, energy, etc. Scott Olson/Getty Images


10 4. There are many actions we can take to reduce future climate change and its impacts, and to prepare for the impacts we can t avoid. Esperanza Stancioff, UMaine Extension and Maine Sea Grant Dennis Schroeder, NREL

11 Global Climate is Changing


12 The ten key indicators are all changing as expected 12
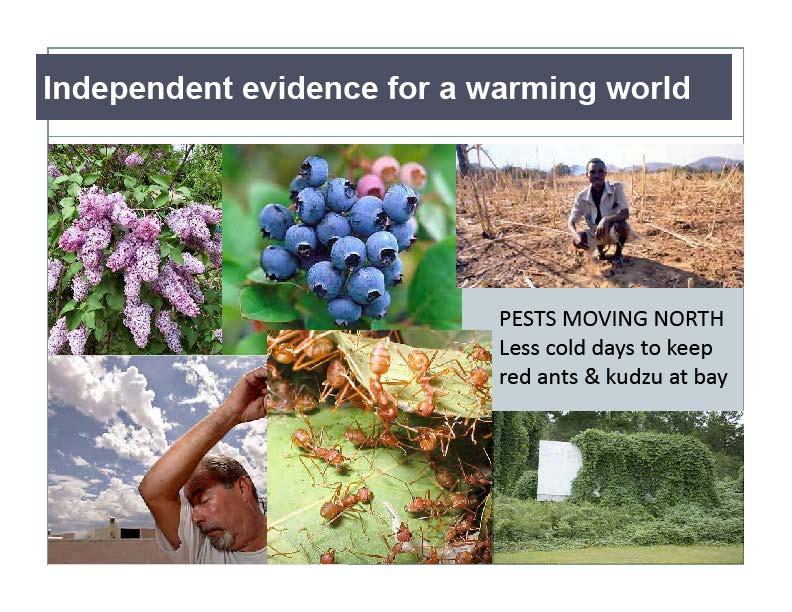
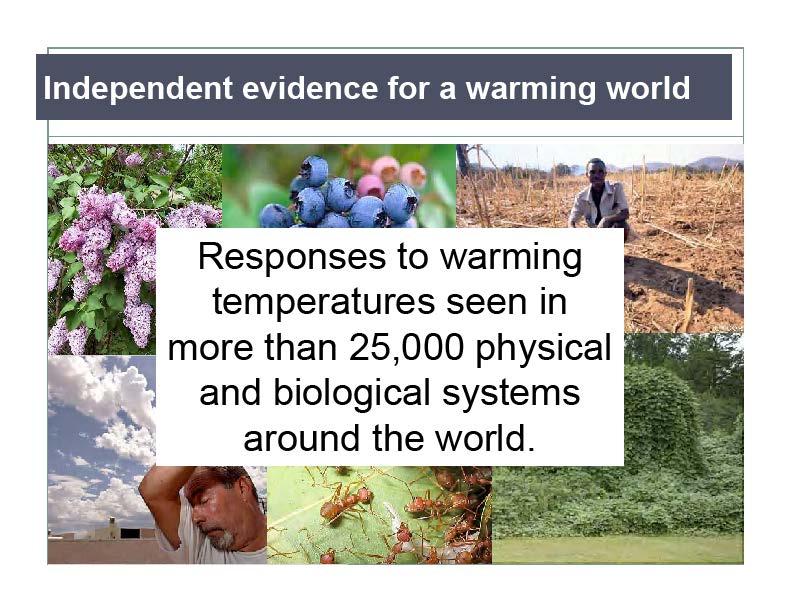
13 Impacts are already being felt

14

15

16

17
18
19


20 Change is also apparent across the U.S. Change based on average


21 Hotter than average summers can lead to extreme heat; Many daily heat records were set during June-July ,875 Records Tied 4,694 Records Broken Many locations set records more than once Slide adapted from Climate Reality Project Source: National Climatic Data Center, NOAA

22 Impacts to crops


23 Drought-prone regions are getting more so. The American West is a conspicuous example.

24 Lake Mead, on the Colorado River, is the largest US reservoir Under the current drought, worst in more than 100 years, it has shrunk significantly

25 Increased Volume of Rainfall in Heavy Precipitation Events Change based on average, top 1% of all daily events 25

26 The increasing intensity of storms and shifting of rainfall patterns toward more spring precipitation in the Midwest may lead to more scenes similar to this one.

27 Billion-dollar weather and climate disasters by State 27

28 28

29
 Source:")
30 The distribution of avg summer temperatures, Cooler than average Baseline ( ) mean Frequency of Occurrence Average Warmer than average -4 Slide adapted from Climate Reality Project Standard Deviations from the Mean (standard deviation varies by location, but of order 1 F) Source: NASA/GISS; Hansen, et al., Perceptions of Climate Change, Proc. Natl. Acad. Sci. USA , August 2012
31 By , the observed distribution had shifted to warmer conditions, reducing the number of cool summers and increasing the number of warm/hot summers 0.5 Cooler than average Baseline ( ) mean Frequency of Occurrence Average Warmer than average -4 Slide adapted from Climate Reality Project Standard Deviations from the Mean (standard deviation varies by location, but of order 1 F) Source: NASA/GISS; Hansen, et al., Perceptions of Climate Change, Proc. Natl. Acad. Sci. USA , August 2012
32 By , the observed distribution had shifted even further to warmer and very warmer conditions and further reducing the likelihood of cooler summers 0.5 Cooler than average Baseline ( ) mean Frequency of Occurrence Average Warmer than average -4 Slide adapted from Climate Reality Project Standard Deviations from the Mean (standard deviation varies by location, but of order 1 F) Source: NASA/GISS; Hansen, et al., Perceptions of Climate Change, Proc. Natl. Acad. Sci. USA , August 2012


33 By , the observed distribution had shifted even further to warmer and very warmer conditions and further reducing the likelihood of cooler summers 0.5 Cooler than average Baseline ( ) mean Frequency of Occurrence Average Warmer than average -4 Slide adapted from Climate Reality Project Standard Deviations from the Mean (standard deviation varies by location, but of order 1 F) Extremely warm summers used to cover 0.1% of the NH land area. Now they cover about 10%. Source: NASA/GISS; Hansen, et al., Perceptions of Climate Change, Proc. Natl. Acad. Sci. USA , August 2012
34 III. What does the future portend?

35 What does the Future Portend? IPCC WG2, 2014

36

37 Climate on the Move: Changing summers in the Midwest Now 2095

38


39 Crop Yields Decline under Higher Temperatures

40


41 Increased Risk to the Great Lakes Changes in range and distribution of fish species. Increased invasive species Increased harmful algal blooms Declining beach health. Less ice will lengthen navigation season.

42


43 The Changing Character of Great Lakes Forests & Wildlife Boreal forests greatly decrease Higher CO 2 and N could increase short-term forest productivity Higher ozone, more frequent droughts, forest fires, & greater risk from insect pests could damage long-term forest health Resident bird species breed more/earlier Raccoons, skunks, & white-tailed deer may benefit; moose likely to suffer

44 Forest Composition Shifts Maple/Beech/Birch Oak/Hickory

45 Say goodbye to


46 Impacts in the Midwest Changes in temperature and precipitation will impact both engineered and natural environments. Fish Water Energy Forests Agriculture Biodiversity Public Health Transportation Birds and Wildlife Tourism and Recreation
47 Ways Forward Mitigation Adaptation Learning by doing
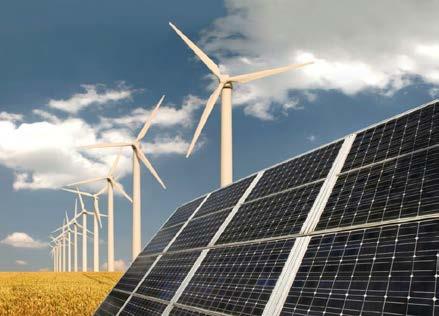


48 Mitigation - Act now on clean Energy Source: World Bank WDR 2010
49 BUT VALUE CARBON IN FORESTS AND SOIL 100% 80% 60% 40% 20% Stabilization Scenario When ALL Carbon is Valued Desert Other Unmanaged Land Unmanaged Forests Managed Forests Bioenergy Crops Unmanaged Pasture Pasture Crops 0% UrbanLand RockIceDesert OtherArableLand Tundra ShrubLand UnmanagedPasture UnmanagedForest Forest PurGrownBio GrassLand Pasture Rice SugarCrop OtherGrain OilCrop MiscCrop FodderCrop FiberCrop Corn Wheat Stabilization Scenario When Terrestrial Carbon is NOT Valued 100% 80% 60% 40% 20% 0% Unmanaged Forests Managed Forests Unmanaged Pasture Pasture Desert Other Unmanaged Land Crops Bioenergy Crops J. Edmonds, PNL, 2009


50 Adaptation: Manage for multiple stresses Source: World Bank WDR 2010


51 We must Adapt to climate change, adaptively: how can we help make robust rather than optimal decisions Manage for multiple stresses including climate change Seed varieties that perform well in droughts/floods/heat seed banks Prioritize lands to preserve and manage multiple threats Design of migration corridors Define native to include a changing climate Gov t incentives and remove barriers Information systems / share best practices Regional assessments - done iteratively

52 52 Adaptation is still very nascent! There is no "one-size fits all adaptation, but there are similarities in approaches across regions and sectors. We need to begin sharing best practices and lessons learned so wise practices can be put in place.


53 Federal Sustainability Plans for every Agency (Top Down) 53


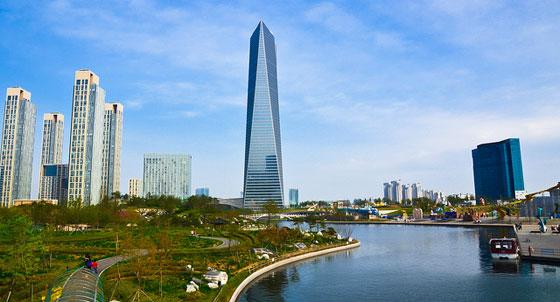
54 Lots of Local Action (Bottom Up)


55 New Task Force Report (A much-needed step to meet in the Middle)


56 56 Adaptation can yield Co-Benefits: Address Existing Stressors & Enhance Resilience to climate change Dubuque, IA new green alley program and expanded its storm sewer to deal with flooding Chicago/NYC - Urban heat island mitigation via green roofs & white roofs Dayton, OH - Urban forestry program reduces stormwater run-off by 7% Ann Arbor, MI stormwater utility charges by amount of impervious surface Keene, NH - Increasing storm pipe diameter Grand Rapids, MI Their municipal sustainability plan requires consideration of climate change in all actions Flagstaff, AZ reducing fire risk Sea level rise preparedness in Miami-Dade County, FL Photo: Brian Ray AP


57 9/10 of wisdom.. is being wise, in time Theodore Roosevelt The Challenge: Sustainable Management of an Ever-Changing Planet