Response of Wildlife to Riparian Habitat. David A. Manuwal College of Forest Resources UW
|
|
|
- Charla Clarke
- 5 years ago
- Views:
Transcription

1 Response of Wildlife to Riparian Habitat David A. Manuwal College of Forest Resources UW
2 What Does Riparian Mean? Habitat adjacent to or along streams, rivers, (lakes, ponds, reservoirs and tidewater) A riparian habitat area is defined as the area adjacent to aquatic systems with flowing water (e.g. rivers, perennial or intermittent streams, seeps, springs) that contains elements of both aquatic and terrestrial ecosystems which mutually influence each other. (Knutson & Naef, 1997)
3 Riparian habitat is geographically very limited Since European colonization of Washington, 50-90% of riparian habitat has been lost or extensively modified

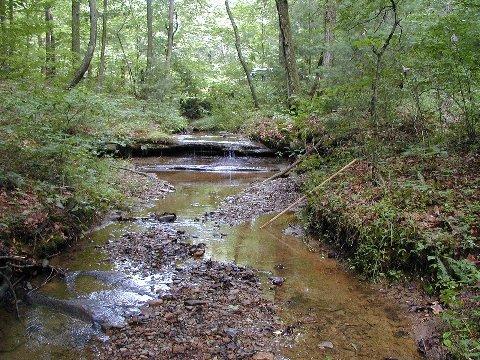
4 Rivers River Stream
5 Oakley et al. 1985
6 Habitat Functions Foraging and Watering Breeding and Rearing Hiding and Resting Thermal Cover Travel Corridors


7 Foraging and Watering Osprey Coyote Common Merganser Painted Turtle Mule Deer


8 Breeding and Rearing Harlequin Ducks Beaver Yellow Warbler Water Shrew Tailed frog Black-headed Grosbeak

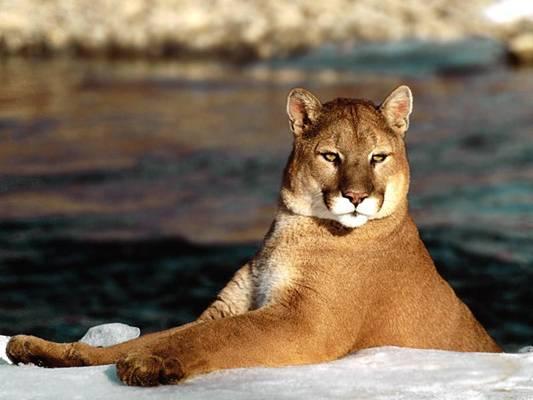
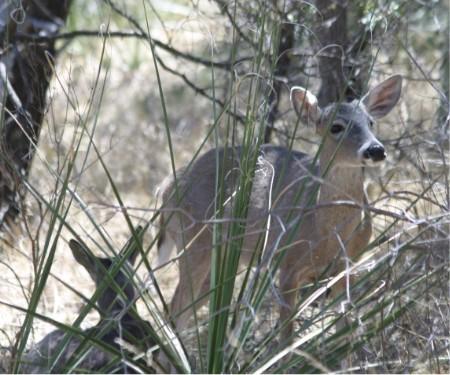

9 Hiding and Resting White-tailed Deer Cougar Frogs Grizzly Bear

10 Thermal Cover Elk Northern Spotted Owl


11 Travel Corridor Mule Deer Bald Eagle River Otter
12 Impacts of different levels of harvesting Riparian areas in production forest lands

13 Habitat Contrast Riparian areas are usually quite different than adjacent habitat In drier climates, the differences are greater


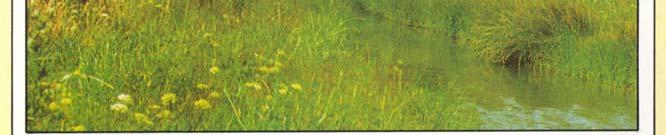
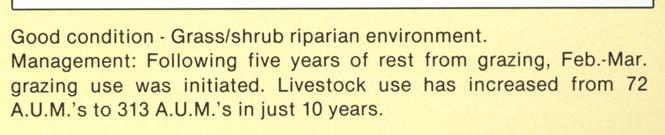
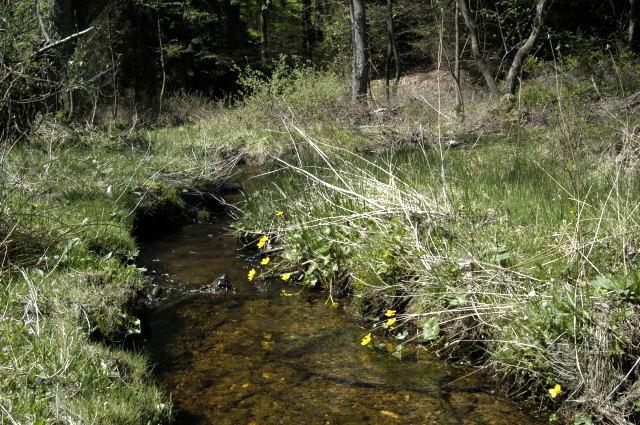
14 Major Concerns over Effects of Grazing on Riparian Areas Restoration Efforts Before After


15 Major Concerns over Effects of Grazing on Riparian Areas Restoration Efforts Before After


16 Major Concerns over Effects of Grazing on Riparian Areas Restoration Efforts Before After

17 NEBRASKA GAME & PARKS COMMISSION
18 Timber Fish & Wildlife Riparian Management Zone Study: an experimental investigation University of Washington Washington State University
19 Research Goals 1) compare species richness, diversity and abundance between riparian habitats and the adjacent upland habitats 2) examine the effects of buffer width on species richness, diversity and abundance by comparing the currently required buffer strips to modified buffer strips and controls 3) examine the habitat correlates that may provide insights into the observed patterns of species richness, diversity and abundance
20 1. Low elevation (<620m) Site Selection 2. Second-growth forest (55-65 yr old) Dominated by Douglas-fir 3. Type 3 water by forest regulations,type 4 if salmonids present 4. Predominately coniferous riparian canopy with deciduous tree component 5. > 500 m in stream length 6. Road access within 0.5 km 7. Could be harvested according to the project s specifications and time lines

21 Location of TFW-RMZ study sites
22 Study Design Total of 18 sites (6 replicates in each of 3 Buffer widths) Control (no harvest) State regulations (7-23m wide buffers) Modified buffers (21-48m wide buffers)

23 RMZ control site

24 Harvested at the state-regulated narrow buffer width (8m)

25 Harvested at the state-regulated narrow buffer width (8m)

26 RMZ modified buffer width harvest
27 Timing of Vertebrate Sampling Pre-harvest: one season (1993) Post-harvest: two seasons (1995 and 1996)
28 Riparian Site RMZ (8m wide) Upland Site 15m 200m 15m 100m Array of bird sampling points in the riparian and upland sampling areas.
29 Table 1. Mean (SE) numbers of detections (abundance) of common species (>25 total detections) along riparian and upland transects in Species Riparian Upland 1 American Robin 0.18 (0.07)a 0.02 (0.02)b Black-throated gray warbler 0.25 (0.06)a 0.09 (0.03)b Pacific-slope flycatcher 1.94 (0.13)a 1.21 (0.16)b Winter wren 3.05 (0.24)a 1.26 (0.15)b Brown creeper 0.16 (0.04)a 0.24 (0.05)a Chestnut-backed chickadee 3.21 (0.31)a 3.20 (0.29)a Golden-crowned kinglet 1.03 (0.17)a 1.37 (0.23)a Swainson s thrush 0.21 (0.07)a 0.23 (0.08)a Wilson s warbler 0.57 (0.17)a 0.43 (0.14)a 1 Means sharing the same letters do not differ (t-test, P > 0.05) in red).
30 Table 6. Mean 1 (SE) numbers of detections (abundance) of common (>15 total detections in a year) along the riparian management zone with no treatment (control), modified cut (modified), or cut According to state forest practices regulations (state). Values are standardized by the pre-harvest year (the pre-harvest year is subtracted from the mean of the two post-harvest years). Positive values indicate an increase in abundance post-harvest and negative values indicate a decrease. Species Treatment 2 Control Modified State Dark-eyed junco 0.00 (0.00)a 0.03 (0.02)a 0.33 (0.15)b American robin (0.16)a 0.14 (0.09)ab 0.48 (0.08)b Pacific-slope flycatcher 0.45 (0.17)a 0.73 (0.16)ab 1.13 (0.18)b Song sparrow 0.00 (0.00)a 0.16 (0.09)ab 0.29 (0.12)b 1 No differences (P s > 1.0) were detected in abundance of each species between years. Thus, abundance was pooled between the two post-harvest years. 2 Means sharing the same letters do not differ (ANOVA, Tukey s HSD-test, P > 0.10).
31
32
33 Conclusions about bird response Bird species richness higher in narrow buffer sites Total bird abundance was higher in riparian areas than in uplands Species turnover highest in narrow buffers and did not maintain preharvest levels Little difference in species turnover between controls and wide buffers

34 Mammal Response
35 Mammal species richness Mammal species diversity

36 So. Red-backed vole (Clethrionomys gapperi)
37 Marsh shrew (Sorex bendirii)

38 Trowbridge shrew (Sorex trowbridgii)

39 Shrew-mole (Neurotrichus gibbsii)

40 Creeping vole (Microtus oregoni)

41 Forest deer mouse (Peromyscus keeni)
42 Conclusions about mammal response Mammal species richness was higher in the riparian area than uplands before harvest Overall abundance was not different between riparian and uplands before harvest Species richness and diversity were not different among treatments No species showed a significant difference in capture rate among treatments There were non-significant treatment effects on some species
43 Aquatic amphibians

44 Tailed frog (Ascaphus truei)
")
45 Pacific giant salamander (Dicamptodon tenebrosus)
46 Terrestrial Amphibians
47 Terrestrial amphibian species richness

48 Western red-backed salamander (Plethodon vehiculum)
")
49 Ensatina (Ensatina eschscholtzii)
50 Conclusions about amphibian response Species richness did not differ between riparian and upland habitat Only 6 species were common enough for statistical analysis Ensatina was significantly less common on modified sties than the others Riparian buffers of about 8 m can support amphibians in the short-term after clearcut harvests
51 General Conclusions This study showed trends in response for some groups of wildlife Edge-related birds and mammals generally did well with the state-mandated buffer zones Riparian specialists did better in wider buffers Must be cautious in interpretations because of the limited post-harvest response time involved