A Salt Marsh Advancement Zone Assessment of Stamford, Connecticut
|
|
|
- Wilfred Lawson
- 5 years ago
- Views:
Transcription

1 A Salt Marsh Advancement Zone Assessment of Stamford, Connecticut
2 Front cover image: Open space and unprotected parcels critical to the conservation of marsh advancement corridors in Stamford; from the accompanying Comprehensive Map Book of Stamford, Connecticut.
3 Table of Contents Introduction... 2 Suitable vs. Unsuitable Advancement... 3 Marsh Advancement vs. Wetland Extent... 3 Planning for the Future... 3 Total Marsh Advancement... 4 Marsh Advancement in Open Space Parcels... 4 Total Advancement in Open Space Parcels... 4 Suitable Open Space Advancement by Owner... 5 Suitable Advancement by Open Space Parcel... 6 Marsh Advancement in All Parcels... 7 Total Advancement in All Parcels (OS vs. Non-OS)... 7 Suitable Advancement by All Parcels... 8 Appendix Map Book... 9 RECOMMENDED CITATION: Ryan, A. and A. W. Whelchel A Salt Marsh Advancement Zone Assessment of Stamford, Connecticut. The Nature Conservancy, Coastal Resilience Program. Publication Series #1-M, New Haven, Connecticut. ACKNOWLEDGEMENTS: This effort was made possible through partial funding by the Horizon Foundation, Vervane Foundation, and the McCance Foundation Trust. Page 1
4 Introduction In 2006, The Nature Conservancy established the Coastal Resilience Program ( that provides tools and a solution framework to reduce the ecological and socio-economic risk of hazards and comprehensively improve community resilience. The Program focuses on helping decision-makers explore locally relevant, downscaled, flooding scenarios from sealevel rise and/or storm surge, analyze the potential ecological, social and economic impacts of each scenario at a local, regional, and state scale, and facilitate solutions to address these issues. Since 2006, The Nature Conservancy has assisted many coastal and inland communities in Connecticut by providing this critical information and a comprehensive, community-based process that improves overall resilience and sustainability. There is a universal recognition by coastal and inland communities in Connecticut and elsewhere that natural infrastructure wetlands and forests - is a cost effective, long-term part of the solution to help protect people, infrastructure and natural systems from extreme weather and climatic change. Fortunately, our state has a remarkable diversity and abundance of natural resources that provide habitat for wildlife and fisheries, enhance the aesthetics and quality of life for residents, and, of course, defend the shoreline and rivers against storm surge, inland flooding, and sea level rise. The presence of natural resources across the state in particular salt marsh, beaches/dunes, forested headwaters, and river floodplains is the result of previous recognition and commitment to long-term conservation and the requisite balance with socio-economic growth. In order to maintain these natural resources it will require 1) routine and on-going management activities as well as the restoration of degraded areas, 2) forward-looking planning to accommodate changes in habitat composition and location due to climatic change and 3) enforcement, modification and/or development of new land use policies and growth strategies. Opportunities also exist to account for and integrate the services or co-benefits provided by natural infrastructure via new development, redevelopment, or realignment activities. Economically important services/co-benefits from natural infrastructure include wave attenuation, improved water storage and filtering of pollutants from surface runoff, erosion control, and improved aesthetics and desirable public amenities. Taken in total, the immediate and longer-term management of natural infrastructure by the state, towns, private property owners, non-profit organizations, and others will help to reduce hazard risk and improve resilience across Connecticut. While longer-term changes in temperature and precipitation patterns will alter the species composition and type of habitats in a given location, the more immediate implication is the upslope advancement of habitats such as salt marsh in response to continued sea level rise. Sea level rise and the impacts of flooding have and will continue to alter the presence and abundance of natural resources in Connecticut. One of the most noticeable changes is occurring at the shoreline s edge where salt marsh is in the process of advancing upslope into areas now considered uplands. In order to clearly identify where this will occur along Stamford s shoreline, The Nature Conservancy presents the following report to assist with future planning for natural resources in the context of overall risk reduction and resiliency improvement for the community. Ultimately, it is our hope that this report will serve to inform the community about Page 2
5 future marsh advancement locations, current land use of those locations and which parcels are critical to ensure the persistence of natural resources in Stamford longer term. The Salt Marsh Advancement Model used in this analysis was co-developed by The Nature Conservancy and the University of Connecticut s Department of Natural Resources Management and Engineering. A full discussion of the Model and underlying methodology is beyond the scope of this report, but a few important details are needed to put the following analysis into context and define how to use the results for planning and implementation. Suitable vs. Unsuitable Advancement In the following figures and tables suitable advancement areas are abbreviated as Yes and unsuitable areas are abbreviated as No. Suitable areas are classified based on the current land cover type - forest or agrigrass - and as such are expected to convert to salt marsh as hydrologic conditions change due to sea level rise, in the absence of further land use conversion. Land cover types classified as urban (i.e. roads, buildings, runways, parking lots, etc ) are considered to be unsuitable for salt marsh advancement at this time. Though much of our analysis is grouped by parcel ID and associated characteristics, these classifications suitable and unsuitable exist independent of the parcel boundaries. In other words, a given residential parcel can have both suitable (lawn) and unsuitable (building footprint) advancement areas. Marsh Advancement vs. Wetland Extent There is a key distinction in this report between the current wetland extent in a municipality and the marsh advancement areas analyzed herein. Marsh advancement areas include only the future projected wetland extent clipped to current upland land cover. Therefore, no assumption should be made about net gain or loss of current wetland extent based on this advancement area analysis. Another key consideration is that in some cases the identified advancement area will include land that converts to wetlands and subsequently to open-water over time. This further demonstrates that net change in both existing and future wetland extent should not be inferred from our analysis. Planning for the Future The advancement and eventual establishment of coastal marshes will occur over the course of several decades and as such our analysis extends out to the 2080s. The rate of change is slow and decadal, yet inevitable. There is an abundance of existing property, infrastructure and natural infrastructure assets clustered along the Connecticut coast and communities will need to formulate growth and realignment plans well in advance of the 2080s scenario presented here. The following data analysis and associated map book (Appendix) can assist with a resilient transition through the presentation of marsh advancement areas and an accounting of the projected changes to coastal property. Page 3
6 Total Marsh Advancement The full extent of marsh advancement in Stamford by the 2080s is projected to be acres, with acres (50.4%) having suitable (Yes) land cover for wetland advancement. The other acres (49.6%) are occupied by built structures and associated infrastructure and are unsuitable for marsh advancement (No), currently. Total Marsh Advancement by 2080s Percent Marsh Adv Acres (%) Yes No Total Marsh Advancement in Open Space Parcels Open space (OS) properties are a critical component of long-term community resilience because they currently have little to no development and are the most likely areas to remain undeveloped through the 2080s. The recognition of the role of these parcels in future wetland extent and improved resilience in Stamford is vital for strategic land management, economic development, and planning. Total Advancement in Open Space Parcels The following three categories are considered in this section: Yes OS: Areas of open space suitable for marsh advancement No OS: Areas of open space unsuitable for marsh advancement Non-OS: Unprotected areas both suitable and unsuitable for marsh advancement Stamford s open space parcels contain acres of total marsh advancement area with acres (21.9% of total) having a land cover suitable for future wetlands (Yes OS). Further analysis of the acres of unprotected parcels (Non-OS) can be found in the following Marsh Advancement in All Parcels section. Open Space Marsh Advancement 70.4% 21.9% 7.7% Yes OS No OS Non-OS Open Space Marsh Advancement OS type Acres Yes OS No OS 66.1 Non-OS Total Page 4
7 Suitable Open Space Advancement by Owner The City of Stamford owns the greatest share of suitable open space for marsh advancement accounting for acres (80.9%) across 31 properties. The remaining suitable open space occurs on privately owned properties and to a small extent, on Stamford Land Conservation Trust property. Suitable Open Space Advancement Total "yes" OS Acres (%) Total "yes" adv (%) Owner type City Private Non-profit Total Suitable Open Space Advancement (acres) City Private Non-profit Page 5
8 Acres (log) Suitable Advancement by Open Space Parcel Stamford has 44 open space parcels that intersect the full extent of marsh advancement by the 2080s. There are 8 open space parcels that each provides more than 3 acres of advancement area with a total aggregate of acres (94.8%) of Stamford s suitable open space marsh advancement area. The parcel with the most suitable marsh advancement zone, Cummings Park, contributes significantly more than all other parcel making up 38.1% of the total. Open Space parcels with > 3 acres of Suitable Marsh Advancement (n = 8) Parcel ID Open Space parcels with > 3 acres Suitable Marsh Advancement Parcel ID Acres Total "yes" OS Map Book Owner (%) Page # E City 6 S 213Z City 7 N 010Z Private 6 E City 6 S City 7 S Private 6 E 010Z Private 7 E City 6 Total Page 6
9 Acres Marsh Advancement in All Parcels This section incorporates all parcels into the analysis of suitable marsh advancement. These results help put the open space analysis into perspective, as well as identify important unprotected parcels in Stamford s marsh advancement landscape. Total Advancement in All Parcels (OS vs. Non-OS) Stamford s existing open space parcels are made up of a state park, municipal parks, municipal open space, land trust and other conservation non-profit properties, water company land, public schools, cemeteries, and private recreation areas including golf courses. This section provides an analysis of suitable areas for marsh advancement on these open space parcels versus all other parcels. These two types of parcels are designated as: OS for open space parcels Non-OS for all other parcels Open space parcels contain acres (43.5% of total) of suitable marsh advancement zone. The remaining acres of land suitable for marsh advancement (56.5% of total) are unprotected and generally occur on residential, commercial, or industrial properties. The unprotected suitable areas will receive a greater amount of marsh advancement by 2080s. This information has two important implications for future planning: 1) today s unprotected properties will play a vital role in maintaining Stamford s wetland resources in the future, and 2) a large amount of current development (362.4 acres) will be in direct conflict with rising sea levels and advancing marshes. 700 Total Marsh Advancement in All Parcels No Yes Total Marsh Advancement Parcel type Yes No Total OS Non-OS Total OS Non-OS Page 7
10 Acres (log) Suitable Advancement by All Parcels There are 1,208 parcels in Stamford that provide areas of suitable marsh advancement, but only 15 parcels offer suitable areas greater than 2 acres. This small subset provides acres of marsh advancement zone or 49.4% of Stamford s overall total. The specific parcels can be viewed via the corresponding Map Book pages (Appendix) indicated in the table below. 100 Parcels with > 2 acres of Suitable Marsh Advancement (n=15) 10 1 Parcel ID Open Space parcels in dark green Parcels with > 2 acres of Suitable Marsh Advancement Parcel ID Acres Total yes adv Map Book (%) Page # E S 213Z N 010Z W 001A ,6,16,30 E S S S ,6,12,26 E 010Z E ,6,15,29 E N ,6,20,34 W ,6,19,33 E 012D ,6,15,29 E ,6,16,30 Total Page 8
11 Appendix Map Book Please consult your Salt Marsh Advancement Resource Disc for the complete dataset of suitable and unsuitable advancement per parcel. Page 9
12
13 Comprehensive Map Book of Stamford, Connecticut
14 This pag e intentionally left blank
15 -- Table of Contents -- Overview Maps Marsh Advancement Unprotected Parcels Critical Parcels Inset Maps Unprotected Parcels Advancement per Parcel Page 1
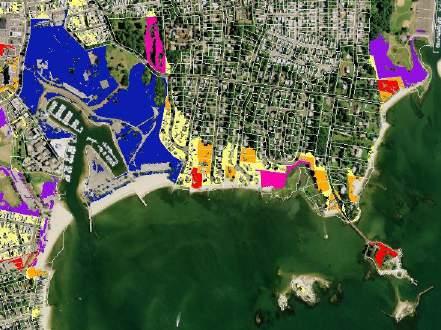
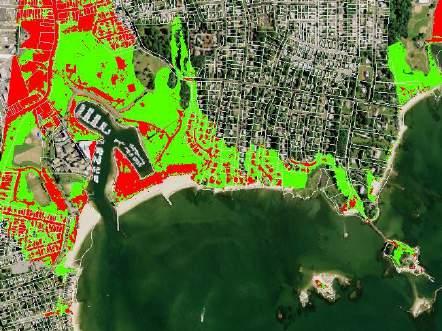
16 Marsh Advancement - West ± Marsh Advancement by 2080s Developed Land Cover Forest, Grass, Ag Land Cover 1 Mile West Page 2 East
17 Marsh Advancement - East Mile ± Marsh Advancement by 2080s Developed Land Cover Forest, Grass, Ag Land Cover West East Page 3
18 Unprotected Parcels - West Mile ± Parcels Marsh Advancement by 2080s Unprotected Non-OS Developed Land Cover Forest, Grass, Ag Land Cover Note: Only Non-OS parcels with > 2 acres of suitable advancement are shown. West East S W 001A 9168 E E E 012D 2056 W N Page 4
19 Unprotected Parcels - East Mile ± Parcels Marsh Advancement by 2080s Unprotected Non-OS Developed Land Cover Forest, Grass, Ag Land Cover Note: Only Non-OS parcels with > 2 acres of suitable advancement are shown. West East Page 5
20 Critical Parcels - West Mile ± Note: Only Non-OS parcels with > 2 acres of suitable advancement and OS parcels with > 3 acres of suitable advancement are shown. Parcels Unprotected Non-OS Protected OS West East E S N 010Z 9832 W 001A 9168 E E E S E E 012D 2056 W N Page 6
21 Critical Parcels - East Mile ± Note: Only Non-OS parcels with > 2 acres of suitable advancement and OS parcels with > 3 acres of suitable advancement are shown. Parcels Unprotected Non-OS Protected OS 58-00A West East S S 213Z 1864 E 010Z 4748 Page 7
22 This pag e intentionally left blank Page 8
23 Map Index - Unprotected Parcels Page 9
24 Feet ,000 2,000 see page 14 Unprotected Parcels - Map Parcels Unprotected Non-OS Marsh Advancement Developed Land Cover Forest, Grass, Ag Land Cover µ Note: Only Non-OS parcels with > 2 acres of suitable marsh advancement are shown. Page 10
25 see page 12 Feet ,000 2,000 see page 15 Unprotected Parcels - Map Parcels Unprotected Non-OS Marsh Advancement Developed Land Cover Forest, Grass, Ag Land Cover µ Note: Only Non-OS parcels with > 2 acres of suitable marsh advancement are shown. Page 11
26 see page 11 see page 13 S Feet ,000 2,000 see page 16 Unprotected Parcels - Map Parcels Unprotected Non-OS Marsh Advancement Developed Land Cover Forest, Grass, Ag Land Cover µ Note: Only Non-OS parcels with > 2 acres of suitable marsh advancement are shown. Page 12
27 see page 12 see page 14 Feet ,000 2,000 see page 17 Unprotected Parcels - Map Parcels Unprotected Non-OS Marsh Advancement Developed Land Cover Forest, Grass, Ag Land Cover µ Note: Only Non-OS parcels with > 2 acres of suitable marsh advancement are shown. Page 13
28 see page 10 see page 13 Feet ,000 2,000 see page 18 Unprotected Parcels - Map Parcels Unprotected Non-OS Marsh Advancement Developed Land Cover Forest, Grass, Ag Land Cover µ Note: Only Non-OS parcels with > 2 acres of suitable marsh advancement are shown. Page 14
29 see page 11 E see page 16 E 012D 2056 Feet ,000 2,000 see page 19 Unprotected Parcels - Map Parcels Unprotected Non-OS Marsh Advancement Developed Land Cover Forest, Grass, Ag Land Cover µ Note: Only Non-OS parcels with > 2 acres of suitable marsh advancement are shown. Page 15
30 see page 12 W 001A 9168 S see page 15 see page 17 Feet ,000 2,000 see page 20 Unprotected Parcels - Map Parcels Unprotected Non-OS Marsh Advancement Developed Land Cover Forest, Grass, Ag Land Cover µ Note: Only Non-OS parcels with > 2 acres of suitable marsh advancement are shown. Page 16
31 see page 13 see page 16 see page 18 Feet ,000 2,000 see page 21 Unprotected Parcels - Map Parcels Unprotected Non-OS Marsh Advancement Developed Land Cover Forest, Grass, Ag Land Cover µ Note: Only Non-OS parcels with > 2 acres of suitable marsh advancement are shown. Page 17
32 see page 14 see page 17 Feet ,000 2,000 Unprotected Parcels - Map Parcels Unprotected Non-OS Marsh Advancement Developed Land Cover Forest, Grass, Ag Land Cover µ Note: Only Non-OS parcels with > 2 acres of suitable marsh advancement are shown. Page 18
33 see page 15 W see page 20 Feet ,000 2,000 Unprotected Parcels - Map Parcels Unprotected Non-OS Marsh Advancement Developed Land Cover Forest, Grass, Ag Land Cover µ Note: Only Non-OS parcels with > 2 acres of suitable marsh advancement are shown. Page 19
34 see page 16 see page 19 N see page 21 Feet ,000 2,000 Unprotected Parcels - Map Parcels Unprotected Non-OS Marsh Advancement Developed Land Cover Forest, Grass, Ag Land Cover µ Note: Only Non-OS parcels with > 2 acres of suitable marsh advancement are shown. Page 20
35 see page 17 see page 20 Feet ,000 2,000 Unprotected Parcels - Map Parcels Unprotected Non-OS Marsh Advancement Developed Land Cover Forest, Grass, Ag Land Cover µ Note: Only Non-OS parcels with > 2 acres of suitable marsh advancement are shown. Page 21
36 This pag e intentionally left blank Page 22
37 Map Index - Advancement per Parcel Page 23
38 Feet ,000 2,000 see page 28 Advancement per Parcel - Map Area of Suitable Advancement < 0.5 acres > 20 acres µ Note: Only Non-OS parcels with > 2 acres of suitable marsh advancement are shown. Page 24
39 see page 26 Feet ,000 2,000 see page 29 Advancement per Parcel - Map Area of Suitable Advancement < 0.5 acres > 20 acres µ Note: Only Non-OS parcels with > 2 acres of suitable marsh advancement are shown. Page 25
40 see page 25 see page 27 S Feet ,000 2,000 see page 30 Advancement per Parcel - Map Area of Suitable Advancement < 0.5 acres > 20 acres µ Note: Only Non-OS parcels with > 2 acres of suitable marsh advancement are shown. Page 26
41 see page 26 see page 28 Feet ,000 2,000 see page 31 Advancement per Parcel - Map Area of Suitable Advancement < 0.5 acres > 20 acres µ Note: Only Non-OS parcels with > 2 acres of suitable marsh advancement are shown. Page 27
42 see page 24 see page 27 Feet ,000 2,000 see page 32 Advancement per Parcel - Map Area of Suitable Advancement < 0.5 acres > 20 acres µ Note: Only Non-OS parcels with > 2 acres of suitable marsh advancement are shown. Page 28
43 see page 25 E see page 30 E 012D 2056 Feet ,000 2,000 see page 33 Advancement per Parcel - Map Area of Suitable Advancement < 0.5 acres > 20 acres µ Note: Only Non-OS parcels with > 2 acres of suitable marsh advancement are shown. Page 29
44 see page 26 W 001A 9168 E see page 29 see page 31 Feet ,000 2,000 see page 34 Advancement per Parcel - Map Area of Suitable Advancement < 0.5 acres > 20 acres µ Note: Only Non-OS parcels with > 2 acres of suitable marsh advancement are shown. Page 30
45 see page 27 see page 30 see page 32 Feet ,000 2,000 see page 35 Advancement per Parcel - Map Area of Suitable Advancement < 0.5 acres > 20 acres µ Note: Only Non-OS parcels with > 2 acres of suitable marsh advancement are shown. Page 31
46 see page 28 see page 31 Feet ,000 2,000 Advancement per Parcel - Map Area of Suitable Advancement < 0.5 acres > 20 acres µ Note: Only Non-OS parcels with > 2 acres of suitable marsh advancement are shown. Page 32
47 see page 29 W see page 34 Feet ,000 2,000 Advancement per Parcel - Map Area of Suitable Advancement < 0.5 acres > 20 acres µ Note: Only Non-OS parcels with > 2 acres of suitable marsh advancement are shown. Page 33
48 see page 30 see page 33 N see page 35 Feet ,000 2,000 Advancement per Parcel - Map Area of Suitable Advancement < 0.5 acres > 20 acres µ Note: Only Non-OS parcels with > 2 acres of suitable marsh advancement are shown. Page 34
49 see page 31 see page 34 Feet ,000 2,000 Advancement per Parcel - Map Area of Suitable Advancement < 0.5 acres > 20 acres µ Note: Only Non-OS parcels with > 2 acres of suitable marsh advancement are shown. Page 35

50