European Union Directorate-General for Agriculture and Rural Development
|
|
|
- Byron Cunningham
- 6 years ago
- Views:
Transcription
1 European Union Directorate-General for Agriculture and Rural Development RURAL DEVELOPMENT IN THE EUROPEAN UNION STATISTICAL AND ECONOMIC INFORMATION Report 2006 August 2006
2
3 FOREWORD Each year the Commission publishes an Agricultural Annual Report on the agricultural situation in the European Union. A large part of the report is devoted to statistical information on Community agriculture. This is drawn up on the basis of information from Eurostat and data collected by the Directorate-General for Agriculture and Rural Development. Directorate-General for Agriculture and Rural Development also devotes a special annual publication "Agriculture in the European Union - Statistical and economic information", separate from the Agricultural Annual Report, to a wide range of subjects, including the economic situation in agriculture, structures, trade, markets, financial aspects and rural development. With the evolution of the Common Agricultural Policy, rural development gained in importance and information needs have also evolved. For this reason, DG Agriculture and Rural Development has prepared a specific report aiming to provide, on a regular basis, a comprehensive set of information on rural areas and the implementation of the EU's rural development policy. Most of the information presented in this report can be found in existing databases and reports (Eurostat databases, European Environmental Agency databases and reports, DG AGRI statistical, monitoring and financial reports). These remain the reference source for the relevant data.
4
5 TABLE OF CONTENTS CHAPTER 1 INTRODUCTION Policy context Data sources and issues Limited data availability The definition of "rural" areas The various financial instruments funding EU-25 RD policy 3 CHAPTER 2 SITUATION Importance of rural areas Socio-economic situation in rural areas Sectoral economic indicators Agriculture Food industry Forestry Environment Diversification and quality of life in rural areas Implementation of Rural Development Policy Monitoring of measures financed by the Guarantee section of EAGGF for EU Monitoring of measures financed by SAPARD Overview of Rural development Financial Implementation 11 CHAPTER 3 STATISTICAL DESCRIPTION 15 Foreword 17 List of indicators 21 Correspondence table between the CMEF order & RD Report numbering 22 Correspondence table between the NUTS levels and the national administrative units 24 Correspondence table between the country codes and the country names 25 SECTION 3.1 IMPORTANCE OF RURAL AREAS Designation of rural areas Importance of rural areas - % territory in rural areas Importance of rural areas - % population in rural areas Importance of rural areas - % GVA in rural areas Importance of rural areas - % employment in rural areas SECTION 3.2 SOCIO-ECONOMIC SITUATION IN RURAL AREAS Population density Age structure Economic development Structure of the Economy Structure of Employment
6 3.2.6 Employment rate Unemployment Long-term unemployment SECTION 3.3 SECTORAL ECONOMIC INDICATORS Employment development of primary sector Economic development of primary sector Agricultural land use Farm structure - Number of farms Farm structure - Utilized agricultural area Farm structure - Average area farm size and distribution Farm structure - Average economic farm size and distribution Farm structure - Labour Force Importance of semi-subsistence farming in NMS Training and education in agriculture Age structure in agriculture Labour productivity in agriculture Gross fixed capital formation in agriculture Labour productivity in food industry Gross fixed capital formation in food industry Employment development in food industry Economic development of food industry Forestry structure - Area of forest available for wood supply (FAWS) Forestry structure - Ownership (% area of FAWS under "eligible" ownership) Forestry structure - Average size of private holding (FOWL) Forest productivity Labour productivity in forestry Gross fixed capital formation in forestry SECTION 3.4 ENVIRONMENT Land cover Less Favoured Areas Areas of extensive agriculture - % UAA for extensive arable crops Areas of extensive agriculture - % UAA for extensive grazing Natura 2000 area - % territory under Natura Natura 2000 area - % UAA under Natura Natura 2000 area - % forest area under Natura Biodiversity: Population of farmland birds Biodiversity: High Nature Value farmland areas Biodiversity: Tree species composition Biodiversity: Protected forest Development of forest area Forest ecosystem health Water quality Water quality: Gross Nutrient Balances - Gross nitrogen balance Water quality: Gross Nutrient Balances - Gross phosphorus balance Water quality: Pollution by nitrates and pesticides - Pollution by nitrates Water use Protective forests concerning primarily soil and water Soil: Areas at risk of soil erosion Soil: Organic farming Climate change: Production of renewable energy from agriculture Climate change: Production of renewable energy from forestry Climate change: UAA devoted to renewable energy Climate change: GHG emissions from agriculture SECTION 3.5 DIVERSIFICATION AND QUALITY OF LIFE IN RURAL AREAS Farmers with other gainful activity Employment development of non-agricultural sector Economic development of non-agricultural sector
7 3.5.4 Self-employment development Tourism infrastructure in rural area Internet infrastructure Internet take-up in rural areas Development of services sector Net migration Educational attainment Life-long learning in rural areas Development of Local Action Groups ANNEXES 151 ANNEX 3.A - Glossary of Terms & Definitions 153 ANNEX 3.B - Main Sources 159 ANNEX 3.C - Technical Annex 163 Objective related Baseline Indicators 163 Context related Baseline Indicators 177 ANNEX 3.D OBJECTIVE-RELATED BASELINE INDICATORS DATA AT REGIONAL LEVEL 191 ANNEX 3.D.a OBJECTIVE-RELATED BASELINE INDICATORS DATA AT NUTS 2 & 3 LEVELS 195 ANNEX 3.D.b OBJECTIVE-RELATED BASELINE INDICATORS DATA AT FSS REGION & DISTRICT LEVELS 289 CHAPTER 4 IMPLEMENTATION OF RURAL DEVELOPMENT POLICY 319 Foreword 321 List of Tables 322 SECTION 4.1 RURAL DEVELOPMENT MEASURES MONITORING INDICATORS 323 SECTION EAGGF GUARANTEE RURAL DEVELOPMENT MEASURES MONITORING FOR EU Overview of Rural Development Measures implemented by Member States in Rural Development Public Expenditure Committed by Measure Rural Development Public Expenditure Committed by Member State Measure for Investment in Agricultural Holdings Measure for Setting-up of Young Farmers Measure for Training Measure for Early Retirement Measure for Less Favoured Areas Measure for Areas with Environmental Restrictions Measures for Agri-Environment - Crops Measures for Agri-Environment - Breeds in Danger of being Lost to Farming Measure for Improving Processing and Marketing of Agricultural Products Measure for Afforestation: Establishment Costs Measure for Afforestation: Maintenance Costs and Income Loss Other Forestry Measures Measures for Promoting the Adaptation and Development of Rural Areas Measures for Promoting the Adaptation and Development of Rural Areas - Land Improvement Measures for Promoting the Adaptation and Development of Rural Areas - Reparcelling Measures for Promoting the Adaptation and Development of Rural Areas - Setting-up of Farm Relief and Farm Management Services Measures for Promoting the Adaptation and Development of Rural Areas - Marketing of Quality Agricultural Products Measures for Promoting the Adaptation and Development of Rural Areas - Basic Services for the Rural Economy and Population Measures for Promoting the Adaptation and Development of Rural Areas - Renovation and Development of Villages and Protection and Conservation of the Rural Heritage Measures for Promoting the Adaptation and Development of Rural Areas - Diversification of Agricultural Activities and Activities Close to Agriculture to provide Multiple Activities or Alternative Incomes Measures for Promoting the Adaptation and Development of Rural Areas - Agricultural Water Resources Management
8 Measures for Promoting the Adaptation and Development of Rural Areas - Development and Improvement of Infrastructure connected with the Development of Agriculture Measures for Promoting the Adaptation and Development of Rural Areas - Encouragement for Tourist and Craft Activities Measures for Promoting the Adaptation and Development of Rural Areas - Protection of the Environment in connection with agriculture, forestry and landscape conservation as well as the Improvement of Animal Welfare Measures for Promoting the Adaptation and Development of Rural Areas - Restoring Agricultural Production Potential damaged by Natural Disasters and Introducing appropriate Prevention Instruments Measures for Promoting the Adaptation and Development of Rural Areas - Financial Engineering SECTION SPECIAL ACCESSION PROGRAMME FOR AGRICULTURE AND RURAL DEVELOPMENT MEASURES MONITORING FOR NMS-8 & ACCESSION COUNTRIES SAPARD Expenditure by Measure for NMS-8, Bulgaria and Rom ania SAPARD Expenditure by Country for NMS-8, Bulgaria and Rom ania SAPARD Financial Allocation & Contribution in the Czech Republic SAPARD Financial Allocation & Contribution in Estonia SAPARD Financial Allocation & Contribution in Latvia SAPARD Financial Allocation & Contribution in Lithuania SAPARD Financial Allocation & Contribution in Hungary SAPARD Financial Allocation & Contribution in Poland SAPARD Financial Allocation & Contribution in Slovenia SAPARD Financial Allocation & Contribution in Slovakia SAPARD Financial Allocation & Contribution in Bulgaria SAPARD Financial Allocation & Contribution in Romania SECTION 4.2 RURAL DEVELOPMENT BUDGET EXPENDITURE MONITORING 351 SECTION OVERVIEW OF RURAL DEVELOPMENT FINANCIAL IMPLEMENTATION 353 Section GENERAL OVERVIEW Rural Development Financial Plan and Budget Expenditures by Type of Instrument, EU Rural Development Financial plan, Summary Table by Country, Type of Instrument and Year, EU i Rural Development Expenditure, Summary Table by Country, Type of Instrument and Year, EU ii Rural Development Expenditure, , by Type of Instrument, EU27 Section EAGGF GUIDANCE EAGGF Guidance Financial Plan by Member State, EU EAGGF Guidance Expenditure by Member State, EU EAGGF-Guidance Financial Plan and Expenditure by Member State and Objective - EU EAGGF-Guidance Financial Plan and Expenditure by Mem ber State and Objective - NMS EAGGF-Guidance and TRDI Financial Plan by Mem ber State, NMS EAGGF-Guidance and TRDI Expenditure by Member State Section EAGGF GUARANTEE EAGGF-Guarantee Financial Plan by Member State EAGGF-Guarantee Expenditure by Mem ber State EAGGF-Guarantee Expenditure by Member State & by Measure EAGGF-Guarantee Expenditure in EU-15 by Measure Section SAPARD SAPARD Financial Plan by Country SAPARD Expenditure by Country SAPARD Financial Plan by Measure - NMS SAPARD - EU Contribution as com mitted by Country, by Meas ure, NMS SAPARD Financial Plan and EU Contribution as committed by Country, by Measure - Accession Countries SECTION FINANCIAL IMPLEMENTATION OF EAGGF-GUARANTEE BY MEASURE Measure for Investment in Agricultural Holdings Measure for Setting-up of Young Farmers Measure for Training Measure for Early Retirement
9 Measure for Less Favoured Areas Agri-Environmental Measures Measure for improving Processing and Marketing of Agricultural Products Forestry Measures Measures for Encouragement of Adaptation / Development of Rural Areas SECTION FINANCIAL IMPLEMENTATION OF EAGGF-GUARANTEE BY MEMBER STATE Rural Development Expenditure in the EU Rural Development Expenditure in Belgium Rural Development Expenditure in Denmark Rural Development Expenditure in Germany Rural Development Expenditure in Greece Rural Development Expenditure in Spain Rural Development Expenditure in France Rural Development Expenditure in Ireland Rural Development Expenditure in Italy Rural Development Expenditure in Luxembourg Rural Development Expenditure in the Netherlands Rural Development Expenditure in Austria Rural Development Expenditure in Portugal Rural Development Expenditure in Finland Rural Development Expenditure in Sweden Rural Development Expenditure in the United Kingdom
10
11 CHAPTER 1 INTRODUCTION 1.1. Policy context Rural development policy seeks to establish a coherent and sustainable framework for the future of Europe's rural areas. In its early days, rural development policy was essentially sectoral (dealing mainly with agricultural structures) with limited territorial aspects. Agenda 2000 established rural development policy as the second pillar of the EU's Common Agricultural Policy and brought rural development under a single regulation to apply across the whole of the European Union for the period Besides agricultural restructuring, it addressed environmental concerns and the wider needs of rural areas. The guiding principles are those of decentralisation of responsibilities - thus strengthening subsidiarity and partnership - and flexibility of programming based on a 'menu' of 22 measures (extended to 26 with the mid-term review of the CAP) to be targeted and implemented according to Member States' specific needs. As a coherent package of measures it has three main objectives: (1) To create a stronger agricultural and forestry sector, the latter recognised for the first time as an integral part of the rural development policy; (2) To improve the competitiveness of rural areas; (3) To maintain the environment and preserve Europe's rural heritage. In 2003, the mid-term review of the CAP added new measures to promote quality and animal welfare, and help for farmers to meet new EU standards. It also led to a strengthening of rural development policy via the provision of more EU money for rural development through a reduction in direct payments ( modulation ) for bigger farms. In September 2005, the Council of Ministers adopted a Rural Development regulation for the period Rural Development will be implemented through one fund, one management and control system and one type of programming. The aims of the policy have been simplified and clarified around three clearly defined economic, environmental and territorial objectives: (1) improving the competitiveness of agriculture and forestry; (2) improving the environment and the countryside; (3) improving the quality of life in rural areas and encouraging diversification of economic activity Data sources and issues Most of the information presented in this report can already be found in various sources and documents (Eurostat databases, European Environmental Agency, DG AGRI statistical and financial reports), but has been compiled in a structured way for the first time in a single document. This report contains in general two types of information: (1) statistical and scientific information on the main features of rural areas, (2) administrative information on the status of the implementation of Rural Development Policy (physical and financial monitoring of the measures). 1
12 In order to ensure the highest relevance of the data to current issues in rural development, priority has been given to the set of common "baseline" indicators which has been proposed in the context of the Common Monitoring and Evaluation Framework (CMEF) for Rural Development Programs Three important data issues need to be mentioned: (1) Weaknesses concerning the data availability, (2) The absence of a common fully satisfactory definition of "rural" areas, (3) The complexity of reporting the implementation due to the various financial instruments funding EU-25 RD policy Limited data availability For rural development analysis, there is a need for a detailed geographical breakdown. This is obvious for the environmental aspects but is also necessary for the diversification and the quality of life in local economies. However, it should be stressed that the purpose of the information presented in this report is not to monitor, for example, the specific environmental situation in a particular area or the socio-economic development in a particular village, but rather to assess overall trends and diversity of situations. The need for detailed geographical breakdown has a secondary effect on the availability of time series as the delineation of many geographical units has evolved over times (e.g. some regions have been merged or split, or their boundaries have been modified). Building time series with a detailed geographical breakdown is therefore very resource intensive. In this first report, only a picture for a "central year" at EU-25 level is given. Before the work began in the context of the Common Monitoring and Evaluation Framework (CMEF) for Rural Development programs , there was no clear list and definitions of common RD baseline indicators 1. As a consequence, some variables are/were not collected, or at least not in a systematic way. However, it should be stressed that the baseline indicators of CMEF for rural development have been developed in an operational context, based largely on data availability (even if sometimes limited). Therefore, the list of selected indicators benefited from existing or ongoing work. For instance, environment indicators are largely based on the IRENA project which aimed to develop agrienvironmental indicators. Some other indicators have been extracted from the lists of Structural Indicators or Sustainable Development Indicators developed by Eurostat. For some of the issues concerned, the data sources are not statistical series but the results of modelling or mapping techniques. Results are therefore closely linked to the methodology applied The definition of "rural" areas Although "rural" areas have been analysed in many countries for decades, there is no single commonly internationally accepted definition. The main reasons are as follows: (1) the various perceptions of what is (and what is not) rural and of the elements characterizing "rurality" (natural, economic, cultural, etc), (2) the inherent need to have a tailor-made definition according to the "object" analysed or policy concerned, (3) the difficulty to collect relevant data at the level of basic geographical units (administrative unit, grid cell, plot, etc). 1 The "PAIS" project supported by Eurostat provided the first elements to develop RD indicators. 2
13 For statistical reporting, whatever the methodology adopted, the determining factor is the availability of statistics for the selected regional units. For the EU, it implies that the methodology must be able to define the "rural" character of the NUTS regions as most socio-economic data are usually only available at this level. The Commission has consistently used the OECD methodology, e.g. in the Strategic Guidelines for RDP and therefore this report defines rural areas using the OECD methodology. Furthermore, this is the most widely used approach (see Box 1). However, it should be noticed that the results of this methodology are sometimes considered as imperfectly reflecting the rural character of areas, particularly in densely populated regions 2. Box 1: OECD methodology to define in rural areas The OECD methodology is based on population density (OECD, Creating rural indicators for shaping territorial policy, Paris, 1994). It is based on a two-step approach : First, local units (e.g. municipalities) are identified as rural if their population density is below 150 inhabitants per square kilometre. Then, regions (e.g. NUTS 3 or NUTS 2), are classified in one of the 3 categories: Predominantly Rural region (PR) : if more than 50% of the population of the region is living in rural communes (with less than 150 inhabitants / km 2 ) Intermediate Region (IR) : if 15% to 50% of the population of the region is living in rural local units Predominantly Urban region (PU) : if less than 15% of the population of the region is living in rural local units. Characterisation of the rural character at regional level, where most of the statistics are available, allows drawing easily a picture of the different types of areas at national level. As for the first step, the method requires information on population and areas at local level, the characterisation can only be made with a long periodicity (in general every 10 years when a population census is made). The OECD methodology is the only definition of rural areas internationally recognised. However, the results of this methodology are sometimes considered as imperfectly reflecting the rural character of areas, particularly in densely populated regions. The methodology is therefore sometimes adapted or replaced by another approach The various financial instruments funding EU-25 RD policy Due to the evolution of policy needs concerning rural development and to the enlargement of the European Union, rural development policy has been implemented through different financial instruments over the period (see an overview in Box 2). As the monitoring and financial information available for these various instruments are different, it is not possible to describe in a unified manner the implementation of RD policy. For this first report, it has not been possible to consolidate all the information from the different instruments to give an EU-25 global picture for all aspects. A first part provides information on the monitoring of the measures funded by the Guarantee section of EAGGF for EU-15 in 2003, as very detailed information is available. It also gives some information from the monitoring of SAPARD over the period A second part is dedicated to the financial implementation of the various instruments over the period For this reason, several initiatives have been launched in the European Commission (Eurostat, Joint Research Centres, DG Regional Policy, DG Agriculture and Rural Development) with a view to develop an alternative methodology. 3

 EAGGF Guarantee EAGGF Guidance CY & MT Outside Objective 1 In Objective 1 TRDI TRDI EAGGF Guidance Outside Objective 1 TRDI 8 other NMS In Objective 1 SAPARD TRDI EAGGF Guidance BG & RO")
14 Box 2: Community funding rural development For the period EU-25 Source: DG AGRI (2003) - Fact Sheet Rural Development in the European Union For the period : EU-15 Outside Objective 1 In Objective 1 EAGGF Guarantee for all measures (excl. Leader+) EAGGF Guarantee EAGGF Guidance CY & MT Outside Objective 1 In Objective 1 TRDI TRDI EAGGF Guidance Outside Objective 1 TRDI 8 other NMS In Objective 1 SAPARD TRDI EAGGF Guidance BG & RO SAPARD Leader+ (programmes/measures) are funded everywhere by EAGGF Guidance EAGGF: European Agricultural Guidance and Guarantee Fund SAPARD: Special Pre-accession Programme for Agriculture and Rural Development 4
15 CHAPTER 2 SITUATION 2.1. Importance of rural areas (tables & maps/graphs to ) In the EU-25 rural areas (predominantly rural and intermediate regions) represent 92% of the territory and 56% of the population. The corresponding shares for predominantly rural areas are 56% of the territory and 19% of the population. Rural areas are therefore particularly important in terms of territory. Among the Member States, the importance of rural areas varies from the more "Urban" 1 ones (BE, NL, MT) to the more "Rural" 2 ones (IE, SE, FI, SI) along a continuum where Intermediate Regions can play a major role (CZ, EE, CY, LU, SK). Even if economic activity tends to be concentrated in more urban areas, rural areas generate 45% of the Gross Value Added (GVA) in EU-25 and provide 51% of the employment, these shares being larger in the new Member States and in Bulgaria and Romania Socio-economic situation in rural areas (tables & maps/graphs to 3.2.8) In most rural areas, a first characteristic is the low level of concentration of the population: at EU-25 level, population density varies from 38 inhabitants/km² in predominantly rural areas to 632 inhabitants/km² in predominantly urban areas. This range is of course even larger when looking at national or regional levels. At EU-25 level, the age structure of the population does not vary significantly between different types of areas, even if the proportion of old people (65 years old and more) is often slightly higher in predominantly rural areas. It seems that age structure is more influenced by differences in demography between MS. For instance, in rural areas, there is generally a larger proportion of old people in EU-15 whereas there are relatively more young people (less than 15 years old) in the New MS. In the New MS, the share of population between 15 and 64 years old is also significantly higher in urban areas. At EU-25 level, the income per habitant is around a quarter less in rural areas and generally increases with a higher urban character 3. The situation is accentuated in the New MS as the general level of income is about half of the EU-25 average. The primary sector still plays an important role in the economy of the rural areas in EU- 25, more in terms of employment (13%) than in terms of value added (5%). This situation is more marked in the New MS, with the corresponding shares standing at 22% and 7% respectively. In general, even in rural areas, the majority of the economic activity depends on the service sector. The employment rate is slightly lower in rural areas for EU-25 as a whole (61% against 63% for all areas). However, this is not a systematic feature at MS level 4. With a few exceptions, the unemployment rate (including long-term unemployment) is in general lower in urban areas than in rural areas, whereas the opposite situation is observed in With more than half of the territory and of the population in Predominantly Urban regions. With more than half of the territory and of the population in Predominantly Rural regions. With the noticeable exception of Estonia. This result is influenced by the statistical measurement as the GDP is evaluated in the place of work and not in the place of residence. Due to data availability, this indicator and the following one related to long term unemployment (and unemployment rate in some cases) are evaluated at NUTS-2 level which only enable to provide a rough delineation of rural areas. 5
16 EE, DE, FR, LV and PT where the unemployment rate is lower in predominantly rural areas Sectoral economic indicators (tables & maps/graphs to 3.3.2) With around 9.8 mio persons employed in 2002 in EU-25, the primary sector represented an important part of the EU economy in terms of employment: 5% for EU- 25, 12% on average in the New MS (18% in Lithuania and Poland), more than one quarter in Bulgaria and more than one third in Romania. In EU-25 the primary sector (agriculture, hunting, forestry and fishing) reached around 185 bio euros in 2002 and accounted for 2% of GDP, ranging from 0.6% in Luxemburg to 7% in Greece and Lithuania. It even reached 12% of GDP in Bulgaria and 17% in Romania. The primary sector represents a more important part of the economy in rural areas than in more urban areas: 13% of employment and 5% of GDP in rural areas at EU-25 level Agriculture (tables & maps/graphs to 3.3.8) In 2003, agriculture utilised 156 mio ha in EU-25 of which 60% were dedicated to arable crops, 33% to permanent pastures and 7% to permanent crops. As the distribution depends mainly on natural conditions, there are major variations between (and generally inside) Member States. Typical examples are the importance of permanent crops (vineyards, olive trees) in dry areas of Mediterranean countries (e.g. EL, CY, IT, PT, ES) or the major share of permanent pastures in mountain or rainy areas (e.g. IE, UK, SI, AT, LU, NL). In EU-25, 88% of the 9.9 mio farms and 89% of agricultural area lie in rural areas (in predominantly rural areas: 33% of farms and 23% of agricultural area). It means that in some MS (BE, NL, MT but also UK, IT, DE, ES), a significant part of agricultural activities still takes place in areas designated as "urban", highlighting the role of periurban areas. The average EU-25 farm size is 16 hectares with important variations between MS. In general, farm sizes are higher than the average in EU-15 (with the exception of EL, IT and PT) and lower in the New MS (with the exception of CZ, EE and SK). Variations in structure are also important between regions of the same MS (e.g. in PT) and within some regions (e.g. in most Greek regions). Variations between MS and regions are even greater when measuring the economic size 5 of farms: on average, the economic size of farms in the New Member States is six times lower than in EU-15 (the Czech Republic is the only New Member State above the EU-25 average economic size) 6. In general, the physical size of farms increases as areas become more rural, reflecting the lower demand of land for other activities. Agriculture is often based on more extensive farms in rural areas as, in most cases, the economic size of farms is lower in rural areas. 5 6 The economic size is measured by the potential gross value added which takes into account the type of production and the average yields and prices at regional level (European Size Unit). It should be noticed that the economic size is measured in euros. Variations would be attenuated when using another currency unit such as the purchasing power parities which take into account the cost of living. 6
17 The total labour force in agriculture represents around 9.9 mio annual work units for EU- 25, more than 85% of which work in rural areas. If the basic feature of agriculture in the EU is family farming with 1 to 1.5 full-time jobs, holdings with high labour force requirements are more common in some Member State. Very small farms that could be considered as based on semi-subsistence activities are very important in some Member State, particularly in the New Member State. In several of these, half of the farms have a potential gross value added per year of less than euros (i.e. with an economic size of less than 1 European Size Unit) 7. Only 17% of farmers in the EU-15 have a basic or full training in agriculture, ranging from 3% in Greece to 64% in The Netherlands. At EU-25 level there is approximately 1 farmer less than 35 years old for each 5 farmers of more than 55 years. In some Member States (Portugal, Italy, United-Kingdom, Slovenia), the proportion of "young" farmers is very low (less than 1 "young" farmer for every 10 "older" farmers) whereas in some others (Poland, Germany, Austria) there is around 1 "young" farmer for every 2 "older" farmers). What appears as a general pattern in all Member State is an increasing share of "young" farmers the higher the rural character of the areas. The labour productivity of farming 8 differs considerably across the EU, particularly between the old and the New Member States. On average, for the period , labour productivity in the EU-15 was around 50% higher than the EU-25 level, whereas it was five times lower in the New Member States. For EU-15, the sectors with the highest labour productivity appeared to be the pigs and poultry sector and the cereals sector. At the other extreme of the spectrum, permanent crops activity seemed to be the least productive (73% of the average productivity of EU- 15 and below the national average in all Member States). The grazing livestock sector and horticulture stand in between, with high variations due to the variety of undertakings (e.g. milk, beef or sheep and goat production). Gross Fixed Capital Formation in EU-25 reached 44 bio euros in 2003, of which 95% took place in the EU-15. The rate of investment, measured by the ratio between the Gross Fixed Capital Formation and the Gross Value Added, was on average close to 28% for the EU-15 and for the New Member States. It varied between 13% in Spain and 84% in Luxembourg. Among the New Member States, high rates (above 40%) are observed in Latvia, Lithuania, Hungary and Slovenia Food industry (tables & maps/graphs to ) The food industry represents an important part of the EU economy accounting for 4.6 mio jobs (2.3% of total employment) and 2.2% of GDP for EU-25. It is relatively particularly important in Ireland, the Czech Republic and Hungary. The rate of investment, measured by the ratio between Gross Fixed Capital Formation and Gross Value Added, is particularly high in Portugal and Slovakia (>30%). Labour productivity is difficult to measure in the food industry as there is limited information concerning the labour force, due to the importance of seasonal or part-time 7 8 This information should be used with cautious as it is very sensitive to the definition of a farm and to the threshold of the survey adopted by the Member States. It explains the high proportion of very small farms recorded in UK in the Farm Structure Survey 2003 for which the national authorities decided to cover all farms left outside the field of observation in the previous surveys. Measured by the Gross Value Added at basic prices per Annual Work Unit. 7
18 employment in this sector. The estimate for EU-15 is around 50 thousands euros per person employed Forestry (tables & maps/graphs to ) In the EU-25 the forest available for wood supply covers around 117 mio ha. Whereas it represents 73% of the total forest area for EU-25, the share of productive forest is much lower in Mediterranean countries. Around 65% of this forest belongs to private owners, this part being in general lower in the new Member States. In most Member States, the average size of the forest owned by private owners is low (for instance lower than the average farm size). Forest productivity varies significantly among Member States, from 1.0 thousands m³/year/ha in Cyprus to 8.8 thousands in Germany (4.9 thousands for EU-25). Due to the relatively low importance of the forestry sector in some Member States, the economic information is very limited in many of them. Based on the available information, one could estimate that Gross Fixed Capital Formation in the EU forestry sector reached around 1.9 bio euros per year in the period , i.e. around 19% of the GVA of the sector. Due to the same difficulty to that of the food industry, labour productivity is difficult to measure in the forestry sector. The estimate for EU is around 38 thousands euros per person employed Environment (tables & maps/graphs to ) Agriculture and forestry represent 78% of land use in the EU-25, ranging from 50% in Malta to 95% in Poland. In the Mediterranean countries, the British Islands and Scandinavia, natural areas also cover a large part of the territory. Artificial areas represent a significant part of the territory only in Malta, Belgium and The Netherlands. Agriculture and forestry therefore play a major role for the environment and landscapes in Europe. A considerable part of the agriculture area is located in regions where conditions are difficult for this activity, for instance in mountains. Extensive farming covers at least 10% of area for arable crops and 21% of area for grazing animals in EU-25. It is estimated that high nature value farming systems cover more than 10% of agricultural area in most Member States (even more than 30% in some of them 9 ). The implementation of Natura 2000 has represented a significant contribution to the preservation of the biodiversity. The designated sites cover around 12% of agricultural area of the EU-15 and even more than 20% in five Member States. Natura 2000 sites also cover 12% of forestry area that also contributes to the biodiversity, particularly in mixed broadleaved-coniferous forest (around 15% of forest and other wooded land in EU-25). Taking into account other programmes to protect forestry, around 17% of EU-25 forestry area is covered by environment protection schemes. This share even reaches 63% in Germany. However, a decline in the population of farmland birds, largely attributed to intensive farming 10, is observed in most Member States even if it seems to have slowed down at EU level over the last years The concept of High Nature Value Farmland is still under development by the EEA and the JRC-Ispra. The current methodology is not fully satisfactory in some Member States (e.g. Finland) which therefore often prefer to use national definitions. Attention should be given to long-term trends as short-term variations are mainly influenced by weather conditions. 8
19 Defoliation of trees also reveals the strong environmental pressure on the forestry ecosystem (24% of sample trees at EU-25 level in 2004). The phenomenon is particularly important in the Czech Republic, Italy, Poland, France and Germany. However forestry area in EU-25 increased by around hectares per year between 2000 and 2005, the largest increases having taken place in Spain and Italy. Even if several human activities influence water quality, agriculture plays an important role for some of its features. Concentration of nitrates in surface water decreased over the last years in most Member States even if significant surpluses of nutrients (+89 kg/ha for Nitrogen and +13 kg/ha for Phosphorus at EU level and much more in some Member States) reveal that farming practices are still too intensive. The pressure from agriculture on water use is also critical in some regions of the European Union as, for instance, the share of irrigated area can be higher than a quarter of the agricultural area. Soil erosion persists in many areas as it is estimated that a soil loss by running water can amount to more than 2 tons/ha/year. However, an increasing part of agricultural area is devoted to organic production. For the whole EU-25, organic area was almost 5.9 mio ha in 2003, i.e. 3.8% of the agricultural area. This share was even higher than 10% in several regions of the Union. With 468 mio t of CO 2 equivalents, agriculture produced 9.5% of the EU emissions of greenhouse gases in However, with a production of renewable resources of 2 mio t of oil equivalent in 2004 (and an area of more than 1.3 mio ha), EU agriculture also contributes increasingly to the mitigation of climate change Diversification and quality of life in rural areas (tables & maps/graphs to ) The diversification of the economy of rural areas to other sectors than agriculture is progressing: 31% of European farmers have another gainful activity than agriculture, this percentage being even higher than 50% in many countries and regions (particularly in Slovenia, Sweden, Cyprus, Malta and Germany); 87% of employment and 95% of value added in predominantly rural areas of EU- 25 comes from the non-agricultural sectors. One of the key opportunities in terms of potential growth for rural areas comes from tourism. With three quarters of bed places in EU-25 in rural areas, this sector already plays a major role in most of them. Due to their rural amenities, rural areas are attractive as a place to live, even if remoteness and peripherality remain a major problem in some of them. However, some aspects of quality of life need to be improved in many rural areas. For instance, broadband internet infrastructure and take-up by population are significantly lower than in urban areas. The development of services is also lower in the rural areas of many Member States: at EU-25 level, services represent 63% of the economic activity in predominantly rural areas in comparison with 74% in predominantly urban areas. The net migration rate is a good indicator to measure the global attractiveness of an area. It is often lower in predominantly rural areas (+2.7 % for EU-25) than in predominantly urban areas (+4.8 % for EU-25). This information should obviously be analysed with care as other factors, such as more favourable climatic conditions, can play a major role in the decision of people to go and live in another place. 11 Even if this quantity may seem limited in comparison with the 54 mio t of oil equivalent produced by forestry in
20 Human potential is a key factor for the development of rural areas. In the EU-25, 70% of adults have reached a medium or high education level. There are however large variations among Member States (from 23% to 89%). In many countries the level of education is lower in rural areas than in urban areas, even if this pattern is not systematic. Life-long learning is a good instrument to improve the skills of workers and favour economic development, particularly in rural areas. It is already largely applied in Scandinavian countries and the United Kingdom where more than 20% of adults participated in life-long training in The dynamism of population and their willingness to be actors for their development is also essential. LEADER actions cover 14% of the EU-15 population and more than 20% in some Member States (such as Ireland, Portugal, Luxemburg, Austria, Greece and Finland) Implementation of Rural Development Policy Monitoring of measures financed by the Guarantee section of EAGGF for EU-15 (tables to ) Council regulation 1257/1999 proposes a menu of 22 measures that can be implemented by Member States in their Rural Development Programs. The only compulsory measure concerns the agri-environment. Some measures may be proposed by Member States but are not implemented or at least not from the beginning of the programming period. In 2003, the only measure proposed by all Member States (except the compulsory one concerning agri-environment) was the support in "Less-Favoured Areas". Other measures largely implemented were "Afforestation", "Other forestry measures", "Investments in agricultural holdings", "Training", "Renovation and development of villages" and "Diversification of agricultural activities". The less successful measures were "Financial engineering", "Restoring of agricultural potential" and "Areas with environmental restrictions". Whereas some Member States (Germany, Italy, Spain and France) propose more or less the full menu and some Member States only very few of them (Portugal, Greece and Ireland) 12, most of Member States have selected at least 2/3 of all the measures. Rural Development is a policy co-financed by EU and the Member States. In 2003, the share of national contributions to the total public expenditures reached 55%. National contribution varied from less than 25% in Portugal to more than 70% in Luxemburg and Greece. In 2003, more than contracts concerned measures for structural actions and improvement of the competitiveness of agricultural sector, mainly for investments in agricultural holdings and early retirement schemes. The average amounts of individual contracts varied largely between measures and between Member States. The highest amounts of total public expenditure (several hundreds of thousands of euros) were related to non individual infrastructures such as water management, restoring of agricultural potential and preventing for natural damages, financial engineering and transformation and marketing of agricultural products. For other measures like investment in agricultural holdings, training and early retirement schemes, individual amounts were generally no more than several thousands of euros. 12 Greece and Portugal may have implemented other measures in the Objective 1 program under EAGGF Guarantee. 10
21 The measures aiming to improve the environment through land management were implemented through more than 2.7 mio contracts in The most popular are "agrienvironment" (1.7 mio) and "less-favoured areas" (0.9 mio). The average amounts of total public expenditure are limited to a few hundreds or thousands euros. Around 31.2 mio ha are benefiting from LFA support. It may appear limited as compared to an estimate of 78.4 mio ha potentially eligible. The total arable crops area covered by agrienvironment schemes reached 35.5 mio ha in It is the "supported" area meaning that the same hectare is counted as many times as it benefits from different agrienvironment schemes. It reveals a high success as the total arable area was around 71.5 mio ha in the EU-15 during the same year. The measures specifically dedicated to improve the local rural economy and quality of life were implemented through around contracts. The average amount of total public expenditure is generally limited (a few thousands euros) for the diversification of agricultural activities as it concerns individual farm households ( in 2003). Average amounts are much higher for common actions such as village renovation and provision of basic services and also for the development of tourism and handicraft activities. It should be noticed that these actions seems more targeted and of higher amounts in The Netherlands Monitoring of measures financed by SAPARD (tables to ) SAPARD proposes 12 measures (plus a 13 th measure on water resources management introduced recently). Over the period , more than projects have been introduced. Out of the 12 measures available in , Czech Republic and Slovakia proposed 10 measures and other Member States around 6. Bulgaria and Romania selected 11 measures out of the 13 available. Four measures are implemented in all Member States: investment in agricultural holdings, processing and marketing of agricultural & fishery products, diversification of activities and rural infrastructure. The less successful measures, implemented in only 2 or 3 Member States are "structures for quality, veterinary controls etc" and "setting-up of producer groups". More than half of the projects concern the investment in agricultural holdings, the 2 other more successful measures being the diversification of activities and the support to rural infrastructure (around 17% each). The average amount of EU contribution 13 foreseen for a project is around euros, with much higher level for the rural infrastructure ( euros) and for the support for processing and marketing of agricultural & fishery products ( euros) Overview of Rural development Financial Implementation (tables & graphs to ) The total financial plan for all Rural Development financial instruments amounts to around 64.4 bio euros over the period The Guarantee section of the EAGGF provides for 60% of the budget: 51% directly to EU-15 and 9% through the 13 It should be noticed that, in tables to , the amount of EU contribution corresponds to the EU part in the commitments made by the benefiting countries. This amount is in some cases higher than the amount in EU Financial plan (allocation). It happens when Member States committed more than the allocation as they estimate that the real take-off will be lower and because the transitional rules adopted by the Commission allowed the eight benefiting countries that become Member States in 2004 to use the TRDI funds to pay for commitments made under SAPARD when the relevant funds are exhausted. At the end of the period, EU will not contribute more than the amount allocated under the different rural development instruments in the community budget for the entire period
22 Rural Development Instrument (TRDI) aiming to support the New Member States during the period The Guidance section share represents 35% and SAPARD reaches around 5% of the total. The expenditures for the period represented 67% of the budget foreseen for the whole period for EU-27. The rate of execution is the highest for the Guarantee section (83%). It is lower for the Guidance section (52%) due to the multi-annual rule allowing the payment even after the end of the period and for the TRDI (35%) as this instrument was only implemented recently. The rate of execution of SAPARD is 62%, mainly due to the ongoing programs in Bulgaria and Romania since for the New Member States, the actions initiated before accession are realised at 94%. Global rates of execution higher than 80% are observed in Ireland, Luxemburg, The Netherlands, Finland and Sweden whereas Greece reached only around 50%. The rate of execution at this time is of course lower in the New Member States (41%). Germany, Spain, Italy and France shared more or less equally 50% of the total budget of the period. Several Member States had a share of less than 1%. For the large majority of the Member States of EU-15, most of the expenditure are covered by the Guarantee section. The contribution of the Guidance section is important only in Member States where a large part of the agricultural territory is designated as objective 1, such as Greece, Portugal, Spain and Germany. For EU-15, the budget available under the Guidance section for the programming period is established at 20.5 bio euros 14. Around 90% of this budget (18.4 bio euros) is dedicated to Rural Development programs in Objective 1 regions. The rest (around 2.1 bio euros) is allocated to Leader+. If it represents around 10% of the Guidance section for EU-15, this share is considerably higher in some Member States: 100% in Denmark and Luxemburg, 89% in The Netherlands and 64% in Austria. Up to 2005, the total rate of execution of the Leader+ programme is globally 39%, ranging from 27% to 54%. Since the enlargement of the Union, a budget of 2.1 bio euros has also been available under the Guidance section for the New Member States for the period Up to 2005, the rate of execution has of course been rather low (24% for the New Member States but up to 47% in some Member States) as the programs are still being implemented. Since the accession and up to 2006, the New Member States have also benefited from 5.8 bio euros within the Guarantee section for the new Temporary Rural Development Instrument (TRDI). The financial management of the Guarantee section for the EU-15 provide detailed information concerning the use of the different instruments by the different Member States based on the expenditure in The structure of the expenditures of EU-15 is the following: Agri-environment measures cover 45% of the expenditure, followed by LFA support (21%), encouragement of adaptation of rural areas (10%), forestry measures (9%), To which one should add an amount of 43.8 mio euros for Peace II program implemented in UK and Ireland. It should be kept in mind that this does not reflect perfectly the total use of the measures in some Member States where objective 1 regions are important, such as Greece, Portugal, Spain and Germany. In these cases, some of the measures are financed by important amounts funds from the Guidance section. 12
23 investment in agricultural holding -including setting-up of young farmers and training- (6%), early retirement scheme (5%), processing and marketing of agricultural products (3%) and the others (2%). Compared to this average structure of expenditures, the main features of the structure in the different Member States are: Belgium: investments in agriculture are higher but LFA and agri-environment are lower, Denmark: LFA support is lower, Germany: encouragement of adaptation of rural areas is higher, Greece: early retirement is higher but agri-environment is lower, Spain: forestry measures are higher but agri-environment is lower, France: LFA support is higher but agri-environment is lower, Ireland: LFA support and early retirement scheme are higher, Italy: agri-environment is higher but LFA support is lower, Luxemburg: investments in agriculture are higher but forestry measures and encouragement of adaptation of rural areas are lower, The Netherlands: encouragement of adaptation of rural areas is higher but LFA and agri-environment are lower, Austria: agri-environment is higher but forestry measures are lower, Portugal: forestry measures and LFA support is higher, Finland: LFA support is higher but forestry measures and encouragement of adaptation of rural areas are lower, Sweden: agri-environment is higher but LFA support, forestry measures and encouragement of adaptation of rural areas are lower, United-Kingdom: LFA support is higher The same type of analysis can be made using the EU contribution reported in the monitoring tables of SAPARD, covering the period The reference is the aggregate of the 8 new Member States having benefited from SAPARD before accession. The structure of the commitments in Bulgaria and Romania over the period is compared to this aggregate. The main features of the structure of the commitments in SAPARD from the different countries are: For the aggregate of 8 New Member States, the support for processing & marketing of agricultural products cover 33% of the commitments, followed by rural infrastructure (29%), investments in agriculture (23%) and diversification of agriculture (9%). The implementation of the other measures is more limited, Czech Republic: land improvement / reparcelling and renovation of villages are higher but rural infrastructures and processing & marketing of agricultural products are lower, Estonia and Latvia: investments in agriculture and diversification of activities are higher but rural infrastructures is lower, 13
24 Lithuania, Slovenia and Bulgaria: investments in agriculture is higher but rural infrastructures is lower, Hungary: investments in agriculture is higher but diversification of activities and rural infrastructures are lower, Poland: rural infrastructures is higher but investments in agriculture is lower, Slovakia: investments in agriculture and land improvement / reparcelling are higher but rural infrastructures is lower, Romania: rural infrastructures is higher but investments in agriculture and processing & marketing of agricultural products are lower, Finally, it is also interesting to analyse, for each measure, how the expenditure is distributed among which Member States. This has been done for the EU-15 for the period : investments in agriculture-setting-up-training: 60% of expenditures in Italy and France, early retirement: 75% in Greece, Ireland and Spain, less-favoured areas: is better distributed among Member States: 72% in France, Finland, Germany Ireland and Austria. There is a higher use in France and Finland and a lower use in Italy; agri-environment: is also well distributed: 51% in Germany, Italy, Austria and France, but there is actually a relative lower use in France, processing and marketing of agricultural products: 74% in Spain, Italy and France, forestry measures: 58% in Spain, Italy and Ireland increasing to 78% when adding France and Germany, adaptation-development of rural areas: 82% in Germany, France, Spain and The Netherlands. 14
25 CHAPTER 3 STATISTICAL DESCRIPTION 15
26 Chapter 3 - CONTENTS Foreword List of indicators Correspondence table between CMEF order & RD report numbering Correspondence table between the NUTS levels and national administrative units Correspondence table between the country codes and th country names Section 3.1 Section 3.2 Section 3.3 Section 3.4 Section 3.5 Importance of Rural Areas Socio-Economic Situation in Rural Areas Sectoral Economic Indicators Environment Diversification & Quality of Life in Rural Areas Annex 3.A Glossary of Terms & Definitions Annex 3.B Main sources Annex 3.C Technical annex Annex 3.D Objective-related baseline indicators data at regional level 16
27 Foreword 1. The following chapter - statistical description - provides tables, maps and graphs organised by sections: 3.1 Importance of rural areas 3.2 Socio-economic situation in rural areas 3.3 Sectoral economic indicators 3.4 Environment 3.5 Diversification and quality of life in rural areas 3.6 Leader 2. It is based on the lists of objective- & context-related baseline indicators defined for the Common Monitoring and Evaluation Framework (CMEF) put in place for the rural development policy over the period. Initially organised by type (objective-related versus context-related) and after the four axes defined in EC regulation n 1698/2005, the indicators have been reallocated by section. A correspondence table between the new order and the CMEF order is provided p23. Yet the original names have been kept, leading to the following nomenclature: - objective xx / Oxx: baseline indicator objective-related n xx in the CMEF - context xx / Cxx: baseline indicator context-related n xx in the CMEF The original measurement has been kept as well. Nevertheless, for analysis needs, it may have been slightly changed for some indicators (mainly relative value versus absolute number). In such a case, the reference of the indicator appears into brackets, e.g. (Objective xx) name of the indicator. Relevant information on measurement, definition and sources used for each indicator are to be found in the "Technical Annex" (Annex 3.C), a detailed presentation of the sources being available in Annex 3.B. 3. For some of the indicators, data are available at regional level, whereas for some other, only data at national level are available. In the case of data at national level, "summary thematic tables" are being provided, so as to allow an easy comparison between indicators referring to the same topic (e.g. Food industry indicators). The table is then followed by the relevant illustrations - graphs in most cases. For the same indicator, graph and table have the same number. In the case of data at regional level, a description by rural character is provided for the indicators relating to sections: 3.1 Importance of rural areas 3.2 Socio-economic situation in rural areas 3.3 Sectoral economic indicators 3.5 Diversification and quality of life in rural areas 17
28 This means that for each indicator, the following items are presented: - A map showing the indicator value at the most detailed geographical level (NUTS 2 or 3 1 or FSS Region or District 2 ); - A "summary table", providing the results according to the rural character: Predominantly Rural (PR) / Intermediate Regions (IR) / Predominantly Urban (PU) according to the OECD definition; as well as the national value. This "summary table" is elaborated as follows: for each country, all the NUTS 2 (respectively NUTS 3) regions are being "flagged" according to the OECD methodology (see Box 1 in Chapter 1, p3). For a given indicator, each of these regions has a given value. To get the national value for Predominantly Rural respectively Intermediate Regions, and Predominantly Urban we just have to sum the indicator value for all the regions bearing the flag "PR" respectively "IR" or "PU". For example: at NUTS 2 level, Hungary counts 7 regions, each of which being either Predominantly Rural (PR) / Intermediate Regions (IR) / Predominantly Urban (PU). If we consider the population within those regions, we have: NUTS2 region OECD Flag Population (1000 inhab. 2003) HU10 PU HU21 IR HU22 IR HU23 PR HU31 IR HU32 PR HU33 PR Total = Hungary If we now sum for each "category" the population in the NUTS regions flagged with the relevant flag, and divide it by the country total to get the importance of population in each type of area we have: 1000 inhab. % of total PU % IR % PR % These values do correspond to the values given in table b for the indicator "Share of Population in rural areas". Tables providing results according to the rural character are based on the lowest geographical breakdown available (NUTS 3 if possible). For some indicators, information is only available at NUTS 2. To allow the reader to compare results according to the rural character of the areas for all indicators, tables are also provided at NUTS 2 level even if the information is available at NUTS 3 level (respectively FSS Region and District). This presentation also highlights the importance of the geographical precision. Namely, as shown on maps 3.1.1a & b for indicator Context 1-"Designation of rural areas", the picture changes a lot whether the OECD definition is applied at NUTS 2 or 1 NUTS: Nomenclature of territorial units for statistics See Glossary of Terms & Definitions (Annex 3.A) for more explanations 2 FSS: Farm Structure Survey See Annex 3.B: Main Sources, for more explanations has a geographical breakdown based on NUTS, but not homogeneous in terms of NUTS level. FSS Region level is a mix of NUTS 1 & NUTS 2 regions, while FSS District level is a mix of NUTS 2 & NUTS 3 regions, some predominantly urban regions being too aggregated. 18
29 NUTS 3 level. This means that for the same indicator and same year, the value for rural or the other OECD types of areas may significantly change between NUTS 2 and NUTS 3 level. Both values are true, but the value at NUTS 3 - respectively FSS district - level should be considered as the less distorting. For example, the percentage of territory (indicator Context 2) in rural areas for EU25 is 56.2% at NUTS 3 level, but only 39.9% at NUTS 2 level for For the same reason, the percentage of farmers with basic or full agricultural training in rural areas for EU15 is 14.8% at FSS District level, whereas it is 8.6% at FSS Region level for For consistency of the analysis, the indicators should be compared at the same level. - Tables providing the data for every particular NUTS2 and NUTS3 region respectively FSS Region and FSS District for data coming from Farm Structure Surveys are to be found on the CD-ROM, for all the indicators, and in Annex 3.D for the objective related baseline indicators. Indicators are then organised after the CMEF order. 4. Additional warnings concerning the presentation of the data In this report, the choice has been made to provide as much information as possible to give a broad overview of the agri-food sector and of the situation of the environment and of rural areas. Some "difficult" choices have been made in this context that the reader should be aware of: The tables provide information for a "central year" at EU-25 level, i.e. the most recent year for which data were available for most of the Member States. In some cases, data are provided for a different year for some Member States or regions. For some indicators, information is available from different sources at national and at regional level. Very often the updates or revisions/corrections of the data are not made at the same time in the national and in the regional series. This may explain that in some cases the sum of the regions cannot correspond to the national figure. Indeed, when different sources are used, the national results provided in the tables are based on the series at national level (rather than on the sum of the regional data from regional statistics). In some cases, data are not available for some regions of a Member State. In spite of that, it has been decided, when the effect was considered as limited, to provide tables according to the rural character of regions based on the data available. In some cases (other years available at national and regional level, large discrepancies reflecting differences in updates, difference in coverage at national and regional level, etc) the national summary based on the regional results is also provided to allow evaluating the difference with national figure. 5. The following documents are also available - Correspondence table between the NUTS level and the local administrative units: p25 - Correspondence table between country codes and country names p26 - Localisation maps of the NUTS codes by country, at NUTS 2 & NUTS 3 level (CD ROM) - Glossary of terms: Annex 3.A 19
30 20
31 Indicators for Rural Development report Section CMEF Indicator N Measurement 3.1 Importance of rural areas C1 Designation of rural areas Designation of rural areas with OECD methodology C2 Importance of rural areas % territory in rural areas % population in rural areas % GVA in rural areas % employment in rural areas 3.2 Socio-economic situation in rural areas C17 Population density Population density C18 Age structure % people aged (0-14) y.o. / (15-64) y.o. / >= 65 y.o. in total population O1 Economic development GDP/capita (EU-25 = 100) C19 Structure of the Economy % GVA by branch (Primary / Secondary / Tertiary sector) C20 Structure of Employment % employment by branch (Primary / Secondary / Tertiary sector) O2 Employment rate Employed persons as a share of total population of the same age class O3 Unemployment Rate of unemployment (% active population) C21 Long-term unemployment % Long-term unemployment (as a share of active population) 3.3 Sectoral economic indicators O8 Employment development of primary sector Employment in primary sector O9 Economic development of primary sector GVA in primary sector C3 Agricultural land use % arable area / permanent grass / permanent crops C4 Farm structure Number of farms Utilized agricultural area Average area farm size and distribution Average economic farm size and distribution Labour Force O16 Importance of semi-subsistence farming in NMS Number of farms < 1 ESU O4 Training and education in agriculture % farmers with basic and full education attained O5 Age structure in agriculture Ratio : % farmers < 35 / >= 55 years old O6 Labour productivity in agriculture GVA / AWU - total and by sector. O7 Gross fixed capital formation in agriculture GFCF in agriculture O10 Labour productivity in food industry GVA /person employed in food industry O11 Gross fixed capital formation in food industry GFCF in food industry O12 Employment development in food industry Employment in food industry O13 Economic development of food industry GVA in food industry C5 Forestry structure Area of forest available for wood supply (FAWS) Ownership (% area of FAWS under "eligible" ownership) Average size of private holding (FOWL) C6 Forest productivity Average net annual volume increment (FAWS) O14 Labour productivity in forestry GVA /person employed in forestry O15 Gross fixed capital formation in forestry GFCF in forestry 3.4 Environment C7 Land cover % area in agricultural / forest / natural / artificial C8 LFA % UAA in non LFA / LFA mountain / other LFA / LFA with specific handicaps C9 Areas of extensive agriculture % UAA for extensive arable crops % UAA for extensive grazing C10 Natura 2000 area % territory under Natura % UAA under Natura % forest area under Natura 2000 O17 Biodiversity: Population of farmland birds Trends of index of population of farmland birds O18 Biodiversity: High Nature Value farmland areas UAA of High Nature Value Farmland areas O19 Biodiversity: Tree species composition Distribution of species group by area of FOWL (% coniferous/% broadleaved/%mixed) C11 Biodiversity: Protected forest % FOWL protected to conserve biodiversity, landscapes and specific natural elements (MCPFE 4.9, classes 1.1, 1.2, 1.3 & 2) C12 Development of forest area Average annual increase of forest and other wooded land areas C13 Forest ecosystem health % trees / conifers / broadleaved in defoliation classes 2-4 C14 Water quality % territory designated as Nitrate Vulnerable Zone O20 Water quality: Gross Nutrient Balances Surplus of nitrogen in kg/ha Surplus of phosphorus in kg/ha O21 Water quality: Pollution by nitrates and pesticides Annual trends in the concentrations of nitrate in ground and surface waters Annual trends in the concentrations of pesticides in ground and surface waters C15 Water use % irrigated UAA C16 Protective forests concerning primarily soil and water FOWL area managed primarily for soil & water protection (MCPFE 5.1 class 3.1) O22 Soil: Areas at risk of soil erosion Areas at risk of soil erosion (classes of T/ha/year) O23 Soil: Organic farming UAA under organic farming O24 Climate change: Production of renewable energy from agriculture and Production of renewable energy from agriculture (ktoe) forestry Production of renewable energy from forestry (ktoe) O25 Climate change: UAA devoted to renewable energy UAA devoted to energy and biomass crops O26 Climate change: GHG emissions from agriculture Agricultural emissions of GHG (ktoe) 3.5 Diversification and quality of life in the different categories of areas (OECD) O27 Farmers with other gainful activity % holders with other gainful activity O28 Employment development of non-agricultural sector Employment in secondary and tertiary sectors O29 Economic development of non-agricultural sector GVA in secondary and tertiary sectors O30 Self-employment development Self-employed persons O31 Tourism infrastructure in rural area Number of bedplaces (in hotels, campings, holiday dwellings, etc) C23 Internet infrastructure DSL coverage O32 Internet take-up in rural areas % population having subscribed to DSL internet O33 Development of services sector % GVA in services O34 Net migration Net migration rate C22 Educational attainment % adults (25_64) with Medium & High educational attainment O35 Life-long learning in rural areas % of population of adults participating in education and training AXIS 4, LEADER O36 Development of Local Action Groups Share of population covered by Local Action Groups 21
32 OBJECTIVE RELATED BASELINE INDICATORS AXIS Indicator Measurement RD report * 1 Economic development GDP/capita (EU-25 = 100) Horizontal * 2 Employment rate Employed persons as a share of total population of the same age class * 3 Unemployment Rate of unemployment (% active population) AXIS 1, Improving the competitiveness of the agricultural and forestry sector AXIS 2, Improving the environment and the countryside through land management * 4 Training and education in agriculture % farmers with basic and full education attained Age structure in agriculture Ratio : % farmers < 35 / >= 55 years old * 6 Labour productivity in agriculture GVA / AWU - total and by sector Gross fixed capital formation in agriculture GFCF in agriculture Employment development of primary sector Employment in primary sector Economic development of primary sector GVA in primary sector * 10 Labour productivity in food industry GVA / people employed in food industry Gross fixed capital formation in food industry GFCF in food industry Employment development in food industry Employment in food industry Economic development of food industry GVA in food industry * 14 Labour productivity in forestry GVA /people employed in forestry Gross fixed capital formation in forestry GFCF in forestry Importance of semi-subsistence farming in NMS Number of farms < 1 ESU * 17 Biodiversity: Population of farmland birds Trends of index of population of farmland birds * 18 Biodiversity: High Nature Value farmland areas UAA of High Nature Value Farmland areas Biodiversity: Tree species composition Distribution of species group by area of FOWL (% coniferous/% broadleaved/%mixed) * 20 Water quality: Gross Nutrient Balances Surplus of nitrogen in kg/ha Surplus of phosphorus in kg/ha 21 Water quality: Pollution by nitrates and pesticides Annual trends in the concentrations of nitrate in ground and surface waters Annual trends in the concentrations of pesticides in ground and surface waters 22 Soil: Areas at risk of soil erosion Areas at risk of soil erosion (classes of T/ha/year) Soil: Organic farming UAA under organic farming * 24 Climate change: Production of renewable energy from agriculture Production of renewable energy from agriculture (ktoe) and forestry Production of renewable energy from forestry (ktoe) 25 Climate change: UAA devoted to renewable energy UAA devoted to energy and biomass crops Climate change: GHG emissions from agriculture Agricultural emissions of GHG (ktoe) * 27 Farmers with other gainful activity % holders with other gainful activity * 28 Employment development of non-agricultural sector Employment in secondary and tertiary sectors AXIS 3, Improving the * 29 Economic development of non-agricultural sector GVA in secondary and tertiary sectors quality of life in rural * 30 Self-employment development Self-employed persons areas and encouraging 31 Tourism infrastructure in rural area Number of bedplaces (in hotels, campings, holiday dwellings, etc) the diversification of * 32 Internet take-up in rural areas % population having subscribed to DSL internet economic activity * 33 Development of services sector % GVA in services Net migration Net migration rate * 35 Life-long learning in rural areas % of population of adults participating in education and training AXIS 4, LEADER * 36 Development of Local Action Groups Share of population covered by Local Action Groups * refers to LEAD indicators
33 23 AXIS Indicator Measurement RD report 1 Designation of rural areas Designation of rural areas with OECD methodology Importance of rural areas % territory in rural areas Horizontal % population in rural areas % GVA in rural areas % employment in rural areas 3 Agricultural land use % arable area / permanent grass / permanent crops Farm structure Number of farms Utilized agricultural area AXIS 1, Improving the competitiveness of the agricultural and forestry sector AXIS 2, Improving the environment and the countryside through land management AXIS 3, Improving the quality of life in rural areas and encouraging the diversification of economic activity CONTEXT RELATED BASELINE INDICATORS Average area farm size and distribution Average economic farm size and distribution Labour Force 5 Forestry structure Area of forest available for wood supply (FAWS) Ownership (% area of FAWS under "eligible" ownership) Average size of private holding (FOWL) 6 Forest productivity Average net annual volume increment (FAWS) Land cover % area in agricultural / forest / natural / artificial LFA % UAA in non LFA / LFA mountain / other LFA / LFA with specific handicaps Areas of extensive agriculture % UAA for extensive arable crops % UAA for extensive grazing 10 Natura 2000 area % territory under Natura % UAA under Natura 2000 % forest area under Natura Biodiversity: Protected forest % FOWL protected to conserve biodiversity, landscapes and specific natural elements (MCPFE 4.9, classes 1.1, 1.2, 1.3 & 2) Development of forest area Average annual increase of forest and other wooded land areas Forest ecosystem health % trees / conifers / broadleaved in defoliation classes Water quality % territory designated as Nitrate Vulnerable Zone Water use % irrigated UAA Protective forests concerning primarily soil and water FOWL area managed primarily for soil & water protection (MCPFE 5.1 class 3.1) Population density Population density Age structure % people aged (0-14) y.o. / (15-64) y.o. / >=65 y.o. in total population Structure of the Economy % GVA by branch (Primary / Secondary / Tertiary sector) Structure of Employment % employment by branch (Primary / Secondary / Tertiary sector) Long-term unemployment % Long-term unemployment (as a share of active population) Educational attainment % adults (25_64) with Medium & High educational attainment Internet infrastructure DSL coverage 3.5.6
34 Correspondence table between the NUTS levels and the national administrative units NUTS 1 NUTS 2 NUTS 3 BE Régions 3 Provinces 11 Arrondissements 43 CZ Území 1 Oblasti 8 Kraje 14 DK Amter 15 DE Länder 16 Regierungsbezirke (in most cases) 41 Kreise 439 EE Groups of Maakond 5 GR Groups of development regions 4 Development regions 13 Nomoi 51 ES Agrupación de comunidades autónomas 7 Comunidades y ciudades autónomas 19 Provincias + Ceuta y Melilla 52 FR Z.E.A.T + DOM 9 Régions + DOM 26 Départements 100 IE - 1 Regions 2 Regional Authority Regions 8 IT Gruppi di regioni 5 Regioni 21 Provincie 103 CY LV Reģioni 6 LT Apskritys 10 LU HU Statisztikai nagyrégiók 3 Tervezési-statisztikai régiók 7 Megyék + Budapest 20 MT Gzejjer 2 NL Landsdelen 4 Provincies 12 COROP regio's 40 AT Gruppen von Bundesländern 3 Bundesländer 9 Gruppen von Politischen Bezirken 35 PL Regiony 6 Województwa 16 Podregiony 45 PT Continente + Regiões autónomas 3 Comissões de coordenação regional + Regiões autónomas 7 Grupos de Concelhos 30 SI Statistične regije 12 SK - 1 Oblasti 4 Kraje 8 FI Manner-Suomi, Ahvenananmaa / Fasta 2 Suuralueet / Storområden 5 Maakunnat / Landskap 20 Finland, Åland SE - 1 Riksområden 8 Län 21 UK: England Government Regions Office 9 Counties (some grouped); Inner and Outer London 30 Upper tier authorities or groups of lower tier authorities (unitary authorities or districts) Wales Country 1 Groups of unitary authorities 2 Groups of unitary authorities 12 Scotland Country 1 Groups of unitary authorities or LECs 4 Groups of unitary authorities or LECs (or parts thereof) N.Ireland Country 1 Country 1 Groups of districts 5 EU EU BG Rajon 2 Rajon na Planirane / Planning Regions 6 Oblasti 28 RO n.a. Regions 8 Judet + Bucuresti 42 EU Source: Eurostat Regions Nomenclature of territorial units for statistics August
35 Correspondence table between the country codes and the country names COUNTRY CODE COUNTRY NAME COUNTRY ENGLISH NAME BE Belgique/België Belgium CZ Česká Republika Czech Republic DK Danmark Denmark DE Deutschland Germany EE Eesti Estonia GR Elláda Greece ES España Spain FR France France IE Ireland Ireland IT Italia Italy CY Kypros Cyprus LV Latvija Latvia LT Lietuva Lithuania LU Luxembourg Luxembourg HU Magyarország Hungary MT Malta Malta NL Nederland Netherlands AT Österreich Austria PL Polska Poland PT Portugal Portugal SI Slovenija Slovenia SK Slovenská Republika Slovakia FI Suomi/Finland Finland SE Sverige Sweden UK United Kingdom United Kingdom BG Bălgarija Bulgaria RO România Romania EU-25 EU-15 NMS-10 European Union (25 countries) European Union (15 countries) New Member States (CZ, EE, CY, LV, LT, HU, MT, PL, SI, SK) EU-27 European Union (25 countries) + 2 Accession Countries (BG-RO) 25
36 26
37 SECTION 3.1 IMPORTANCE OF RURAL AREAS 27
38 Map a 28

39 Map b 29
40 Table a Table a Table a Table a Context 2 - Importance of Rural Areas - NUTS 3 % Territory in rural areas % Population in rural areas % GVA in rural areas % Employment in rural areas Country % PR % IR % PU % PR % IR % PU % PR % IR % PU % PR % IR % PU Belgium Czech Republic Denmark Germany Estonia Greece Spain France Ireland Italy Cyprus Latvia Lithuania Luxembourg Hungary Malta Netherlands n.a. n.a. n.a. Austria Poland Portugal Slovenia Slovakia Finland Sweden United Kingdom Bulgaria Romania n.a. n.a. n.a. EU incl. NL NUTS2 data EU incl. NL NUTS2 data NMS EU Note: The total for France and therefore the European aggregates include the overseas departments. incl. NL & RO NUTS2 data Table b Table b Table b Table b Context 2 - Importance of Rural Areas - NUTS 2 % Territory in rural areas % Population in rural areas % GVA in rural areas % Employment in rural areas Country % PR % IR % PU % PR % IR % PU % PR % IR % PU % PR % IR % PU Belgium Czech Republic Denmark Germany Estonia Greece Spain France Ireland Italy Cyprus Latvia Lithuania Luxembourg Hungary Malta Netherlands LFS Austria Poland Portugal Slovenia Slovakia Finland Sweden United Kingdom Bulgaria Romania LFS EU EU NMS EU Note: The total for France and therefore the European aggregates include the overseas departments. 30
41 Graph Context 2 - Importance of Rural Areas - Share of Territory in the different types of areas (NUTS3-2003) 100% 80% 60% 40% 20% 0% BE CZ DK DE EE EL ES FR IE IT CY LV LT LU HU MT NL AT PL PT SI SK FI SE UK BG RO EU25 EU15 NMS10 EU27 % PR % IR % PU Graph Context 2 - Importance of Rural Areas - Share of Population in the different types of areas (NUTS3-2003) 100% 80% 60% 40% 20% 0% BE CZ DK DE EE EL ES FR IE IT CY LV LT LU HU MT NL AT PL PT SI SK FI SE UK BG RO EU25 EU15 NMS10 EU27 % PR % IR % PU 31
42 Graph Context 2 - Importance of Rural Areas - Share of GVA in the different types of areas (NUTS3-2002) 100% 80% 60% 40% 20% 0% BE CZ DK DE EE EL ES FR IE IT CY LV LT LU HU MT NL AT PL PT SI SK FI SE UK BG RO EU25 EU15 NMS10 EU27 % PR % IR % PU Graph Context 2 - Importance of Rural Areas - Share of Employment in the different types of areas (NUTS3-2002) 100% 80% 60% 40% 20% 0% BE CZ DK DE EE EL ES FR IE IT CY LV LT LU HU MT NL AT PL PT SI SK FI SE UK BG RO EU25 EU15 NMS10 EU27 % PR % IR % PU 32
43 SECTION 3.2 SOCIO-ECONOMIC SITUATION IN RURAL AREAS 33
44 Table a Country (1) PR (2) IR (3) PU MS value Belgium Czech Republic Denmark Germany Estonia Greece Spain France Ireland Italy Cyprus Latvia Lithuania Luxembourg Hungary Malta Netherlands Austria Poland Portugal Slovenia Slovakia Finland Sweden United Kingdom Bulgaria Romania EU EU NMS EU Table b Context 17 - Population Density inhab/km NUTS 3 Note : for FR and, consequently, for the European aggregates, the overseas departments are covered for the summary by rural character, whereas they are excluded from the MS value (leading to a population density of 110 hab/km2 against 98hab./km2 for FR, and 117 hab./km2 againt 115 for EU-25). Context 17 - Population Density inhab/km NUTS 2 Country (1) PR (2) IR (3) PU MS value Belgium Czech Republic Denmark Germany Estonia Greece Spain France Ireland Italy Cyprus Latvia Lithuania Luxembourg Hungary Malta Netherlands Austria Poland Portugal Slovenia Slovakia Finland Sweden United Kingdom Bulgaria Romania EU EU NMS EU Note : for FR and, consequently, for the European aggregates, the overseas departments are covered for the summary by rural character, whereas they are excluded from the MS value (leading to a population density of 110 hab/km2 against 98hab./km2 for FR, and 117 hab./km2 againt 115 for EU-25). 34
45 Map
46 Table a Context 18 - Age Structure NUTS 3 (1) PR (2) IR (3) PU MS value Country % 0-14 y.o.% y.o % 65+ y.o. % 0-14 y.o.% y.o % 65+ y.o. % 0-14 y.o.% y.o % 65+ y.o. % 0-14 y.o.% y.o % 65+ y.o. Belgium n.a. n.a. n.a. n.a. n.a. n.a. n.a. n.a. n.a Czech Republic Denmark n.a. n.a. n.a. n.a. n.a. n.a. n.a. n.a. n.a Germany excl. DE21i Estonia Greece Spain France Ireland Italy Cyprus Latvia n.a. n.a. n.a. n.a. n.a. n.a. n.a. n.a. n.a Lithuania Luxembourg Hungary Malta n.a. n.a. n.a. n.a. n.a. n.a. n.a. n.a. n.a stat data Netherlands Austria Poland excl. PL111,112, Portugal Slovenia n.a. n.a. n.a. n.a. n.a. n.a. n.a. n.a. n.a Slovakia Finland Sweden United Kingdom Bulgaria stat data Romania EU excl. BE, DK, LV, MT, SI G2 EU excl. BE, DK G2 NMS excl. LV, MT, SI G2 excl. BE, DK, LV, EU MT, SI G2 Note : for FR and, consequently, for the European aggregates, the overseas departments are covered for the summary by rural character, whereas they are excluded from the MS value Table b Context 18 - Age Structure NUTS 2 (1) PR (2) IR (3) PU MS value Country % 0-14 y.o.% y.o % 65+ y.o. % 0-14 y.o.% y.o % 65+ y.o. % 0-14 y.o.% y.o % 65+ y.o. % 0-14 y.o.% y.o % 65+ y.o. Belgium Czech Republic Denmark Germany Estonia Greece Spain France Ireland Italy Cyprus Latvia Lithuania Luxembourg Hungary Malta stat data Netherlands Austria Poland Portugal Slovenia Slovakia Finland Sweden United Kingdom Bulgaria stat data Romania EU G2 EU G2 NMS G2 EU G2 Note : for FR and, consequently, for the European aggregates, the overseas departments are covered for the summary by rural character, whereas they are excluded from the MS value 36

47 Map
48 Table a Objective 1 - Economic Development GDP(pps) / capita (EU25=100) - "2001" - NUTS 3 Country (1) PR (2) IR (3) PU MS value Belgium Czech Republic Denmark Germany Estonia Greece Spain France Ireland Italy Cyprus Latvia Lithuania Luxembourg Hungary Malta Netherlands Austria Poland Portugal Slovenia Slovakia Finland Sweden United Kingdom Bulgaria Romania EU pps EU NMS EU Note : the total for France and therefore the European aggregates include the overseas departments Table b Objective 1 - Economic Development GDP(pps) / capita (EU25=100) - "2001" - NUTS 2 Country (1) PR (2) IR (3) PU MS value Belgium Czech Republic Denmark Germany Estonia Greece Spain France Ireland Italy Cyprus Latvia Lithuania Luxembourg Hungary Malta Netherlands Austria Poland Portugal Slovenia Slovakia Finland Sweden United Kingdom Bulgaria Romania EU pps EU NMS EU Note : the total for France and therefore the European aggregates include the overseas departments 38
49 Map
50 Table a Country % primary sector Context 19 - Structure of the Economy (% GVA by branch) NUTS 3 (1) PR (2) IR (3) PU MS value (National Accounts) % secondary sector % tertiary sector % primary sector % secondary sector % tertiary sector % primary sector % secondary sector % tertiary sector % GVA in primary sector % GVA in secondary sector % GVA in tertiary sector Belgium Czech Republic Denmark Germany Estonia Greece Spain France Ireland Italy Cyprus Latvia Lithuania Luxembourg Hungary Malta Netherlands Austria Poland Portugal Slovenia Slovakia Finland Sweden United Kingdom Bulgaria Romania EU EU NMS EU Notes: - The total for France and therefore the European aggregates include the overseas departments - Data sources differ at regional (Economic Accounts) and national (National Accounts) levels. Table b Country % primary sector Context 19 - Structure of the Economy (% GVA by branch) NUTS 2 (1) PR (2) IR (3) PU MS value (National Accounts) % secondary sector % tertiary sector % primary sector % secondary sector % tertiary sector % primary sector % secondary sector % tertiary sector % GVA in primary sector % GVA in secondary sector % GVA in tertiary sector Belgium Czech Republic Denmark Germany Estonia Greece Spain France Ireland Italy Cyprus Latvia Lithuania Luxembourg Hungary Malta Netherlands Austria Poland Portugal Slovenia Slovakia Finland Sweden United Kingdom Bulgaria Romania EU EU NMS EU Notes: - The total for France and therefore the European aggregates include the overseas departments - Data sources differ at regional (Economic Accounts) and national (National Accounts) levels. 40
51 Country % primary sector (1) PR (2) IR (3) PU MS value (as of national totals in regional series) % tertiary % primary % secondary % tertiary % primary % secondary % tertiary % employment in % employment in % employment in sector sector sector sector sector sector sector primary sector secondary sector tertiary sector % secondary sector Context 20 - Structure of Employment (% employment by branch) NUTS 3 Belgium i Czech Republic Denmark Germany Estonia Greece p 23.8 p 60.1 p Spain France Ireland Italy Cyprus Latvia Lithuania Luxembourg Hungary Malta Netherlands n.a. n.a. n.a. n.a. n.a. n.a. n.a. n.a. n.a. 3.0 LFS 20.8 LFS 76.2 LFS - g_to_q Austria Poland Portugal Slovenia Slovakia Finland Sweden United Kingdom Bulgaria Romania n.a. n.a. n.a. n.a. n.a. n.a. n.a. n.a. n.a LFS 29.7 LFS 33.5 LFS - g_to_q EU excl. NL 5.0 G G G2 EU excl. NL 3.9 G G G2 NMS G G G2 EU excl. NL, RO 6.8 G G G2 Note : the total for France and therefore the European aggregates include the overseas departments Table b Country % primary sector (1) PR % secondary sector % tertiary sector Context 20 - Structure of Employment (% employment by branch) NUTS 2 % primary sector (2) IR (3) PU MS value (as of national totals in regional series) % tertiary sector % primary sector % secondary sector % tertiary sector % employment in primary sector % employment in secondary sector % employment in tertiary sector % secondary sector Belgium i Czech Republic Denmark Germany Estonia Greece p 23.8 p 60.1 p Spain France Ireland Italy Cyprus Latvia Lithuania Luxembourg Hungary Malta Netherlands n.a. n.a. n.a. n.a. n.a. n.a. n.a. n.a. n.a. 3.0 LFS 20.8 LFS 76.2 LFS - g_to_q Austria Poland Portugal Slovenia Slovakia Finland Sweden United Kingdom Bulgaria Romania n.a. n.a. n.a. n.a. n.a. n.a. n.a. n.a. n.a LFS 29.7 LFS 33.5 LFS - g_to_q EU excl. NL 5.0 G G G2 EU excl. NL 3.9 G G G2 NMS G G G2 EU excl. NL, RO 6.8 G G G2 Note : the total for France and therefore the European aggregates include the overseas departments 41
52 Table Objective 2 - Employment Rate Employed persons as a share of total population of the same age class NUTS 2 Country (1) PR (2) IR (3) PU MS value Belgium Czech Republic Denmark Germany Estonia Greece Spain France Ireland Italy Cyprus Latvia Lithuania Luxembourg Hungary Malta Netherlands Austria Poland Portugal Slovenia Slovakia Finland Sweden United Kingdom Bulgaria Romania EU G2 EU G2 NMS G2 EU G2 Note : the total for France and therefore the European aggregates include the overseas departments 42

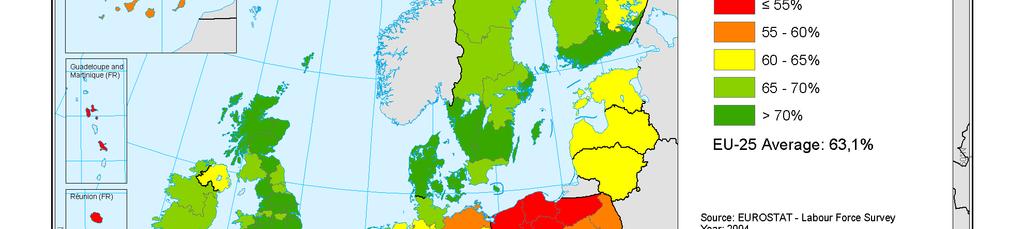
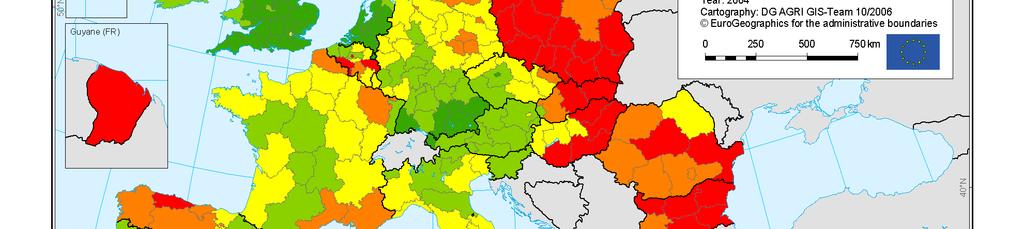
53 Map
54 Table a Objective 3 - Unemployment Rate of unemployment (% of active population) NUTS 3 Country (1) PR (2) IR (3) PU MS value Belgium n.a. n.a. n.a. 8.4 Czech Republic Denmark Germany n.a. n.a. n.a Estonia Greece n.a. n.a. n.a Spain excl. ES France excl. FR Ireland Italy Cyprus Latvia Lithuania Luxembourg Hungary Malta Netherlands Austria n.a. n.a. n.a. 4.9 Poland Portugal n.a. n.a. n.a. 6.7 Slovenia Slovakia Finland excl. FI Sweden United Kingdom n.a. n.a. n.a. 4.7 Bulgaria Romania EU excl. BE, DE, EL, AT, PT, UK 9.2 EU excl. BE, DE, EL, AT, PT, UK 8.2 NMS EU excl. BE, DE, EL, AT, PT, UK 9.2 Note : the total for France and therefore the European aggregates include the overseas departments Table b Objective 3 - Unemployment Rate of unemployment (% of active population) NUTS 2 Country (1) PR (2) IR (3) PU MS value Belgium Czech Republic Denmark Germany Estonia Greece Spain France Ireland Italy Cyprus Latvia Lithuania Luxembourg Hungary Malta Netherlands Austria Poland Portugal excl. PT20 & Slovenia Slovakia Finland 8.9 excl. FI Sweden United Kingdom Bulgaria Romania EU EU NMS EU Note : the total for France and therefore the European aggregates include the overseas departments 44

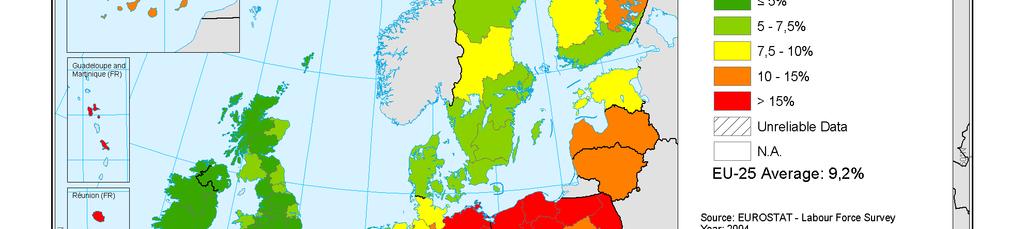
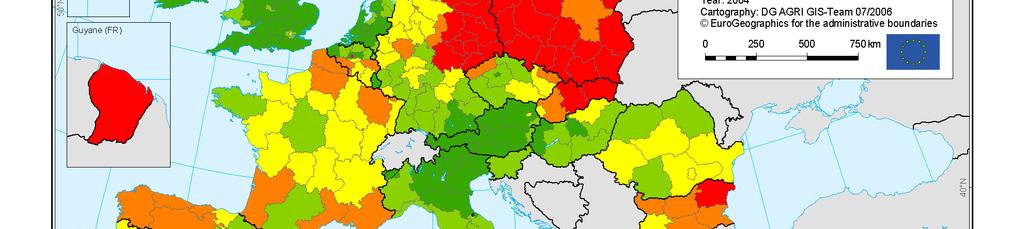
55 Map
56 Table Context 21 - Long-Term Unemployment % long-term unemployment (as a share of active population) NUTS 2 Country (1) PR (2) IR (3) PU MS harmonised long term unemployment rate Belgium Czech Republic Denmark Germany DE Estonia Greece Spain France Ireland Italy Cyprus Latvia Lithuania Luxembourg Hungary Malta Netherlands Austria Poland Portugal Slovenia Slovakia Finland Sweden United Kingdom Bulgaria Romania EU EU NMS EU G2 Note: The total for France and therefore the European aggregates include the data for overseas departments at regional level, on the contrary of the harmonised rate of long-term unemployment. 46

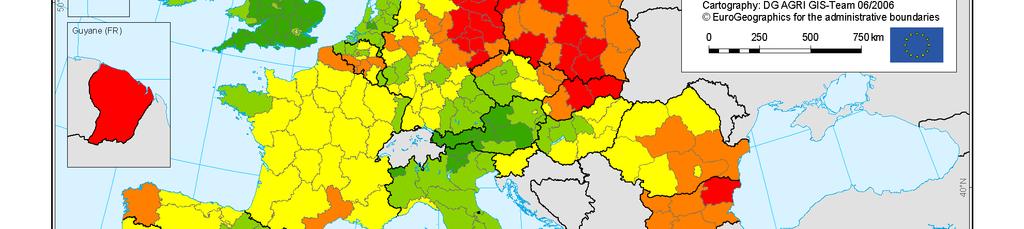
57 Map
58 48
59 SECTION 3.3 SECTORAL ECONOMIC INDICATORS 49
60 Table i Objective 8 - Employment Development of Primary Sector 1000 employed in primary sector (Branch A) NUTS 2 Country (1) PR (2) IR (3) PU MS value Belgium Czech Republic Denmark Germany NUTS Estonia Greece Spain excl. ES France Ireland Italy excl. ITD1 & Cyprus Latvia Lithuania Luxembourg Hungary Malta Netherlands LFS A_B Austria Poland Portugal Slovenia Slovakia Finland Sweden United Kingdom Bulgaria Romania LFS A_B EU EU NMS EU Note : the total for France and therefore the European aggregates do not include the overseas departments Table ii (Objective 8) - Employment Development of Primary Sector Share of employment in primary sector (A - as % of total employment) NUTS 2 Country (1) PR (2) IR (3) PU MS value Belgium Czech Republic Denmark Germany NUTS Estonia Greece Spain excl. ES France Ireland Italy excl. ITD1 & Cyprus Latvia Lithuania Luxembourg Hungary Malta Netherlands LFS A_B 2.8 Austria Poland Portugal Slovenia Slovakia Finland Sweden United Kingdom Bulgaria Romania LFS A_B 36.8 EU EU NMS EU Note : the total for France and therefore the European aggregates do not include the overseas departments 50
61 Map
62 Table i Objective 9 - Economic Development of Primary Sector Gross Value Added in primary sector (Branch A) in Million Euros NUTS 2 Country (1) PR (2) IR (3) PU MS - Summary of available data (Regional Accounts) MS value (National accounts, unless precised) Belgium Czech Republic Denmark Germany NUTS Estonia Greece Spain excl. ES France Ireland reg.accounts Italy excl. ITD1 & Cyprus Latvia Lithuania Luxembourg Hungary Malta n.a. n.a reg.accounts 2000 Netherlands Austria Poland Portugal reg.accounts Slovenia Slovakia Finland Sweden United Kingdom reg.accounts Bulgaria reg.accounts Romania EU excl. MT exclud. MT EU NMS excl. MT exclud. MT EU excl.mt exclud. MT Notes : - The total for France and therefore the European aggregates include the overseas departments - The difference between National Accounts and Regional Accounts may be explained by a difference in the pace of update. Table ii Objective 9 - Economic Development of Primary Sector Share of GVA in primary sector (A - as % of total GVA) NUTS 2 Country (1) PR (2) IR (3) PU MS - Summary of available data (Regional Accounts) Belgium Czech Republic Denmark Germany NUTS Estonia Greece Spain excl. ES France Ireland reg.accounts Italy excl. ITD1 & Cyprus Latvia Lithuania Luxembourg Hungary Malta n.a. n.a. n.a. n.a. 2.1 reg.accounts 2000 Netherlands Austria Poland Portugal reg.accounts Slovenia Slovakia Finland Sweden United Kingdom reg.accounts Bulgaria reg.accounts Romania EU excl. MT 2.3 exclud. MT EU NMS excl. MT 5.4 exclud. MT EU excl.mt 2.3 exclud. MT Notes : - The total for France and therefore the European aggregates include the overseas departments - The difference between National Accounts and Regional Accounts may be explained by a difference in the pace of update. 52 MS value (National accounts, unless precised)

63 Map
64 Table a Country % UAA in arable land Context 3 - Agricultural Land Use FSS District level (1)PR (2)IR (3)PU MS value % UAA in % UAA in % UAA in % UAA in % UAA in % UAA in % UAA in % UAA in % UAA in % UAA in permanent permanent permanent permanent permanent permanent permanent arable land arable land arable land pasture crops pasture crops pasture crops pasture Belgium Czech Republic Denmark Germany Estonia Greece Spain n.a. n.a. n.a. n.a. n.a. n.a. n.a. n.a. n.a France Ireland Italy Cyprus Latvia Lithuania Luxembourg Hungary Malta Netherlands Austria Poland Portugal Slovenia n.a. n.a. n.a. n.a. n.a. n.a. n.a. n.a. n.a Slovakia Finland Sweden United Kingdom Bulgaria Romania EU excl. ES, SI EU excl. ES NMS excl. SI EU excl. ES, SI Note : the total for France and therefore the European aggregates include the overseas departments % UAA in permanent crops Table b % UAA in arable land (1)PR % UAA in permanent pasture % UAA in permanent crops % UAA in arable land (2)IR % UAA in permanent pasture % UAA in permanent crops % UAA in arable land (3)PU % UAA in permanent pasture % UAA in permanent crops % UAA in arable land MS value % UAA in permanent pasture % UAA in permanent crops Country Belgium Czech Republic Denmark Germany Estonia Greece Spain France Ireland Italy Cyprus Latvia Lithuania Luxembourg Hungary Malta Neteherlands Austria Poland Portugal Slovenia Slovakia Finland Sweden United Kingdom Bulgaria Romania EU EU NMS EU Note : the total for France and therefore the European aggregates include the overseas departments Context 3 - Agricultural Land Use FSS Region level 54

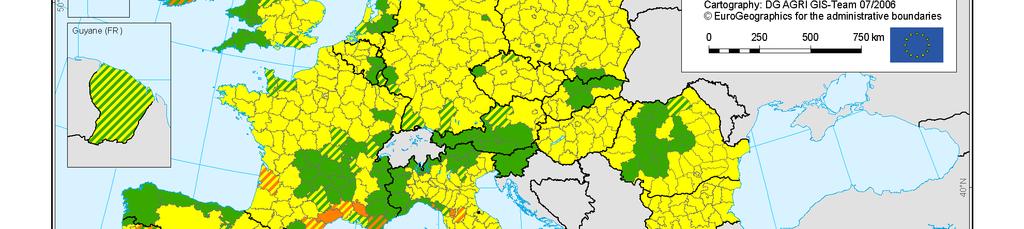
65 Map
66 Table a (Context 4) - Farm Structure % of farms in the different types of areas FSS District level Country % PR % IR % PU MS total number of holdings Belgium Czech Republic Denmark Germany Estonia Greece Spain n.a. n.a. n.a France Ireland Italy Cyprus Latvia Lithuania Luxembourg Hungary Malta Netherlands Austria Poland Portugal Slovenia n.a. n.a. n.a Slovakia Finland Sweden United Kingdom Bulgaria Romania EU excl. ES, SI EU excl. ES NMS excl. SI EU excl. ES, SI Note : the total for France and therefore the European aggregates include the overseas departments Table b (Context 4) - Farm Structure % of farms in the different types of areas FSS Region level Country % PR % IR % PU MS total number of holdings Belgium Czech Republic Denmark Germany Estonia Greece Spain France Ireland Italy Cyprus Latvia Lithuania Luxembourg Hungary Malta Netherlands Austria Poland Portugal Slovenia Slovakia Finland Sweden United Kingdom Bulgaria Romania EU EU NMS EU Note : the total for France and therefore the European aggregates include the overseas departments 56

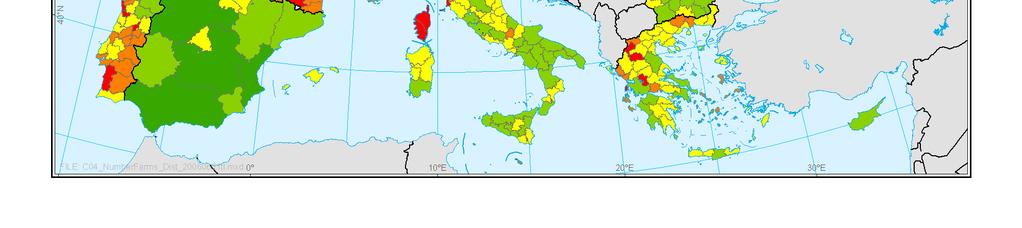
67 Map
68 Table a Country % PR % IR % PU MS total UAA (ha) Belgium Czech Republic Denmark Germany Estonia Greece Spain n.a. n.a. n.a France Ireland Italy Cyprus Latvia Lithuania Luxembourg Hungary Malta Netherlands Austria Poland Portugal Slovenia n.a. n.a. n.a Slovakia Finland Sweden United Kingdom Bulgaria Romania EU excl. ES, SI EU excl. ES NMS excl. SI EU excl. ES, SI Note : the total for France and therefore the European aggregates include the overseas departments Table b (Context 4) - Farm Structure % of UAA in the different types of areas FSS District level (Context 4) - Farm Structure % of UAA in the different types of areas FSS Region level Country % PR % IR % PU MS total UAA (ha) Belgium Czech Republic Denmark Germany Estonia Greece Spain France Ireland Italy Cyprus Latvia Lithuania Luxembourg Hungary Malta Netherlands Austria Poland Portugal Slovenia Slovakia Finland Sweden United Kingdom Bulgaria Romania EU EU NMS EU Note : the total for France and therefore the European aggregates include the overseas departments 58

69 Map
70 Table a Context 4 - Farm Structure Average physical farm size (ha) in the different types of areas FSS District level Country (1)PR (2)IR (3)PU MS value Belgium Czech Republic Denmark Germany Estonia Greece Spain n.a. n.a. n.a France Ireland Italy Cyprus Latvia Lithuania Luxembourg Hungary Malta Netherlands Austria Poland Portugal Slovenia n.a. n.a. n.a. 6.3 Slovakia Finland Sweden United Kingdom Bulgaria Romania EU excl. ES, SI 15.8 EU excl. ES 20.2 NMS excl. SI 8.3 EU excl. ES, SI 11.5 Note : the total for France and therefore the European aggregates include the overseas departments Table b Context 4 - Farm Structure Average physical farm size (ha) in the different types of areas FSS Region level Country (1)PR (2)IR (3)PU MS value Belgium Czech Republic Denmark Germany Estonia Greece Spain France Ireland Italy Cyprus Latvia Lithuania Luxembourg Hungary Malta Netherlands Austria Poland Portugal Slovenia Slovakia Finland Sweden United Kingdom Bulgaria Romania EU EU NMS EU Note : the total for France and therefore the European aggregates include the overseas departments 60
71 Map
72 Table a Context 4 - Farm Structure Distribution of farms by physical size (ha) in the different types of areas FSS District level (1) PR (2) IR (3) PU) MS distribution Country % of farms < 5ha % of farms >5 - <50 ha % of farms > 50 ha % of farms < 5ha % of farms >5 - <50 ha % of farms > 50 ha % of farms < 5ha % of farms >5 - <50 ha % of farms > 50 ha % of farms < 5ha % of farms >5 - <50 ha % of farms > 50 ha Belgium Czech Republic n.s. n.s Denmark Germany Estonia Greece Spain n.a. n.a. n.a. n.a. n.a. n.a. n.a. n.a. n.a France Ireland Italy Cyprus Latvia Lithuania Luxembourg Hungary Malta Netherlands Austria Poland Portugal Slovenia n.a. n.a. n.a. n.a. n.a. n.a. n.a. n.a. n.a Slovakia Finland Sweden United Kingdom Bulgaria Romania EU excl. ES, IT, SI EU excl. ES, IT NMS excl.si EU excl. ES, IT, SI Notes : - The total for France and therefore the European aggregates include the overseas departments - In France, due to data availability, the % of farms in the first 2 classes may be slightly underestimated in PR & IR regions (leading to a total <100%) - In Portugal & Greece, due to data availability, the % of farms in the last 2 classes is slighlty underestimated in PR & IR regions (leading to a total < 100%) Table b Context 4 - Farm Structure Distribution of farms by physical size (ha) in the different types of areas FSS Region level (1)PR (2)IR (3)PU MS distribution Country % of farms < 5ha % of farms >5 - <50 ha % of farms > 50 ha % of farms < 5ha % of farms >5 - <50 ha % of farms > 50 ha % of farms < 5ha % of farms >5 - <50 ha % of farms > 50 ha % of farms < 5ha % of farms >5 - <50 ha % of farms > 50 ha Belgium Czech Republic n.s. n.s Denmark Germany Estonia Greece Spain France Ireland Italy Cyprus Latvia Lithuania Luxembourg Hungary Malta Netherlands Austria Poland Portugal Slovenia Slovakia Finland Sweden United Kingdom Bulgaria Romania EU EU NMS EU Note : the total for France and therefore the European aggregates include the overseas departments 62
73 Map
74 Table a Context 4 - Farm Structure Average economic farm size (ESU) in the different types of areas FSS District level Country (1)PR (2)IR (3)PU MS value Belgium Czech Republic Denmark Germany Estonia Greece Spain n.a. n.a. n.a France Ireland Italy Cyprus Latvia Lithuania Luxembourg Hungary Malta Netherlands Austria Poland Portugal Slovenia n.a. n.a. n.a. 4.6 Slovakia Finland Sweden United Kingdom Bulgaria Romania EU excl. ES, SI 14.4 EU excl. ES 20.7 NMS excl. SI 3.5 EU excl. ES, SI 9.9 Note : the total for France and therefore the European aggregates include the overseas departments Table b Context 4 - Farm Structure Average economic farm size (ESU) in the different types of areas FSS Region level Country (1)PR (2)IR (3)PU MS value Belgium Czech Republic Denmark Germany Estonia Greece Spain France Ireland Italy Cyprus Latvia Lithuania Luxembourg Hungary Malta Netherlands Austria Poland Portugal Slovenia Slovakia Finland Sweden United Kingdom Bulgaria Romania EU EU NMS EU Note : the total for France and therefore the European aggregates include the overseas departments 64

75 Map
76 Table a Context 4 - Farm Structure Distribution of farms by economic size (ESU) in the different types of areas FSS District level (1) PR (2) IR (3) PU) MS distribution Country % of farms % of farms % of farms % of farms % of farms % of farms % of farms % of farms % of farms % of farms % of farms % of farms < 2 ESU ESU > 100 ESU < 2 ESU ESU > 100 ESU < 2 ESU ESU > 100 ESU < 2 ESU ESU > 100 ESU Belgium Czech Republic Denmark Germany Estonia Greece Spain n.a. n.a. n.a. n.a. n.a. n.a. n.a. n.a. n.a France Ireland Italy Cyprus Latvia Lithuania Luxembourg Hungary Malta Netherlands Austria Poland Portugal Slovenia n.a. n.a. n.a. n.a. n.a. n.a. n.a. n.a. n.a Slovakia Finland Sweden United Kingdom Bulgaria Romania EU excl. ES, SI EU excl. ES NMS excl. SI EU excl. ES, SI Note : the total for France and therefore the European aggregates include the overseas departments Table b Context 4 - Farm Structure Distribution of farms by economic size (ESU) in the different types of areas FSS Region level (1)PR (2)IR (3)PU MS distribution Country % of farms % of farms % of farms % of farms % of farms % of farms % of farms % of farms % of farms % of farms % of farms % of farms < 2 ESU ESU > 100 ESU < 2 ESU ESU > 100 ESU < 2 ESU ESU > 100 ESU < 2 ESU ESU > 100 ESU Belgium Czech Republic Denmark Germany Estonia Greece Spain France Ireland Italy Cyprus Latvia Lithuania Luxembourg Hungary Malta Netherlands Austria Poland Portugal Slovenia Slovakia Finland Sweden United Kingdom Bulgaria Romania EU EU NMS EU Note : the total for France and therefore the European aggregates include the overseas departments 66

77 Map
78 Table a (Context 4) - Farm Structure % of Agricultural Labour Force in the different types of areas FSS District level Country % PR % IR % PU MS total agricultural labour force (AWU) Belgium Czech Republic Denmark Germany Estonia Greece Spain n.a. n.a. n.a France Ireland Italy Cyprus Latvia Lithuania Luxembourg Hungary Malta Netherlands Austria Poland Portugal Slovenia n.a. n.a. n.a Slovakia Finland Sweden United Kingdom Bulgaria Romania EU excl. ES, SI EU excl. ES NMS excl. SI EU excl. ES, SI Note : the total for France and therefore the European aggregates include the overseas departments Table b (Context 4) - Farm Structure % of Agricultural Labour Force in the different types of areas FSS Region level Country % PR % IR % PU MS total agricultural labour force (AWU) Belgium Czech Republic Denmark Germany Estonia Greece Spain France Ireland Italy Cyprus Latvia Lithuania Luxembourg Hungary Malta Netherlands Austria Poland Portugal Slovenia Slovakia Finland Sweden United Kingdom Bulgaria Romania EU EU NMS EU Note : the total for France and therefore the European aggregates include the overseas departments 68
79 Map
80 Table a Objective 16 - Importance of Semi-Subsistence Farming in NMS % of farms < 1 ESU - FSS District level Country (1)PR (2)IR (3)PU MS value Belgium Czech Republic Denmark Germany Estonia Greece Spain France Ireland Italy Cyprus Latvia Lithuania Luxembourg Hungary Malta Netherlands Austria Poland Portugal Slovenia Slovakia Finland Sweden United Kingdom Bulgaria Romania EU EU NMS EU Note : the total for France and therefore the European aggregates include the overseas departments Table b Objective 16 - Importance of Semi-Subsistence Farming in NMS % of farms < 1 ESU - FSS Region level Country (1)PR (2)IR (3)PU MS value Belgium Czech Republic Denmark Germany Estonia Greece Spain France Ireland Italy Cyprus Latvia Lithuania Luxembourg Hungary Malta Netherlands Austria Poland Portugal Slovenia Slovakia Finland Sweden United Kingdom Bulgaria Romania EU EU NMS EU Note : the total for France and therefore the European aggregates include the overseas departments 70

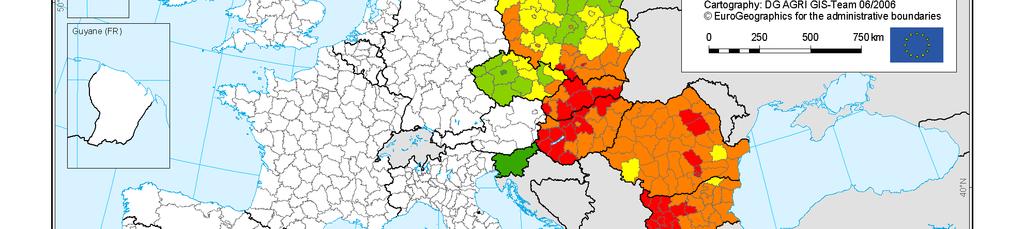
81 Map
82 Table a Objective 4 - Training and Education in Agriculture % of farmers with basic or full agricultural training FSS District level Country (1) PR (2) IR (3) PU MS value Belgium Czech Republic n.a. n.a. n.a. n.a. Denmark Germany excl. DEC (PU); DED3, DEE1 & DEE2 (IR) 56.1 Estonia n.a. n.a. n.a. n.a. Greece Spain France excl. FR101; FR9 (PU) 45.7 Ireland Italy Cyprus n.a. n.a. n.a. n.a. Latvia n.a. n.a. n.a Lithuania n.a. n.a. n.a. n.a. Luxembourg Hungary n.a. n.a. n.a. n.a. Malta n.a. n.a. n.a. n.a. Netherlands Austria Poland n.a. n.a. n.a. n.a. Portugal Slovenia n.a. n.a. n.a. n.a. Slovakia n.a. n.a. n.a. n.a. Finland Sweden n.a. n.a. n.a. n.a. United Kingdom excl. UKJ3, UKH2, UKE3_4, UKD3_4_5 (PU) 22.7 Bulgaria n.a. n.a. n.a. n.a. Romania n.a. n.a. n.a. n.a. EU25 n.a. n.a. n.a. n.a. EU excl. SE 17.5 excl. SE NMS10 n.a. n.a. n.a. n.a. EU27 n.a. n.a. n.a. n.a. Note : the total for France and therefore the European aggregates do not include the overseas departments Table b Objective 4 - Training and Education in Agriculture % of farmers with basic or full agricultural training FSS Region level Country (1) PR (2) IR (3) PU MS value Belgium Czech Republic n.a. n.a. n.a. n.a. Denmark Germany excl. DEC (PU) 56.1 Estonia n.a. n.a. n.a. n.a. Greece Spain France excl. FR90 (PU) 45.7 Ireland Italy Cyprus n.a. n.a. n.a. n.a. Latvia n.a. n.a. n.a Lithuania n.a. n.a. n.a. n.a. Luxembourg Hungary n.a. n.a. n.a. n.a. Malta n.a. n.a. n.a. n.a. Netherlands Austria Poland n.a. n.a. n.a. n.a. Portugal Slovenia n.a. n.a. n.a. n.a. Slovakia n.a. n.a. n.a. n.a. Finland Sweden n.a. n.a. n.a. n.a. United Kingdom Bulgaria n.a. n.a. n.a. n.a. Romania n.a. n.a. n.a. n.a. EU25 n.a. n.a. n.a. EU excl. SE 17.5 excl. SE NMS10 n.a. n.a. n.a. EU27 n.a. n.a. n.a. Note : the total for France and therefore the European aggregates do not include the overseas departments 72

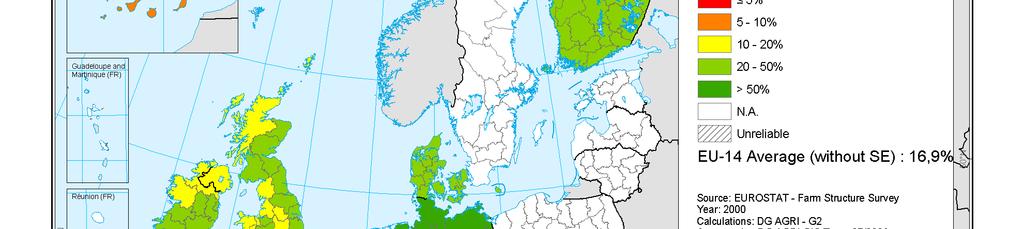
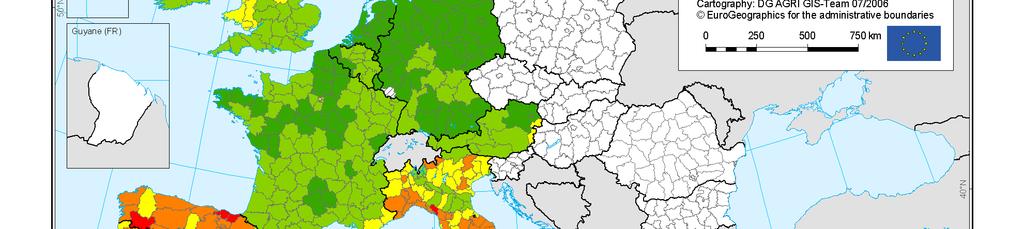
83 Map
84 Table a Objective 5 - Age Structure in Agriculture Ratio: farmers <35 y.o. / >55 y.o FSS District level Country (1)PR (2)IR (3)PU MS value Belgium Czech Republic Denmark Germany Estonia Greece Spain n.a. n.a. n.a France Ireland Italy IT: missing data mainly in PU 0.06 Cyprus 0.14 circonscriptions 0.14 Latvia Lithuania Luxembourg Hungary Malta Netherlands Austria Poland Portugal Slovenia n.a. n.a. n.a Slovakia Finland Sweden United Kingdom Bulgaria Romania EU excl. ES, SI 0.18 EU excl. ES 0.12 NMS excl. SI 0.32 EU excl. ES, SI 0.16 Note : the total for France and therefore the European aggregates include the overseas departments Table b Objective 5 - Age Structure in Agriculture Ratio: % farmers <35 y.o. / >55 y.o FSS Region level Country (1)PR (2)IR (3)PU MS value Belgium Czech Republic Denmark Germany Estonia Greece Spain France Ireland Italy Cyprus Latvia Lithuania Luxembourg Hungary Malta Netherlands Austria Poland Portugal Slovenia Slovakia Finland Sweden United Kingdom Bulgaria Romania EU EU NMS EU Note : the total for France and therefore the European aggregates include the overseas departments 74

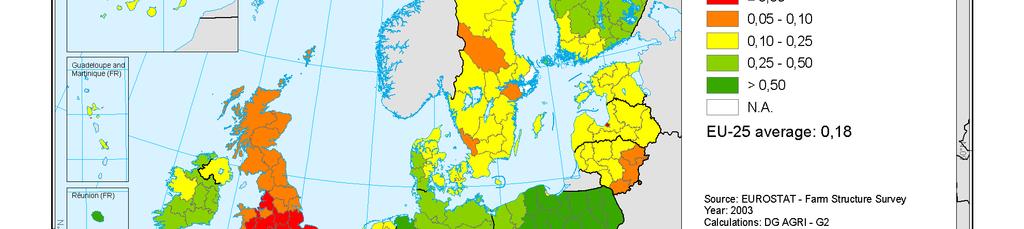
85 Map
86 Indicator Measurement Source Year Table i Objective 6 - Labour Productivity in Agriculture GVA( at basic price - in euros)/awu (EU-25=100) Eurostat Economic Accounts for Agriculture average Table ii Objective 6 - Labour Productivity in Agriculture by Sector GVA(at factor cost - in euros)/awu DG AGRI FADN average Unit Subdivisions index of euros (1) Specialist field crops (2) Specialist horticulture (3) Specialist permanent Crops (4) Specialist grazing livestock Thousand Euro/AWU (5) Specialist granivore (6) Mixed cropping (7) Mixed livestock (8) Mixed cropslivestock A28 General TF Country Belgium Czech Republic 41 n.a. n.a. n.a. n.a. n.a. n.a. n.a. n.a. n.a. Denmark Germany Estonia 24 n.a. n.a. n.a. n.a. n.a. n.a. n.a. n.a. n.a. Greece n.s Spain France Ireland n.a. n.a n.s. n.s. n.s Italy Cyprus 87 n.a. n.a. n.a. n.a. n.a. n.a. n.a. n.a. n.a. Latvia 10 n.a. n.a. n.a. n.a. n.a. n.a. n.a. n.a. n.a. Lithuania 15 n.a. n.a. n.a. n.a. n.a. n.a. n.a. n.a. n.a. Luxembourg n.a n.s. n.s Hungary 22 n.a. n.a. n.a. n.a. n.a. n.a. n.a. n.a. n.a. Malta 86 n.a. n.a. n.a. n.a. n.a. n.a. n.a. n.a. n.a. Netherlands Austria n.s Poland 14 n.a. n.a. n.a. n.a. n.a. n.a. n.a. n.a. n.a. Portugal Slovenia 28 n.a. n.a. n.a. n.a. n.a. n.a. n.a. n.a. n.a. Slovakia 24 n.a. n.a. n.a. n.a. n.a. n.a. n.a. n.a. n.a. Finland n.s n.s Sweden n.a. n.a n.s. n.s United Kingdom Bulgaria 12 n.a. n.a. n.a. n.a. n.a. n.a. n.a. n.a. n.a. Romania 14 n.a. n.a. n.a. n.a. n.a. n.a. n.a. n.a. n.a. EU Euros/AWU n.a. n.a. n.a. n.a. n.a. n.a. n.a. n.a. n.a. EU NMS10 18 n.a. n.a. n.a. n.a. n.a. n.a. n.a. n.a. n.a. EU27 79 n.a. n.a. n.a. n.a. n.a. n.a. n.a. n.a. n.a. 76
87 Graph Objective 6 - Labour Productivity in Agriculture by Country as compared to EU25 (EU25 = Euros/AWU = average ) BE CZ DK DE EE EL ES FR IE IT CY LV LT LU HU MT NL AT PL PT SI SK FI SE UK BG RO EU25 EU15 NMS10 EU27 77
88 Table iii Country (1) PR (2) IR (3) PU Objective 6 - Labour Productivity in Agriculture GVA / AWU (thousands Euros / AWU) / NUTS 2 MS - summary of available data value MS value - average Belgium n.a. n.a. n.a. n.a Czech Republic 5.8 n.a. 5.8 excl. CZ01 (PU) / Denmark Germany n.a. n.a. n.a. n.a Estonia Greece / Spain excl. ES 11, 12, France excl. FR 81, 82, Ireland / Italy excl. ITD1 & / Cyprus Latvia Lithuania Luxembourg Hungary / Malta Netherlands Austria / Poland n.a. n.a. n.a. n.a Portugal n.a. n.a. n.a. n.a. 2000/ Slovenia Slovakia Finland / Sweden / United Kingdom /2003 (partly) Bulgaria n.a. n.a. n.a. n.a Romania n.a. n.a. n.a. n.a EU excl. BE, DE, PL, PT EU excl. BE, DE, PT NMS excl. PL 3.01 EU27 n.a. n.a. n.a. n.a Notes: - The total for France and therefore the European aggregates include the overseas departments - The difference between National Accounts and Regional Accounts for a same year may be explained by a difference in the pace of update. 78

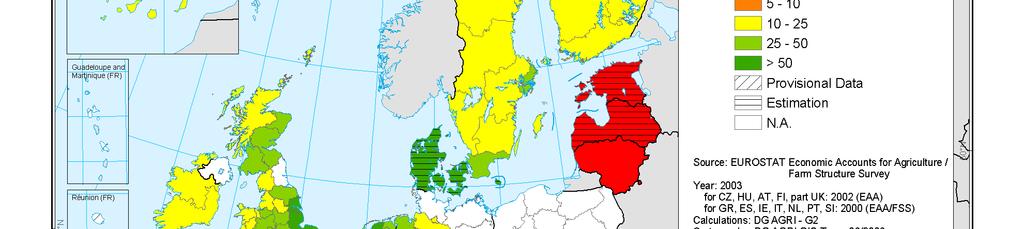
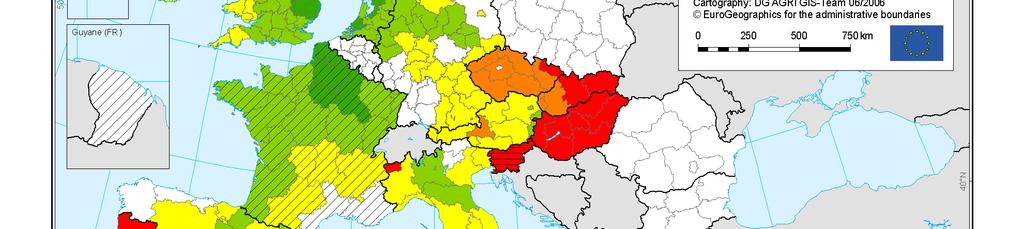
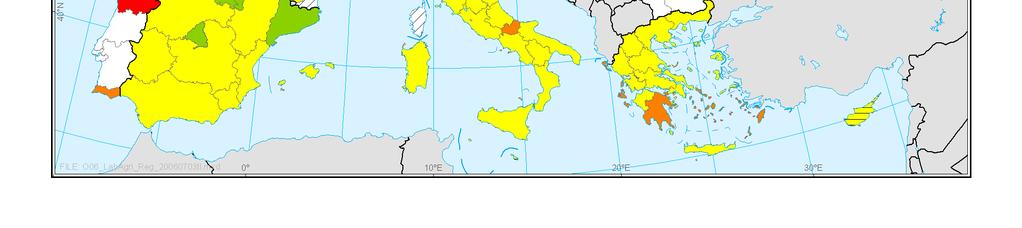
89 Map
90 Table i Objective 7 - Gross Fixed Capital Formation in Agriculture Gross Fixed Capital Formation in agriculture in Mio Euro - NUTS 2 Country (1) PR (2) IR (3) PU Belgium n.a. n.a. n.a Czech Republic Denmark n.a. n.a. n.a Germany n.a. n.a. n.a Estonia n.a. n.a. n.a. n.a. Greece Spain n.a. n.a. n.a France p Ireland n.a. n.a. n.a. n.a. Italy n.a. n.a. n.a Cyprus n.a. n.a. n.a e Latvia n.a. n.a. n.a Lithuania n.a. n.a. n.a Luxembourg n.a. n.a. n.a Hungary n.a. n.a. n.a Malta n.a. n.a. n.a. n.a. Netherlands p Austria Poland n.a. n.a. n.a Portugal n.a. n.a. n.a Slovenia n.a. n.a. n.a Slovakia Finland Sweden n.a. n.a. n.a United Kingdom Bulgaria n.a. n.a. n.a. n.a. Romania n.a. n.a. n.a EU25 n.a. n.a. n.a excl.ee, IE, MT EU15 n.a. n.a. n.a excl. IE NMS10 n.a. n.a. n.a excl. EE, MT EU27 n.a. n.a. n.a excl.ee, IE, MT, BG Note: The total for France and therefore the European aggregates include the overseas departments Table ii (Objective 7) - Gross Fixed Capital Formation in Agriculture Gross Fixed Capital Formation as a share of GVA in agriculture - NUTS 2 Country (1) PR (2) IR (3) PU Belgium n.a. n.a. n.a Czech Republic 35.6 n.a Denmark n.a. n.a. n.a Germany n.a. n.a. n.a Estonia n.a. n.a. n.a. n.a. Greece Spain n.a. n.a. n.a France p Ireland n.a. n.a. n.a. n.a. Italy n.a. n.a. n.a Cyprus n.a. n.a. n.a e Latvia n.a. n.a. n.a Lithuania n.a. n.a. n.a Luxembourg n.a. n.a. n.a Hungary n.a. n.a. n.a Malta n.a. n.a. n.a. n.a. Netherlands p Austria Poland n.a. n.a. n.a Portugal n.a. n.a. n.a Slovenia n.a. n.a. n.a Slovakia Finland Sweden n.a. n.a. n.a United Kingdom Bulgaria n.a. n.a. n.a. n.a. Romania n.a. n.a. n.a. 8.8 EU25 n.a. n.a. n.a EU15 n.a. n.a. n.a NMS10 n.a. n.a. n.a excl.ee, MT EU27 n.a. n.a. n.a excl. BG Note: The total for France and therefore the European aggregates include the overseas departments 80 MS GFCF in agriculture - Mio Euro - National Agricultural Accounts MS GFCF/GVA in agriculture - National Agricultural Accounts

91 Map
92 Indicator Measurement Source Year Table Table i Table i Table i Objective 11 - Gross Fixed Objective 12 - Employment Objective 13 - Economic Objective 10 - Labour Productivity in Food Capital Formation in Food Development in Food Development of Food Industry Industry Industry Industry GVA/employed Gross fixed capital formation in Employment development in Gross Value Added in food food industry food industry industry Eurostat Eurostat Eurostat National Accounts National Accounts National Accounts National Accounts Unit Country Belgium Thousands euro / employed 60.7 Million euros Thousands people employed 96.0 Million euros Czech Republic Denmark Germany Estonia n.a. n.a. n.a. n.a. Greece Spain France Ireland Italy Cyprus n.a. n.a. n.a. n.a. Latvia n.a. n.a. n.a. 239 Lithuania n.a n.a. 592 Luxembourg 60.5 n.a Hungary Malta n.a. n.a. n.a. 118 Netherlands Austria Poland n.a. n.a n.a Portugal Slovenia 26.0 n.a Slovakia Finland Sweden United Kingdom Bulgaria n.a. n.a. n.a. n.a. Romania n.a. n.a. n.a EU EU19 (exc. EE, CY, LV, LT, MT, PL) n.a EU n.a NMS10 n.a. n.a. n.a. n.a. EU27 n.a. n.a. n.a. n.a. Indicator Measurement Source Year Table ii Table ii Table ii (Objective 11) - Gross Fixed Capital Formation in Food Industry Gross fixed capital formation in food industry as % of GVA Eurostat National Accounts 2003 (Objective 12) - Employment Development in Food Industry Share of Employment in food industry Eurostat National Accounts 2003 (Objective 13) - Economic Development of Food Industry Share of Gross Value Added in food industry Eurostat National Accounts 2003 Unit Country % % % Belgium Czech Republic Denmark Germany Estonia n.a. n.a. n.a. Greece Spain France Ireland Italy Cyprus n.a. n.a. n.a. Latvia n.a. n.a. 2.7 Lithuania n.a. 4.0 Luxembourg n.a Hungary Malta n.a. n.a. 3.1 Netherlands Austria Poland n.a n.a. Portugal Slovenia n.a Slovakia Finland Sweden United Kingdom Bulgaria n.a. n.a. n.a. Romania n.a. n.a EU25 n.a EU15 n.a NMS10 n.a. n.a. n.a. EU27 n.a. n.a. n.a. 82
93 Graph Objective 10 - Labour Productivity in Food Industry (GVA / Person Employed ) BE CZ DK DE EE EL ES FR IE IT CY LV LT LU HU MT NL AT PL PT SI SK FI SE UK BG RO EU25 EU15 NMS10 EU27 Notes : for FR, PT, SE - no data available for EE, CY, LV, LT, PL, BG & RO - EU25 aggregate based on the 19 available countries Graph Mio. Euros Objective 11 - Gross Fixed Capital Formation in Food industry (2003) % of GVA BE CZ DK DE EE EL ES FR IE IT IT CY CY LV LV LT LT LU LU HU HU MT MT NL NL AT AT PL PL PT PT SI SI SK SK FI FI SE SE UK UK BG BG RO RO EU25 EU25 EU15 EU15 NMS10 NMS10 EU27 EU27 0 Notes: for FR; 2002 for LT, PT, SE - no data available for EE, CY, LV, LU, MT, PL, SI, BG, RO - no data available for the European aggregates GFCF GFCF in food in food industry (Mio. (Mio. Euros) Euros) GFCF GFCF GFCF in food in food in industry food industry as as % % of as of GVA % GVA of GVA 83
94 Graph persons employed 5000 Objective 12 - Employment Development in Food Industry (2003) % total employment BE CZ DK DE EE EL ES FR IE IT CY LV LT LU HU MT NL AT PL PT SI SK FI SE UK BG RO EU25 EU15 NMS10 EU27 Employment in food industry (1000 persons employed) % Employment in food industry Notes: for PL, PT, SE - no data available for EE, CY, LV, LT, MT, BG, RO 84
95 Graph Mio. Euros Objective 13 - Economic Development of Food Industry (2003) % total GVA BE CZ DK DE EE EL ES FR IE IT CY LV LT LU HU MT NL AT PL PT SI SK FI SE UK BG RO EU25 EU15 NMS10 EU27 Notes: for RO; 2002 for FR, SE - no data available for EE, CY, PL, BG Gross Value Added in food industry (Mio. Euros) Share of Gross Value Added in food industry 85
96 Table Table Table Indicator Context 5 - Forestry Structure (Context 5) - Forestry Structure Context 5 - Forestry Structure Context 5 - Forestry Structure Subindicator Area of Forest Available for Wood Supply (FAWS) Ownership Average size of private holding of FOWL Measurement Source Area of Forest Available for Wood Supply (FAWS) % of FOWL Available for Wood Supply Eurostat % of FAWS in different categories of ownership Average size of private holding of FOWL Eurostat Eurostat MCPFE 2003 (TBFRA 2000) (TBFRA 2000) (TBFRA 2000) Year 2000' 2000' 2000' 2003' Unit 1000 ha % % ha Subdivisions Country Belgium owned by public institutions other than State 32.4 in private ownership Czech Republic Denmark Germany Estonia Greece n.a. Spain France Ireland Italy Cyprus n.a. Latvia Lithuania Luxembourg Hungary Malta Netherlands Austria n.a. Poland Portugal Slovenia Slovakia Finland Sweden United Kingdom Bulgaria Romania n.a. EU G EU22 (excl.at, CY, EL) EU G EU13 (excl. AT, EL) NMS G NMS9 (excl. CY) EU G n.a. Notes: - The data for France and therefore the European aggregates do not include the overseas departments, when the source is TBFRA The sign "-" means "not relevant" Table Table Table Indicator Subindicator Measurement Source Year Context 6 - Forest Productivity Average net annual volume increment on FAWS Objective 15 - Gross Fixed (Objective 15) - Gross Fixed Capital Formation in Forestry Capital Formation in Forestry Gross fixed capital formation in forestry Gross fixed capital formation as % of GVA in forestry Eurostat Eurostat Eurostat (TBFRA 2000) Economic Accounts for Forestry Economic Accounts for Forestry Objective 14 - Labour Productivity in Forestry GVA/employed Eurostat Economic Accounts for Forestry / LFS 2002 Unit Subdivisions Country 1000 m 3 overbark / year / ha of FAWS Million euros % Thousands euro / employed Belgium n.a. Czech Republic Denmark 7.3 n.a. n.a. n.a. u Germany 8.8 n.a. n.a. n.a. Estonia 3.7 n.a. n.a. n.a. Greece 1.1 n.a. n.a Spain 2.7 n.a. n.a France Ireland 5.9 n.a. n.a. n.a. u Italy Cyprus 1.0 n.a. n.a. n.a. u Latvia 4.6 n.a. n.a. n.a. Lithuania n.a. Luxembourg 7.8 n.a. n.a. n.a. Hungary 5.8 n.a. n.a. n.a. Malta - n.a. n.a. n.a. Netherlands u Austria Poland 4.8 n.a. n.a. n.a. Portugal Slovenia 5.9 n.a. n.a. n.a. u Slovakia 7.2 n.a. n.a. n.a. Finland Sweden n.a. United Kingdom Bulgaria 3.3 n.a. n.a. n.a. Romania n.a. n.a. n.a. n.a. EU G EU EU EU-10 EU G EU EU EU-9 NMS G2 n.a. n.a. n.a. EU27 n.a. G2 n.a. n.a. n.a. Note: The French overseas departments are included in the total for France in the Economic Accounts for Forestry 86
97 Graph ha Context 5 - Forestry Structure - Area of Forest Available for Wood Supply (TBFRA 2000) % FOWL BE CZ DK DE EE EL ES FR IE IT CY LV LT LU HU MT NL AT PL PT SI SK FI SE UK BG RO EU25 EU15 NMS10 EU27 Area of FAWS (1000 ha) % of FOWL available for Wood Supply Graph Context 5 - Forestry Structure - Ownership of Forest Available for Wood Supply (TBFRA 2000) BE CZ DK DE EE EL ES FR IE IT CY LV LT LU HU MT NL AT PL PT SI SK FI SE UK BG RO EU25 EU15 NMS10 EU27 Notes: - no FAWS in Malta - BG: 100% FAWS State owned (TBFRA 2000) Graph % of FAWS owned by public institutions other than State % of FAWS under private ownership Context 5 - Forestry Structure - Average Size of Private Holding of FOWL (ha - MCPFE 2003) BE CZ DK DE EE EL ES FR IE IT CY LV LT LU HU MT NL AT PL PT SI SK FI SE UK BG RO EU25 EU15 NMS10 EU27 Notes: - no data available for EE, CY, AT, RO - BG: no private forest ( MCPFE 2003) - the European aggregates are based on available data 87
98 Graph Context 6 - Forest Productivity (average net annual volume increment on FAWS m3 overbark / year / ha - TBFRA 2000) BE CZ DK DE EE EL ES FR IE IT CY LV LT LU HU MT NL AT PL PT SI SK FI SE UK BG RO EU25 EU15 NMS10 EU27 Notes: - no FAWS in MT - no data available for RO & therefore for EU27 aggregate 88
99 Graph Objective 14- Labour Productivity in Forestry (1000 Euro / Employed ) BE CZ DK DE EE EL ES FR IE IT CY LV LT LU HU MT NL AT PL PT SI SK FI SE UK BG RO EU25 EU15 NMS10 EU27 Notes: - no data available for BE, DK, DE, EE, IE, CY, LV, LT, LU, HU, MT, PL, SI, SK, SE, BG, RO - the European aggregates correspond to the available data Graph Mio. Euros Objective 15 - Gross Fixed Capital Formation in Forestry (2002) % GVA in forestry BE CZ DK DE EE EL ES FR IE IT CY LV LT LU HU MT NL AT PL PT SI SK FI SE UK BG RO EU25 EU15 NMS10 EU27 GFCF in forestry GFCF as % of GVA in forestry Notes: - no data available for DK, DE, EE, EL, ES, IE, CY, LV, LU, HU, MT, PL, SI, SK, BG, RO for BE,SE ; 2002 for CZ, NL - the European aggregates correspond to the available data 89
100 90
101 SECTION 3.4 ENVIRONMENT 91
102 Table Indicator Measurement Source Year Context 7 - Land Cover % area in the different categories of land cover CLC Unit Subdivisions % agricultural area % forest area % natural area % artificial area Country Belgium Czech Republic Denmark Germany Estonia Greece Spain France Ireland Italy Cyprus Latvia Lithuania Luxembourg Hungary Malta Netherlands Austria Poland Portugal Slovenia Slovakia Finland Sweden United Kingdom Bulgaria Romania EU EU NMS EU Notes: - The data for France and therefore the European aggregates do not include the overseas departments - The data for Portugal and therefore the European aggregates do not include data for Açores & Madeira % 92

103 Map
104 Indicator Subindicator Measurement Source Year Table Table Table Context 8- Less Favoured Areas Context 9 - Areas of Extensive Agriculture % UAA for extensive arable % UAA for extensive grazing crop % UAA in the different categories of LFA MS (communication to Council for SCA 7971/05) (or Eurostat FSS) 2000 % UAA where cereals yield % UAA where livestock density < 60% of EU27-average < 1 LU/ha of forage area (2.68 t/ha) Eurostat (FSS / crops Eurostat (FSS / land use) production) (MT: communication to Council for SCA 7971/05) Unit Subdivisions % UAA non LFA % UAA in LFA mountain % % UAA in LFA other % UAA in LFA specific % % Country Belgium Czech Republic Denmark Germany Estonia Greece Spain France Ireland Italy Cyprus Latvia Lithuania Luxembourg Hungary Malta Netherlands Austria Poland Portugal Slovenia Slovakia Finland Sweden United Kingdom Bulgaria n.a. n.a. n.a. n.a Romania n.a. n.a. n.a. n.a EU EU NMS EU27 n.a. n.a. n.a. n.a Note: The LFA data for France and therefore the European aggregates do not include the overseas departments 94

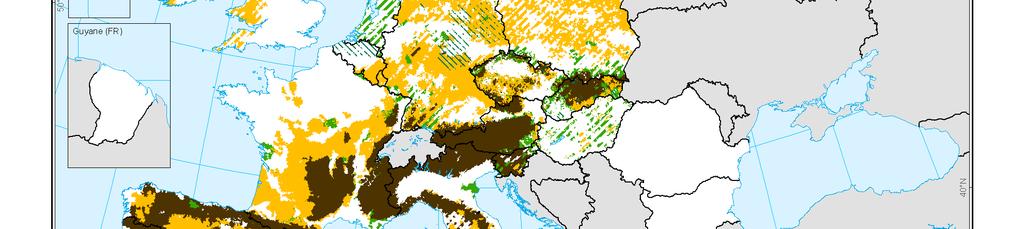
105 Map

106 Map
107 Map
108 Indicator Subindicator Measurement Source Table Table Table Context 10 - Natura 2000 Area % Territory under Natura % UAA under Natura 2000 % Forest area under Natura 2000 (SCI & SPA) (SCI) 2000 (SCI) % territory under Natura 2000 % UAA under Natura 2000 % forest area under Natura DG ENV. EEA (ETC_NPB) EEA (ETC_NPB) Year May 2005 for EU15 December 2004 December 2004 Unit Country Belgium February 2005 for NMS % 12.6 % 3.1 % 21.9 Czech Republic 18.0 n.a. n.a. Denmark Germany Estonia 22.9 n.a. n.a. Greece n.a. Spain France Ireland Italy Cyprus 5.0 n.a. n.a. Latvia 11.0 n.a. n.a. Lithuania 7.1 n.a. n.a. Luxembourg Hungary 24.5 n.a. n.a. Malta 12.5 n.a. n.a. Netherlands Austria Poland 10.3 n.a. n.a. Portugal Slovenia 54.3 n.a. n.a. Slovakia 36.9 n.a. n.a. Finland Sweden United Kingdom Bulgaria n.a. n.a. n.a. Romania n.a. n.a. n.a. EU n.a. n.a. EU NMS n.a. n.a. EU27 n.a. n.a. n.a. Note: The data for France and therefore the European aggregates do not include the overseas departments 98

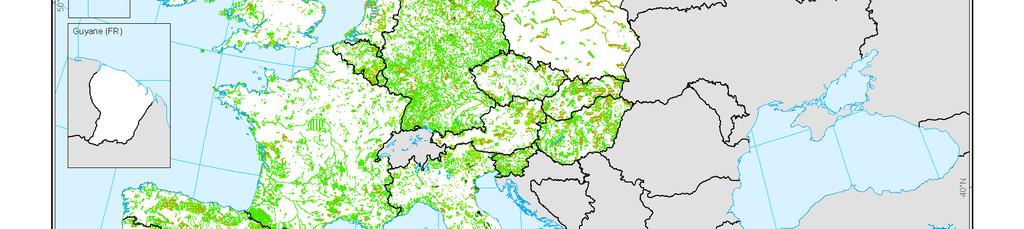
109 Map

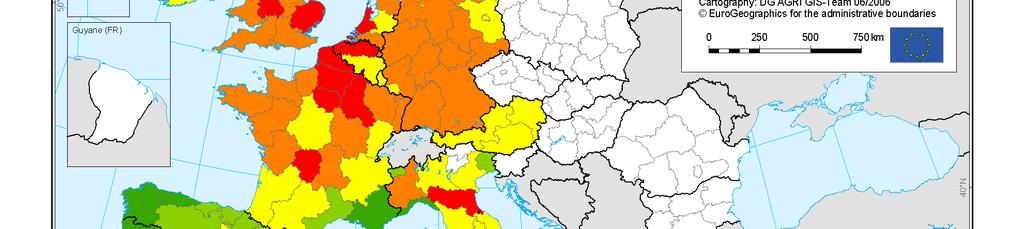
110 Map
111 Graph Context 10 - Natura 2000 Area % Forest Area under Natura 2000 (SCI) - (December 2004) BE CZ DK DE EE EL ES FR IE IT CY LV LT LU HU MT NL AT PL PT SI SK FI SE UK BG RO EU25 EU15 NMS10 EU27 Note: no data for NMS & Accession Countries 101
112 Table Indicator Measurement Source Year Objective 17 - Biodiversity: Population of Farmland Birds Trends of index of population of (19) farmland birds (2000 = 100) Eurostat PECBM (Pan-European Common Bird Monitoring) 2003 Unit Index (2000 = 100) Country Belgium n.a. Czech Republic 78.9 Denmark 92.5 Germany 85.9 Estonia n.a. Greece n.a. Spain 99.5 France Ireland 95.9 Italy 67.3 Cyprus n.a. Latvia 96.7 Lithuania n.a. Luxembourg n.a. Hungary Malta n.a. Netherlands 79.3 Austria 90.6 Poland 86.8 Portugal n.a. Slovenia n.a. Slovakia n.a. Finland Sweden 94.7 United Kingdom 97.0 Bulgaria n.a. Romania n.a. EU MS EU15 n.a. NMS10 n.a. EU27 n.a. Note: The data for France exclude overseas departments 102
113 Graph (1) (Objective 17) - Biodiversity: Population of Farmland birds (1) (Trend of populations of 19 species of farmland birds = 100) eu25 cz dk fr nl fi se uk de Graph (2) Objective 17 - Biodiversity: Population of Farmland Birds (2) (Trend of populations of 19 species of farmland birds = 100) lv es at ie hu it pl eu25 Note: no data available for BE, EE, EL, CY, LT, LU, MT, PT, SI, SK, BG, RO 103
114 Table Indicator Measurement Source Objective 18 - Biodiversity: High Nature Value Farmland UAA of High Nature Value Farmland European Environment Agency (Objective 18) - Biodiversity: High Nature Value Farmland UAA of High Nature Value Farmland European Environment Agency Year Unit Country Belgium Million ha 0.01 indicative Classes 1-10% Czech Republic 0.55 indicative 10-20% Denmark 0.08 indicative 1-10% Germany 0.52 indicative 1-10% Estonia 0.07 indicative 1-10% Greece 1.91 indicative > 30% Spain 8.91 indicative > 30% France 4.19 indicative 10-20% Ireland 1.06 indicative 20-30% Italy 2.75 indicative 20-30% Cyprus n.a. indicative n.a. Latvia 0.12 indicative 1-10% Lithuania 0.02 indicative 0% Luxembourg 0.00 indicative 1-10% Hungary 0.96 indicative 10-20% Malta n.a. indicative n.a. Netherlands 0.04 indicative 1-10% Austria 0.65 indicative 10-20% Poland 1.96 indicative 10-20% Portugal 1.44 indicative > 30% Slovenia 0.27 indicative > 30% Slovakia 0.29 indicative 10-20% Finland 0.11 indicative 1-10% Sweden 0.62 indicative 10-20% United Kingdom 4.27 indicative 20-30% Bulgaria 0.44 indicative 1-10% Romania 2.33 indicative 10-20% EU excluding CY, MT n.a. EU indicative 15-25% NMS excluding CY, MT n.a. EU excluding CY, MT n.a. Note: The data for France do not include the overseas departments 104


115 Illustration Categories of HNV farmland share of UAA GR PT ES UK IE IT SE AT FR FI DE DK NL LU BE > 30% 20-30% 10-20% 1-10% Baseline Indicators Objective 18 - Biodiversity: High Nature Value Farmland Areas Sources: EEA IRENA IRENA 26 Andersen, 2003 quoted in EEA report n 1/ PotentialHNV farm land according to m inim um CO RINE Land Cover selection PotentialHNV farmland Non HNV farm land EU-15 Non EU
116 Table Indicator Measurement Source Year Objective 19 - Biodiversity: Tree Species Composition % of Forest and Other Wooded Land classified by species groups MCPFE Unit Subdivisions predominantly coniferous % FOWL predominantly broadleaved mixed Country Belgium Czech Republic Denmark e Forest only Germany Estonia Greece e Spain France Ireland Italy Cyprus Latvia Lithuania Luxembourg Hungary Malta Netherlands Austria Poland Portugal Slovenia Slovakia Forest only Finland Sweden United Kingdom Bulgaria Romania EU forest for DK, SK EU forest for DK NMS forest for SK EU forest for DK, SK Note: the data for France do not include the overseas departments 106
117 Graph Objective 19 - Biodiversity: Tree Species Composition (% Forest & Other Wooded Land - MCPFE 2003) 100% 80% 60% 40% 20% 0% BE CZ DK DE EE EL ES FR IE IT CY LV LT LU HU MT NL AT PL PT SI SK FI SE UK BG RO EU25 EU15 NMS10 EU27 predominantly coniferous predominantly broadleaved Mixed 107
118 Table Indicator Measurement Source Year Context 11 - Biodiversity: Protected Forest % FOWL area protected under MCPFE classes MCPFE /2002 Unit % Subdivisions Country Belgium MCPFE class MCPFE class MCPFE class MCPFE class Czech Republic Denmark Germany incl. all Natura 2000 area Estonia n.a. n.a. n.a. n.a. Greece Spain France Ireland Italy n.a. n.a. n.a. n.a. Cyprus Latvia Lithuania Luxembourg n.a. Hungary Malta Netherlands Austria Poland Portugal incl. all Natura 2000 area Slovenia 0.88 n.a. n.a Slovakia Finland Sweden United Kingdom Bulgaria Romania n.a. n.a. n.a. n.a. EU EU23(-EE,IT) 1.66 EU22(-EE,IT,SI) 3.71 EU22(-EE,IT,SI) EU23(-EE,IT) EU EU14(-IT) 1.79 EU14(-IT) 3.75 EU14(-IT) 9.96 EU14(-IT) NMS NMS9(-EE) 0.88 NMS8(-EE, SI) 3.46 NMS8(-EE, SI) NMS9(-EE) EU EU24(-EE, IT, RO) 1.68 EU23(-EE, IT, SI, RO) 3.59 EU23(-EE, IT, SI, RO) EU24(-EE, IT, RO) Note: The data for France exclude the overseas departments 108
119 Graph Context 11 - Biodiversity: Protected Forest (% FOWL protected by MCPFE classes of protection- MCPFE 2003) BE CZ DK DE EE EL ES FR IE IT CY LV LT LU HU MT NL AT PL PT SI SK FI SE UK BG RO EU25 EU15 NMS10 EU27 Note: the EU aggregate represent the available data MCPFE class 1.1 MCPFE class 1.2 MCPFE class 1.3 MCPFE class 2 109
120 Table Indicator Measurement Source Context 12 - Development of Forest Area Average annual increase of forest and other FRA 2005 TBFRA 2000 for CY, LU, MT Year (see fiche for CY, LU, MT) Unit 1000 ha. / year Country Belgium 0.0 Czech Republic 2.2 Denmark 2.8 Germany 0.0 Forest only Estonia 5.8 Greece 1.4 Spain France 19.4 Ireland 12.0 Italy Cyprus 0.0 TBFRA 2000 Latvia 10.2 Lithuania 14.6 Luxembourg 0.0 TBFRA 2000 Hungary 13.8 Malta 0.0 TBFRA 2000 Netherlands 1.0 Austria 5.0 Poland 26.6 Forest only Portugal 40.0 Slovenia 5.0 Slovakia 1.6 Forest only Finland -0.6 Sweden 13.0 United Kingdom 10.4 Bulgaria 34.4 Romania 5.6 EU EU NMS EU Note: The data for France do not include the overseas departments 110
121 Context Context 12 - Development of Forest Area (average annual increase of FOWL ha/year between 2000 & FRA 2005) BE CZ DK DE EE EL ES FR IE IT CY LV LT LU HU MT NL AT PL PT SI SK FI SE UK BG RO EU25 EU15 NMS10 EU27 Notes: - Forest only for DE, PL, SK - Source: TBFRA 2000 for CY, LU, MT 111
122 Table Indicator Measurement Source Context 13 - Forest Ecosystem Health % of trees in defoliation classes 2-4 ICP 2005 Year for EL, 2000 for LU Unit % of sampled trees Subdivisions Country Belgium trees (all species) 19.4 conifers 15.6 broadleaved 21.3 Czech Republic Denmark Germany Estonia Greece Spain France Ireland n.a. Italy Cyprus n.a. Latvia Lithuania Luxembourg Hungary Malta n.a. n.a. n.a. Netherlands Austria Poland Portugal Slovenia Slovakia Finland Sweden United Kingdom Bulgaria Romania EU G2 - EU 22 (-EL, LU, MT) 22.8 G2 - EU 22 (-EL, LU, MT) 25.5 G2 - EU 20 (-EL, IE, CY, LU, MT) EU G2 - EU 13 (-EL, LU) 17.5 G2 - EU 13 (-EL, LU) 27.5 G2 - EU 12 (-EL, IE, LU) NMS G2 - NMS 9 (-MT) 29.6 G2 - NMS 9 (-MT) 23.6 G2 - NMS 8 (-CY, MT) EU G2 - EU 24 (-EL, LU, MT) 20.3 G2 - EU 24 (-EL, LU, MT) 19.2 G2 - EU22 (-EL, CY, U, MT) Note: The data for France do not include the overseas departments 112
123 Graph Context 13 - Forest Ecosystem Health (% of trees in defoliation classes ) BE CZ DK DE EE EL ES FR IE IT CY LV LT LU HU MT NL AT PL PT SI SK FI SE UK BG RO EU25 EU15 NMS10 EU27 All species Conifers Broadleaved Notes: - No data available for MT; IE & FR broadleaved data for EL; 2000 data for LU - The European aggregates correspond to the available data for
124 Table Table Table Table Table Indicator Context 14 - Water Quality Objective 20 - Water Quality: Gross Nutrient Balances Objective 21 - Water Quality: Pollution by Nitrates and Pesticides Context 15 - Water Use Sub-indicator Surplus of Nitrogen Surplus of Phosphorus Measurement % territory designated as Nitrate Vulnerable Zone Surplus of Nitrogen Surplus of Phosphorus Trends in the concentrations of nitrate in surface waters % irrigated 'UAA' Source Year DG ENV OECD OECD European Environment Environmental indicators for Environmental indicators for agriculture Vol.4 agriculture Vol " " Eurostat (Farm Structure Survey) 2003 Unit % kg/ha kg/ha mg/l, =100 % Country Belgium n.a n.a. 0.1 Czech Republic n.a Denmark - * Germany - * n.a. Estonia n.a. n.a. n.a n.a. Greece n.a n.a Spain n.a n.a France n.a Ireland - * 81 7 n.a. 0.0 Italy n.a n.a Cyprus n.a. n.a. n.a. n.a Latvia n.a. n.a. n.a Lithuania - * n.a. n.a n.a. Luxembourg - * Hungary n.a. 43 n.a Malta - * n.a. n.a. n.a Netherlands - * UAA including kitchen gardens Austria - * Poland n.a Portugal n.a n.a. 6.7 Slovenia - * n.a. n.a. n.a. 0.4 Slovakia n.a Finland - * Sweden n.a UAA including kitchen gardens United Kingdom n.a Bulgaria n.a n.a. n.a Romania n.a. n.a. n.a. n.a. 2.9 EU25 n.a. n.a. n.a. n.a. 7.2 EU-22: DE; EE; LT excluded EU15 n.a n.a. 8.6 EU-14: DE excluded NMS10 n.a. n.a. n.a NMS 8: EE & LT excluded EU27 n.a. n.a. n.a. n.a. 6.7 EU-24: DE, EE & LT exluded Notes: - *: signals the Countries implementing of an Action Programme on their whole territory (Art. 3.5 of the Directives), and consequently not designing specific Nitrate Vulnerable Zones (which explains the "-": not relevant sign). - The data for France and therefore the European aggregates include the overseas departments only for the indicator C15 - Water use. 114
125 Graph Objective 20 - Water Quality: Gross Nutrient Balances (Surplus of nutrient in kg/ha - OECD ) BE CZ DK DE EE EL ES FR IE IT CY LV LT LU HU MT Surplus of Nitrogen NL AT PL PT SI SK Surplus of Phosphorus FI SE UK BG RO EU25 EU15 NMS10 EU27 Note: no data available for EE, CY, LV, LT, MT, SI, BG, RO & the corresponding aggregates. 115
126 Graph (1) 120 Objective 21 - Water Quality: Pollution by Nitrates and Pesticides Trends of concentration of Nitrates in rivers (3-year moving average, = 100) (1) year moving average CZ DK DE EE FR LV LT LU HU EU-27 Graph (2) 120 Objective 21 - Water Quality: Pollution by Nitrates and Pesticides Trends of concentration of Nitrates in rivers (3-year moving average, = 100) (2) year moving average NL AT PL SK FI SE UK BG EU-27 Note: no data available for BE, EL, ES, IE, IT, CY, MT, PT, SI, RO, EU-25, EU-15 & NMS10 aggregates 116

127 Map
128 Indicator Measurement Source Year Unit Table Table Table Context 16 - Protective Forests concerning primarily Soil & Water % FOWL area managed primarily for soil & water protection MCPFE /2002 Objective 22 - Soil: Areas at Risk of Soil Erosion Areas at risk of soil erosion (estimate of soil loss due to water) JRC Objective 23 - Soil: Organic Farming Utilised Agricultural Area under organic farming Institute of Rural Studies, University of Wales, Aberystwyth Copyright: Nicolas Lampkin % Ton/ha/year Thousands ha (Objective 23) - Soil: Organic Farming Share of Utilised Agricultural Area under organic farming Institute of Rural Studies, University of Wales, Aberystwyth Copyright: Nicolas Lampkin 2003 % Country Belgium n.a e 1.7 e Czech Republic e 7.0 e Denmark e 6.2 e Germany 22.6 Forest e 4.3 e Estonia n.a e 5.4 e Greece e 6.2 e Spain e 2.9 e France e 2.0 e Ireland e 0.7 e Italy n.a e 8.0 e Cyprus 40.6 n.a. 0.2 e 0.1 e Latvia 2.2 Forest e 1.6 e Lithuania e 0.9 e Luxembourg e 2.3 e Hungary e 2.6 e Malta 0.0 n.a. 0.0 e 0.0 e Netherlands e 2.0 e Austria 19.7 Forest e 10.1 e Poland e 0.3 e Portugal e 3.2 e Slovenia e 4.3 e Slovakia 12.9 Forest e 2.5 e Finland 0.0 n.a e 7.1 e Sweden 11.1 n.a e 13.0 e United Kingdom e 4.3 e Bulgaria e 0.1 e Romania n.a e 0.3 e EU EU22 (excl. BE,EE,IT) e 3.8 e EU EU13 (excl.be,it) e 4.2 e NMS NMS9 (excl. EE) e 2.0 e EU EU23 (excl.be, EE, IT, RO) e 3.4 e Note: the data for France and therefore the European aggregates include the overseas departments for organic farming only. 118
129 Graph % Context 16 - Protective Forest concerning primarily Soil & Water (% FOWL area managed primarily for soil & water protection - MCPFE 2003) BE CZ DK DE EE EL ES FR IE IT CY LV LT LU HU MT NL AT PL PT SI SK FI SE UK BG RO EU25 EU15 NMS10 EU27 Note: no data for BE, EE, IT, RO 119
130 Map

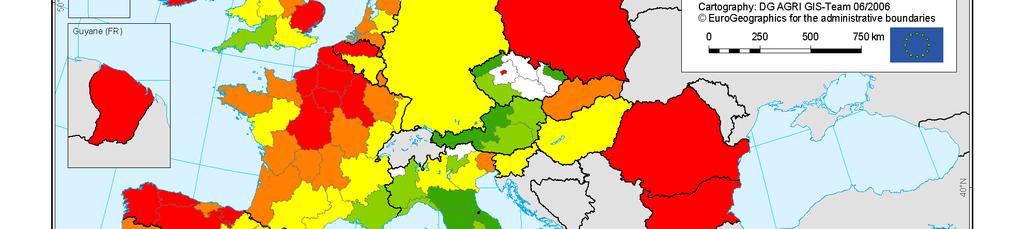
131 Map
132 Table i Table i Table i Table i Indicator Objective 24 - Climate change: Production of renewable energy from agriculture and forestry Objective 25 - Climate Change: UAA devoted to Renewable Energy Objective 26 - Climate Change: GHG Emissions from Agriculture Sub-indicator Measurement Source Year Production of renewable energy from agriculture Production of renewable energy from forestry Production of renewable energy from agriculture Production of renewable energy from forestry UAA devoted to energy and biomass crops Agricultural emissions of greenhouse gases EurObserER Eurostat DG AGRI Eurostat Energy Statistics Unit ktoe ktoe NB: including 87.0 ktons i.e ktoe from intervention stocks (Wood and wood wastes) 1000 ha NB: data for MS do not include UAA without specific regime devoted to energy crops 1000 t of CO 2 equivalent Country Belgium Czech Republic n.a Denmark Germany Estonia n.a Greece n.a Spain France Ireland Italy Cyprus n.a Latvia n.a Lithuania n.a Luxembourg Hungary n.a Malta 0.0 n.a. n.a Netherlands Austria Poland n.a Portugal Slovenia Slovakia n.a Finland Sweden United Kingdom Bulgaria n.a Romania n.a EU EU15 n.a n.a NMS10 n.a n.a G2 EU G2 Table ii Table ii Table ii Table ii Indicator (Objective 24) - Climate change: Production of renewable energy from agriculture and forestry (Objective 25) - Climate Change: UAA devoted to Renewable Energy (Objective 26) - Climate Change: GHG Emissions from Agriculture Sub-indicator Measurement Source Production of renewable energy from agriculture Share of agriculture in production of renewable energy EurObserER Production of renewable energy from forestry Share of forestry in production of renewable energy Eurostat Share of UAA devoted to energy and biomass crops DG AGRI Share of agriculture in emissions of greenhouse gases Eurostat & Eurostat - Energy Statistics Energy Statistics Year Unit % % Country Belgium Czech Republic n.a Denmark Germany Estonia n.a Greece n.a Spain France Ireland Italy Cyprus n.a Latvia n.a Lithuania n.a Luxembourg Hungary n.a Malta 0.00 n.a. n.a Netherlands Austria Poland n.a Portugal Slovenia Slovakia n.a Finland Sweden United Kingdom Bulgaria n.a Romania n.a EU EU15 n.a n.a NMS10 n.a n.a G2 EU G2 122 % NB: data for MS do not include UAA without specific regime devoted to energy crops %
133 Graph Objective 24 - Climate Change: Production of Renewable Energy from Agriculture (2004) 2500 ktoe % production of renewable energy BE CZ DK DE EE EL ES FR IE IT CY LV LT LU HU MT NL AT PL PT SI SK FI SE UK BG RO EU25 EU15 NMS10 EU27 Production of renewable energy from agriculture Share of agriculture in production of renewable energy Notes: - No data available for the aggregates EU15 & NMS10 - The EU-25 & EU-27 aggregates include 87.0 ktons ie 60.8 ktoe from intervention stocks Graph ktoe Objective 24 - Production of Renewable Energy from Forestry (Wood and Wood Wastes ) % production of renewable energy BE CZ DK DE EE EL ES FR IE IT CY LV LT LU HU MT NL AT PL PT SI SK FI SE UK BG RO EU25 EU15 NMS10 EU27 Production of renewable energy from forestry Share of forestry in production of renewable energy 123
134 Graph ha Objective 25 - Climate Change: UAA devoted to Renewable Energy (2004) % UAA BE CZ DK DE EE EL ES FR IE IT CY LV LT LU HU MT NL AT PL PT SI SK FI SE UK BG RO EU25 EU15 NMS10 EU27 UAA devoted to energy and biomass crops Share of UAA devoted to energy and biomass crops Notes: - No data available for NMS and Accession Countries - Data for MS do not include UAA without specific regime devoted to energy crops 124
135 Graph Objective 26 - Climate Change: GHG Emissions from Agriculture (2003) 1000t of CO2 equivalent % of total GHG emissions BE CZ DK DE EE EL ES FR IE IT CY LV LT LU HU MT NL AT PL PT SI SK FI SE UK BG RO EU25 EU15 NMS10 Agricultural emissions of GHG Share of agriculture in emissions of GHG 125
136 126
137 SECTION 3.5 DIVERSIFICATION AND QUALITY OF LIFE IN RURAL AREAS 127
138 Table a Objective 27 - Farmers with Other Gainful Activities % holders with other gainful activities FSS District level Country (1)PR (2)IR (3)PU MS value Belgium Czech Republic Denmark Germany Estonia Greece Spain n.a. n.a. n.a France Ireland Italy IT: missing data mainly in 28.3 Cyprus 55.5 PU districts 55.5 Latvia Lithuania Luxembourg Hungary Malta Netherlands Austria Poland Portugal Slovenia n.a. n.a. n.a Slovakia Finland Sweden United Kingdom Bulgaria Romania EU excl. ES, SI 31.2 EU excl. ES 30.4 NMS excl. SI 32.3 EU excl. ES, SI 27.4 Note: The total for France and therefore the European aggregates include the overseas departments Table b Objective 27 - Farmers with Other Gainful Activities % holders with other gainful activities FSS Region level Country (1)PR (2)IR (3)PU MS value Belgium Czech Republic Denmark Germany Estonia Greece Spain France Ireland Italy Cyprus Latvia Lithuania Luxembourg Hungary Malta Netherlands Austria Poland Portugal Slovenia Slovakia Finland Sweden United Kingdom Bulgaria Romania EU EU NMS EU Note: The total for France and therefore the European aggregates include the overseas departments 128
139 Map
140 Table a (Objective 28) - Employment Development of the Non-Agricultural Sector Share of employment in secondary and tertiary sectors (% total Employment) NUTS 3 MS employment development Country (1) PR (2) IR (3) PU of the non-agricultural sector (1000 p.) Belgium Czech Republic Denmark Germany Estonia Greece p Spain France Ireland Italy Cyprus Latvia Lithuania Luxembourg Hungary Malta Netherlands n.a. n.a. n.a. n.a LFS Austria Poland Portugal Slovenia Slovakia Finland Sweden United Kingdom Bulgaria Romania n.a. n.a. n.a. n.a LFS EU excl. NL EU excl. NL NMS EU excl. NL, RO Table b (Objective 28) - Employment Development of the Non-Agricultural Sector Share of employment in secondary and tertiary sectors (% total Employment) NUTS 2 Country (1) PR (2) IR (3) PU MS - Summary of available data Note: The total for France and therefore the European aggregates include the overseas departments MS - Summary of available data Belgium Czech Republic Denmark Germany Estonia Greece p Spain France Ireland Italy Cyprus Latvia Lithuania Luxembourg Hungary Malta Netherlands LFS LFS Austria Poland Portugal Slovenia Slovakia Finland Sweden United Kingdom Bulgaria Romania LFS LFS EU EU NMS EU Note: The total for France and therefore the European aggregates include the overseas departments 130 MS employment development of the non-agricultural sector (1000 p)

141 Map
142 Table a (Objective 29) - Economic Development of the Non-Agricultural Sector Share of GVA in secondary and tertiary sectors (% total GVA) NUTS 3 Country (1) PR (2) IR (3) PU 132 MS economic development of non agricultural sector (Mio Euro) Belgium Czech Republic Denmark Germany Estonia Greece Spain France Ireland Italy Cyprus Latvia Lithuania Luxembourg Hungary Malta Netherlands Austria Poland Portugal Slovenia Slovakia Finland Sweden United Kingdom Bulgaria Romania EU EU NMS EU Notes: -The total for France and therefore the European aggregates include the overseas departments -These data do not take into account the activity in extra-regions (zzz). Table b (Objective 29) - Economic Development of the Non-Agricultural Sector Share of GVA in secondary and tertiary sectors (% total GVA) NUTS 2 Country (1) PR (2) IR (3) PU MS summary of available data MS summary of available data MS economic development of non agricultural sector (Mio Euro) Belgium Czech Republic Denmark Germany Estonia Greece Spain France Ireland Italy Cyprus Latvia Lithuania Luxembourg Hungary Malta Netherlands Austria Poland Portugal Slovenia Slovakia Finland Sweden United Kingdom Bulgaria Romania EU EU NMS EU Notes: -The total for France and therefore the European aggregates include the overseas departments -These data do not take into account the activity in extra-regions (zzz).
143 Map
144 Table i Objective 30 - Self-Employment Development % of Self-employed persons in the different types of areas NUTS 2 Country % PR % IR % PU MS value p. Belgium Czech Republic Denmark Germany Estonia Greece Spain France Ireland Italy Cyprus Latvia Lithuania Luxembourg Hungary Malta Netherlands Austria Poland Portugal Slovenia Slovakia Finland excl FI20 (PR) Sweden United Kingdom Bulgaria Romania EU EU NMS EU Note: At regional level, the total for France and therefore the European aggregates include the overseas departments, whereas they are not included at national level Table ii (Objective 30) - Self-Employment Development Share of self-employment in total employment NUTS 2 Country (1) PR (2) IR (3) PU MS value Belgium Czech Republic Denmark Germany Estonia Greece Spain France Ireland Italy Cyprus Latvia Lithuania Luxembourg Hungary Malta Netherlands Austria Poland Portugal Slovenia Slovakia Finland 12.2 excl FI20 (PR) 12.3 Sweden United Kingdom Bulgaria Romania EU EU NMS EU Note: At regional level, the total for France and therefore the European aggregates include the overseas departments, whereas they are not included at national level 134
145 Map
146 Table a Objective 31 - Tourism Infrastructure in Rural Areas Total number of bedplaces (in hotels, campings, holiday dwellings, etc.) NUTS 3 Country % PR % IR % PU MS value Belgium Czech Republic Denmark missing data mainly in Germany PU regions Estonia Greece Spain France Ireland Italy Cyprus Latvia Lithuania Luxembourg Hungary Malta Netherlands Austria Poland p Portugal Slovenia Slovakia Finland e Sweden United Kingdom Bulgaria Romania EU EU NMS EU (RO: 2001) (RO: 2001) Note: The total for France and therefore the European aggregates include the overseas departments Table b Objective 31 - Tourism Infrastructure in Rural Areas Total number of bedplaces (in hotels, campings, holiday dwellings, etc.) NUTS 2 Country % PR % IR % PU MS value Belgium Czech Republic Denmark Germany Estonia Greece Spain France Ireland Italy Cyprus Latvia Lithuania Luxembourg Hungary Malta Netherlands Austria Poland p Portugal Slovenia Slovakia Finland e Sweden United Kingdom Bulgaria Romania EU EU NMS EU (RO: 2001) (RO: 2001) Note: The total for France and therefore the European aggregates include the overseas departments 136

147 Map
148 Table Table Indicator Measurement Source Year Context 23 - Internet Infrastructure DSL coverage DG-INFSO Idate (consultant) 12/2004 Objective 32-Internet Take-Up in Rural Areas % population having subscribed to DSL internet DG INFSO Idate (consultant) 12/2004 Unit % % Subdivisions Rural Suburban Urban National Rural Suburban Urban National Country Belgium Czech Republic n.a. n.a. n.a. n.a. n.a n.a n.a n.a Denmark Germany Estonia n.a. n.a. n.a. n.a Greece n.a n.a n.a n.a Spain France Ireland Italy Cyprus n.a. n.a. n.a. n.a. n.a n.a n.a n.a Latvia n.a. n.a. n.a. n.a. n.a n.a n.a n.a Lithuania n.a. n.a. n.a. n.a. n.a n.a n.a n.a Luxembourg Hungary n.a. n.a. n.a. n.a. n.a n.a n.a n.a Malta n.a. n.a. n.a. n.a. n.a n.a n.a n.a Netherlands Austria Poland n.a. n.a. n.a. n.a. n.a n.a n.a n.a Portugal Slovenia n.a. n.a. n.a. n.a. n.a n.a n.a n.a Slovakia n.a. n.a. n.a. n.a. n.a n.a n.a n.a Finland Sweden United Kingdom Bulgaria n.a. n.a. n.a. n.a. n.a n.a n.a n.a Romania n.a. n.a. n.a. n.a. n.a n.a n.a n.a EU25 n.a. n.a. n.a. n.a. n.a n.a n.a n.a EU NMS10 n.a. n.a. n.a. n.a. n.a. n.a. n.a. n.a. EU27 n.a. n.a. n.a. n.a. n.a. n.a. n.a. n.a. 138
149 Graph Context 23 - Internet Infrastructure (DSL coverage - % population - December 2004) Notes: - no data for NMS, candidate countries & the corresponding aggregates - delimitation of areas different of the OECD definition : - rural: <100 hab./km2 - suburban: 100 to 500 hab./km2 - urban: >500 hab./km2 Graph Objective 32 - Internet Take-Up (% population having subscribed to DSL internet - December 2004) BE CZ DK DE EE EL ES FR IE IT CY LV LT LU HU MT NL AT PL PT SI SK FI SE UK BG RO EU25 EU15 NMS10 EU27 BE CZ DK DE EE EL ES FR IE IT CY LV LT LU HU MT NL AT PL PT SI SK FI SE UK BG RO EU25 EU15 NMS10 EU27 Rural Suburban Urban National Rural Suburban Urban National Notes: - no data for NMS, candidate countries & the corresponding aggregates - delimitation of areas different of the OECD definition : - rural: <100 hab./km2 - suburban: 100 to 500 hab./km2 - urban: >500 hab./km2 139
150 Table a Objective 33 - Development of Services Sector % of GVA in services NUTS 3 Country (1) PR (2) IR (3) PU MS value Belgium Czech Republic Denmark Germany Estonia Greece Spain France Ireland Italy Cyprus Latvia Lithuania Luxembourg Hungary Malta Netherlands Austria Poland Portugal Slovenia Slovakia Finland Sweden United Kingdom Bulgaria Romania EU EU NMS EU Notes: -The total for France and therefore the European aggregates include the overseas departments -These data do not take into account the activity in extra-regions (zzz). Table b Objective 33 - Development of Services Sector % of GVA in services NUTS 2 Country (1) PR (2) IR (3) PU MS value Belgium Czech Republic Denmark Germany Estonia Greece Spain France Ireland Italy Cyprus Latvia Lithuania Luxembourg Hungary Malta Netherlands Austria Poland Portugal Slovenia Slovakia Finland Sweden United Kingdom Bulgaria Romania EU EU NMS EU Notes: -The total for France and therefore the European aggregates include the overseas departments -These data do not take into account the activity in extra-regions (zzz). 140

151 Map
152 Table Objective 34 - Net Migration Rate Net migration crude rate per NUTS 2 Country (1) PR (2) IR (3) PU MS -summary of available MS value data (2003) Belgium Czech Republic Denmark Germany Estonia Greece Spain e France e Ireland e Italy Cyprus Latvia Lithuania Luxembourg Hungary Malta Netherlands Austria Poland Portugal p Slovenia Slovakia Finland Sweden United Kingdom e Bulgaria Romania EU excl. EE, CY, LU, MT 4.3 e EU excl. LU 5.0 e NMS excl. EE, CY, MT n.a. EU excl. EE, CY, LU, MT n.a. Note: The total for France and therefore the European aggregates include the overseas departments 142

153 Map
154 Table Context 22 - Educational Attainment % of adults with Medium & High educational attainment NUTS 2 Country (1) PR (2) IR (3) PU MS value Belgium Czech Republic Denmark Germany Estonia Greece Spain France Ireland Italy Cyprus Latvia Lithuania Luxembourg Hungary Malta Netherlands Austria Poland Portugal Slovenia Slovakia Finland Sweden United Kingdom Bulgaria Romania EU EU NMS EU Note: The total for France and therefore the European aggregates do not include the overseas departments 144

155 Map
CAP CONTEXT INDICATORS
 CAP CONTEXT INDICATORS 2014-2020 33. FARMING INTENSITY 2017 update CONTEXT INDICATOR 33: FARMING INTENSITY Intensification is an important restructuring process that has characterised European agriculture
PATTERNS OF THE AGRICULTURAL INCOME AND IMPACT OF STRUCTURAL CHANGES POST-ENLARGEMENT AMONG EU STATES
 CES Working Papers Volume VII, Issue 2A PATTERNS OF THE AGRICULTURAL INCOME AND IMPACT OF STRUCTURAL CHANGES POST-ENLARGEMENT AMONG EU STATES Mirela-Adriana RUSALI * Abstract: The article presents the
REVIEW OF ECONOMIC GROWTH FACTORS OF RURAL AREAS IN THE EUROPEAN UNION
 244 REVIEW OF ECONOMIC GROWTH FACTORS OF RURAL AREAS IN THE EUROPEAN UNION Mirela Adriana Rusali PhD, Scientific Researcher II, Institute of Agricultural Economics The Romanian Academy Abstract: Growth
E U R O P E A N U N I O N
 May 2018 Statistical Factsheet E U R O P E A N U N I O N CONTENTS Key figures EU-28 1. POPULATION & ECONOMY 2. FINANCIAL ASPECTS 3. ECONOMIC ACCOUNTS 4. AGRICULTURAL TRADE 5. FARM STRUCTURE 1 2-5 6-8 9-16
Farm structures. This document does not necessarily represent the official views of the European Commission
 Farm structures Content 1. EU farms - characteristics and trends... 3 Physical farm size... 4 Economic farm size... 8 Declining farm numbers... 11 Organisational structure... 13 Land ownership... 14 Farm
CAP CONTEXT INDICATORS
 CAP CONTEXT INDICATORS 2014-2020 44. ENERGY USE IN AGRICULTURE, FORESTRY AND THE FOOD INDUSTRY 2017 update BE BG CZ DK DE EE IE EL ES FR HR IT CY LV LT LU HU MT NL AT PL PT RO SI SK FI SE UK CONTEXT INDICATOR
CAP CONTEXT INDICATORS
 CAP CONTEXT INDICATORS 2014-2020 40. WATER QUALITY 2017 update CONTEXT INDICATOR 40: WATER QUALITY Water quality is assessed through the Gross Nutrient Balance and nitrates in freshwater The nitrogen surplus
CAP CONTEXT INDICATORS
 CAP CONTEXT INDICATORS 2014-2020 24. AGRICULTURAL TRAINING OF FARM MANAGERS 2017 update CONTEXT INDICATOR 24: AGRICULTURAL TRAINING OF FARM MANAGERS Learning by doing is still the main form of for the
State of play of CAP measure Agri-environment payments in the European Union
 State of play of CAP measure Agri-environment payments in the European Union Alexandros Papakonstantinou EN RD Contact Point CEDIA Seminar 1 st October 2010 THE ROLE OF RURAL DEVELOPMENT POLICY IN DELIVERING
EU Rural Development Policy: Architecture and Implementation
 EU Rural Development Policy: Architecture and Implementation Josefine Loriz-Hoffmann DG AGRI G.1 Consistency of Rural Development, European Commission Conference Introduction to EU regional and sectoral
Farm Economics brief
 Farm Economics brief N 2 EU production costs overview July 211 Contents The effect of the economic crisis on costs and margins Operating costs in the EU groups Highly contrasted costs among the Member
Reforming, or transforming, Common Agricultural Policy?
 Reforming, or transforming, Common Agricultural Policy? EURAGRI Conference, Vienna, Austria 1 October, 2012 Marcus Carson, PhD Senior Research Fellow, SEI Associate Professor of Sociology, Stockholm University
Environmental impact assessment of CAP greening measures using CAPRI model
 Environmental impact assessment of CAP greening measures using CAPRI model JM Terres, C. Bulgheroni, A. Leip, ML Paracchini 19 th MARS conference Vilnius Plenary session: Environmental aspects of the CAP
Flash Eurobarometer 426. SMEs, Resource Efficiency and Green Markets
 SMEs, Resource Efficiency and Green Markets Fieldwork Publication December 2015 Survey requested by the European Commission, Directorate-General for Internal Market, Industry, Entrepreneurship and SMEs
Guidance note G Baseline indicators fiches
 Guidance note G Baseline s fiches This guidance note presents the "fiches" of common baseline s. The purpose of the fiches is to provide information concerning: the measurement of the and of the sub-s
ATTITUDES TOWARDS BIODIVERSITY
 Eurobarometer ATTITUDES TOWARDS BIODIVERSITY REPORT Fieldwork: June 2013 Publication: November 2013 This survey has been requested by the European Commission, Directorate-General for Environment and co-ordinated
Brief on agricultural biomass production 1
 Brief on agricultural biomass production 1 Key messages 1. The total annual agricultural biomass production in the European Union is estimated at 956 million tonnes (Mt) per year. 54% are primary products
COMMISSION STAFF WORKING DOCUMENT Accompanying the document
 EUROPEAN COMMISSION Brussels, 14.12.2017 SWD(2017) 445 final PART 2/2 COMMISSION STAFF WORKING DOCUMENT Accompanying the document REPORT FROM THE COMMISSION TO THE EUROPEAN PARLIAMENT, THE COUNCIL, THE
EUROPEAN POLICIES TO PROMOTE ENERGY CROPS
 EUROPEAN POLICIES TO PROMOTE ENERGY CROPS Hilkka Summa European Commission DG Agriculture and Rural Development Outline 1) EU policy for renewable energy 2) Energy crops production and land use 3) The
EU agricultural income 2014 first estimates
 EU Agricultural and Farm Economics Briefs No 3 December 2014 EU agricultural income 2014 first estimates Contents 1. EU-28 agricultural income down by 1.7% 2. Crop output value most affected in 2014 3.
EU Agricultural Economic Briefs
 EU Agricultural Economic Briefs Structural development in EU agriculture Brief N 3 September 2011 While structural development in agriculture is typically described as a change in the number and size of
Fact Sheet. O v e r v i e w o f t h e C A P H e a l t h C h e c k and the European Economic Recovery Plan Modification of the RDPs
 Fact Sheet European Commission Agriculture and Rural Development O v e r v i e w o f t h e C A P H e a l t h C h e c k and the European Economic Recovery Plan Modification of the RDPs Some facts and figures
ION RALUCA, ANDREEA NOVAC CORNELIA, MIHAELA NOVAC OVIDIU, CONSTANTIN
 ACTA CAROLUS ROBERTUS 4 (2) Summary ROMANIAN AGRICULTURE ANALYSIS OF VEGETAL SECTOR ION RALUCA, ANDREEA NOVAC CORNELIA, MIHAELA NOVAC OVIDIU, CONSTANTIN The paper analyzes the main changes and trends in
Pig farming in the European Union: considerable variations from one Member State to another
 Agriculture and fisheries Statistics in focus 15/2014 Author: Pol Marquer, Teresa Rabade, Roberta Forti ISSN: 2314-9647 Catalogue number: KS-SF-14-015-EN-N Pig farming in the European Union: considerable
CHAPTER 2. ANALYTICAL HIGHLIGHTS 2013
 CHAPTER 2. ANALYTICAL HIGHLIGHTS 213 In this chapter, data from the agricultural census 21 are used to provide an update on farm structures in the EU. Particular attention is given to changes in farm numbers,
SITUATION AND PROSPECTS FOR EU AGRICULTURE AND RURAL AREAS
 SITUATION AND PROSPECTS FOR EU AGRICULTURE AND RURAL AREAS December 2010 For more information: EUROPEAN COMMISSION DIRECTORATE-GENERAL FOR AGRICULTURE AND RURAL DEVELOPMENT Directorate L. Economic analysis,
CAP CONTEXT INDICATORS
 CAP CONTEXT INDICATORS 2014-2020 45. EMISSIONS FROM AGRICULTURE 2017 update CONTEXT INDICATOR 45: EMISSIONS FROM AGRICULTURE 1. GHG emissions from agriculture GHG emissions from agriculture represent 9.8%
PROSPECTS FOR THE AGRICULTURAL INCOME IN ROMANIA
 PROSPECTS FOR THE AGRICULTURAL INCOME IN ROMANIA Dachin Anca Academia de Studii Economice, Facultatea de Economie, Bucure ti, Pia a Roman nr. 6, e-mail: ancadachin@yahoo.com Abstract: The accession to
General socio-economic situation in rural areas in Niedersachsen and Bremen
 Rural Development Programme (RDP) of Niedersachsen & Bremen PROFIL 2007-2013. Programm zur Förderung im ländlichen Raum Niedersachsen und Bremen 2007 bis 2013 To be inserted 1 (PROFIL 2007-2013. Rural
Attitudes of Europeans towards resource efficiency. Analytical report
 Flash Eurobarometer 316 The Gallup Organization Flash Eurobarometer European Commission Attitudes of Europeans towards resource efficiency Analytical report Fieldwork: January 2011 Publication: March 2011
EVOLUTION OF SOCIAL AND ECONOMIC SITUATION IN POLISH AGRICULTURE SINCE THE ACCESSION TO THE EUROPEAN UNION
 EVOLUTION OF SOCIAL AND ECONOMIC SITUATION IN POLISH AGRICULTURE SINCE THE ACCESSION TO THE EUROPEAN UNION Jakub Piecuch 1, PhD Institute of Economic and Social Sciences, Agriculture University in Krakow
EU FARM ECONOMICS OVERVIEW
 EU FARM ECONOMICS OVERVIEW FADN 2007 1 EUROPEAN COMMISSION DIRECTORATE-GENERAL FOR AGRICULTURE AND RURAL DEVELOPMENT Directorate L. Economic analysis, perspectives and evaluations L.3. Microeconomic analysis
Farm Economics brief
 Farm Economics brief N 1 Income developments in EU farms June 211 Contents The economic crisis disrupted the increasing trend in farm income Differences in income situation among Member states, regions,
COMMISSION STAFF WORKING DOCUMENT. Review of greening after one year
 EUROPEAN COMMISSION Brussels, 22.6.2016 SWD(2016) 218 final PART 3/6 COMMISSION STAFF WORKING DOCUMENT Review of greening after one year EN EN Annex 2 Initial results of the implementation of green direct
The European Commission s science and knowledge service. Scene-setter on jobs and growth in EU agri-food sector. Joint Research Centre
 The European Commission s science and knowledge service Joint Research Centre Scene-setter on jobs and growth in EU agri-food sector Emanuele Ferrari Alfredo J. Mainar Causapé With contributions from T.
Relating to the transnational hiring-out of workers in the framework of the provision of services
 FORM FOR USE (OPTIONAL) BY THE REQUESTING ADMINISTRATION I. REQUEST FOR INFORMATION Relating to the transnational hiring-out of workers in the framework of the provision of services Pursuant to Article
The EU Renewable Energy Framework for Biogas. Giulio Volpi Renewable Energy and CCS Unit DG Energy, European Commission
 The EU Renewable Energy Framework for Biogas Giulio Volpi Renewable Energy and CCS Unit DG Energy, European Commission The 20-20-20 EU policy, by 2020-20% -20% 100% 20% Greenhouse gas levels Energy consumption
Wawrzyniec Czubak
 Faculty of Economic and Social Sciences Department of Economy and Economic Policy in Agribusiness Evolution of the performance framework in the Common Agriculture Policy Wawrzyniec Czubak czubak@up.poznan.pl
General socio-economic situation in rural areas in Mecklenburg-Western Pomerania
 Rural Development Programme (RDP) of Mecklenburg-Western Pomerania, Germany Entwicklungsprogramm für den ländlichen Raum Mecklenburg-Vorpommern 2007 bis 2013 1 (Rural Development Programme of Mecklenburg-Western
University of National and World Economy
 University of National and World Economy www.unwe.bg University of National and World Economy established in 1920; the oldest and the largest economic university in Southeastern Europe; More than 20 thousand
General socio-economic situation in rural areas in Slovenia
 Rural Development Programme (RDP) of Slovenia Program razvoja podeželja (PRP 2007-2013) 18.2.2007 1 (Rural Development Programme RDP 2007-2013) Relevant Contact Details Managing Authority Website: http://www.mkgp.gov.si/
The EU common agricultural policy (CAP) 2014 to 2020: What is the situation - potentials and threats for the European Green Belt
 2014 to 2020: What is the situation - potentials and threats for the European Green Belt") The EU common agricultural policy (CAP) 2014 to 2020: What is the situation - potentials and threats for the European Green Belt Rainer Luick HFR / University of Applied Sciences Rottenburg / Germany International
The EU common agricultural policy (CAP) 2014 to 2020: What is the situation - potentials and threats for the European Green Belt Rainer Luick HFR / University of Applied Sciences Rottenburg / Germany International
General socio-economic situation in rural areas in Lithuania
 Rural Development Programme (RDP) of Lithuania Kaimo plėtros 2007 2013 metų programa Rural Development Programme for Lithuania 2007-2013) 1 Relevant Contact Details Address: Ministry of Agriculture of
ISSN energy. in figures. Energy
 ISSN 1977-4559 EU energy in figures STATISTICAL POCKETBOOK 2014 Energy EU ENERGY IN FIGURES POCKETBOOK 2014 1 This publication does not involve the European Commission in liability of any kind. Europe
IRENA Indicator Fact Sheet
 Indicator Definition IRENA indicator 07 - Area under organic farming The share of the organic farming area in the total Utilised Agricultural Area (UAA) indicates the area under organic farming. Indicator
Building CSOs Capacity on EU Nature-related Policies EU Rural Development Policy
 Building CSOs Capacity on EU Nature-related Policies EU Rural Development Policy Mark Redman Valjevo, 27 October 2011 Total of 11 different seminatural plant communities can be identified in
energy in figures Energy
 EU energy in figures Statistical pocketbook 2015 Energy This publication does not involve the European Commission in liability of any kind. Europe Direct is a service to help you find answers to your questions
Phosphorus Regulations in Europe
 Phosphorus Regulations in Europe Outcome of an inventory in 27 countries involved in EU COST action 869 WG1 Meeting Hamar, 22 25 May 2007 Oscar Schoumans (NL) Alterra, Wageningen University and Research
General socio-economic situation in rural areas in the Puglia region
 Rural Development Programme (RDP) of Puglia, Italy Programma di sviluppo rurale della Puglia 2007-2013 (May 2010) 1 (Rural Development Programme for Puglia 2007-2013) Relevant Contact Details Address:
Flash Eurobarometer on water. Analytical report
 Flash Eurobarometer 261 The Gallup Organisation Analytical Report Flash EB N o 251 Public attitudes and perceptions in the euro area Flash Eurobarometer European Commission Flash Eurobarometer on water
HNV and results-based payment schemes
 HNV and results-based payment schemes Policy context and recent developments Evelyn Underwood, 12 June, EEA HNV mapping workshop What is meant by HNV in a policy context? 1993 the HNV concept defined by
European Commission. Communication on Support Schemes for electricity from renewable energy sources
 European Commission Communication on Support Schemes for electricity from renewable energy sources External Costs of energy and their internalisation in Europe Beatriz Yordi DG Energy and Transport External
EU Agri-Environmental indicators and the Rural Development CMEF indicators (Common Monitoring and Evaluation Framework): a coherent system of analysis
: a coherent system of analysis") EU Agri-Environmental indicators and the Rural Development CMEF indicators (Common Monitoring and Evaluation Framework): a coherent system of analysis Leysin (Switzerland) OECD Workshop on agri-environmental
EU Agri-Environmental indicators and the Rural Development CMEF indicators (Common Monitoring and Evaluation Framework): a coherent system of analysis Leysin (Switzerland) OECD Workshop on agri-environmental
COMMISSION STAFF WORKING DOCUMENT
 EN EN EN EUROPEAN COMMISSION Brussels, 9.2.2010 SEC(2010) 118 final COMMISSION STAFF WORKING DOCUMENT On implementation of Council Directive 91/676/EEC concerning the protection of waters against pollution
EU Agricultural Economic Briefs
 EU Agricultural Economic Briefs What is a small farm? Brief N 2 July 211 Introduction In recent years small farms have received increased attention in the political debate, recognizing the role they play
The rural development policy : future skills needs in the agrifood
 The rural development policy 2007-2013: future skills needs in the agrifood sector Lisbon. 20 November 2006 Ester Hortet Tarroja. European Commission. DG Agriculture and rural development. Unit F.3 Outline
Study on Employment, Growth and Innovation in Rural Areas (SEGIRA)
") Study on Employment, Growth and Innovation in Rural Areas (SEGIRA) ANNEX - Rural development policy on women and young people Client: European Commission, Directorate-General for Agriculture and Rural
Study on Employment, Growth and Innovation in Rural Areas (SEGIRA) ANNEX - Rural development policy on women and young people Client: European Commission, Directorate-General for Agriculture and Rural
Modernising and simplifying the CAP
 Modernising and simplifying the CAP Summary of the results of the public consultation Client: European Commission - DG AGRI Brussels, 7 July 2017 Table of contents 1 Introduction 9 2 Methodology 11 2.1
EU COMMON AGRICULTURAL POLICY IN RELATION TO THE LANDSCAPE
 19. COUNCIL OF EUROPE MEETING OF THE WORKSHOPS FOR THE IMPLEMENTATION OF THE EUROPEAN LANDSCAPE CONVENTION EU COMMON AGRICULTURAL POLICY IN RELATION TO THE LANDSCAPE Ing. Pavel Sekáč, Deputy Minister for
IRENA Indicator Fact Sheet IRENA 18.1 Gross nitrogen balance
 Indicator definition The gross nitrogen balance estimates the potential surplus of nitrogen on agricultural land (kg/ha). Input indicator links: IRENA 08 - Mineral fertiliser consumption IRENA 13 - Cropping/livestock
Summary Report on Status of implementation of the INSPIRE Based on 2016 Member States Reports
 Summary Report on Status of implementation of the INSPIRE Directive in EU Based on 2016 Member States Reports Introduction... 1 1. State of Play... 3 1.1 Coordination... 3 1.2 Functioning and coordination
General socio-economic situation in rural areas in Luxembourg
 Rural Development Programme (RDP) of Luxembourg Programme de développement rural du G.-D. de Luxembourg (2007-2013 1 (Rural Development Programme 2007-2013: for a long term sustainable rural development)
Core projects and scientific studies as background for the NREAPs. 9th Inter-Parliamentary Meeting on Renewable Energy and Energy Efficiency
 Core projects and scientific studies as background for the NREAPs 9th Inter-Parliamentary Meeting on Renewable Energy and Energy Efficiency Brussels, 18.11.2009 Mario Ragwitz Fraunhofer Institute Systems
The interactions of complementary policies with a GHG cap and trade program: the case of Europe
 The interactions of complementary policies with a GHG cap and trade program: the case of Europe David Harrison, Ph.D. Senior Vice-President Daniel Radov Associate Director EPRI-IETA IETA Joint Symposium
ATTITUDES OF EUROPEANS TOWARDS AIR QUALITY
 Flash Eurobarometer ATTITUDES OF EUROPEANS TOWARDS AIR QUALITY REPORT Fieldwork: September 2012 Publication: January 2013 This survey has been requested by the European Commission, Directorate-General
European Rural Development Policy and Mountain Regions
 European Rural Development Policy and Mountain Regions by Jean-Michel Courades DG Agriculture and Rural Development European Commission Final Conference Euromountain-net Alpine Convention Torino 8 and
Rural Development Programmes
 Axis 2 - Improving the environment and the countryside through land management Axis 1 - Improving the competitiveness of the agricultural and forestry sector State of implementation per measure in Czech
Technology options for feeding 10 billion people. Plant breeding and innovative agriculture. Annexes. Science and Technology Options Assessment
 Technology options for feeding 10 billion people Plant breeding and innovative agriculture Annexes Science and Technology Options Assessment Technology options for feeding 10 billion people Plant breeding
Making the Parcel Regulation work. 17th Königswinter Postal Seminar 5-7 February
 Making the Parcel Regulation work 17th Königswinter Postal Seminar 5-7 February 2018 1 A lot going on. 2 Not just a parcel More A journey 3 AT DE DK FI FR IE LU NL SE CY EL ES IT MT PT BG HR HU
Radioactive waste. Fieldwork : February- March 2005 Publication : September 2005
 Special Eurobarometer European Commission Radioactive waste Fieldwork : February- March 2005 Publication : September 2005 Special Eurobarometer 227 / Wave 63.2 TNS Opinion & Social This survey was requested
General socio-economic situation in rural areas in the La Réunion region
 Rural Development Programme (RDP) of La Réunion, France Programme de Développement Rural 2007 2013 1 (Rural Development Programme 2007-2013: for a long term sustainable rural development) Relevant Contact
COMMISSION OF THE EUROPEAN COMMUNITIES COMMUNICATION FROM THE COMMISSION TO THE EUROPEAN PARLIAMENT AND THE COUNCIL
 COMMISSION OF THE EUROPEAN COMMUNITIES Brussels, 6.10.2005 COM(2005)473 final COMMUNICATION FROM THE COMMISSION TO THE EUROPEAN PARLIAMENT AND THE COUNCIL on the appropriateness of establishing rules on
Europe s water in figures
 Europe s water in figures An overview of the European drinking water and waste water sectors 2017 edition EurEau The European Federation of National Water Services Introduction EurEau is pleased to present
Sustainability of the Food System - Public Consultation
 Sustainability of the Food System - Public Consultation The aim of this consultation is to identify and assess policies and initiatives that could help make the production and consumption of food more
REPORT FROM THE COMMISSION TO THE EUROPEAN PARLIAMENT, THE COUNCIL, THE EUROPEAN ECONOMIC AND SOCIAL COMMITTEE AND THE COMMITTEE OF THE REGIONS
 EUROPEAN COMMISSION Brussels, 27.2.2017 COM(2017) 88 final REPORT FROM THE COMMISSION TO THE EUROPEAN PARLIAMENT, THE COUNCIL, THE EUROPEAN ECONOMIC AND SOCIAL COMMITTEE AND THE COMMITTEE OF THE REGIONS
Rural Development Policy
 Rural Development Policy Guido CASTELLANO Deputy Head of Unit H1 Consistency of Rural Development DG Agriculture and Rural Development European Commission Agriculture and Rural Development Importance of
The implementation of forestry measures under the Rural Development Regulation 1698/2005 for the period
 The implementation of forestry measures under the Rural Development Regulation 1698/2005 for the period 2007-2013 Tamas Szedlak European Commission Directorate General Agriculture and Rural Development
Rural Development Programme (RDP) of Azores, Portugal. General socio-economic situation in rural areas in the Azores region
 of Azores, Portugal. General socio-economic situation in rural areas in the Azores region") Rural Development Programme (RDP) of Azores, Portugal PRORURAL Programa de Desenvolvimento Rural da Região Autónoma dos Açores (Rural Development Programme 2007-2013: for a long term sustainable rural
Rural Development Programme (RDP) of Azores, Portugal PRORURAL Programa de Desenvolvimento Rural da Região Autónoma dos Açores (Rural Development Programme 2007-2013: for a long term sustainable rural
Excessive Deficit Procedure Statistics Working Group
 EUROPEAN COMMISSION EUROSTAT Directorate D - Government Finance Statistics (GFS) and quality Unit D-1: Excessive deficit procedure and methodology Unit D-2: Excessive deficit procedure (EDP) 1 Unit D-3:
Rural Development Programmes
 Rural Development Programmes 2014-2020 28 Partnership Agreements covering all ESI Funds 2/2 118 RDPs 4/4 15/15 2/2 30/30 23/23 3/3 19/19 Rural Development Funding In total, around 161 billion of total
ANNUAL PUBLICATION: detailed data. VOLUME OF EXPORTS FELL BY 4,7 PER CENT IN 2015 Export prices rose 0,7 per cent. 24 March 2016
 ANNUAL PUBLICATION: detailed data 2 March 216 VOLUME OF EXPORTS FELL BY,7 PER CENT IN 21 Export prices rose,7 per cent According to Finnish Customs preliminary data, the value of Finland s goods exports
Over the whole year 2011, GDP increased by 1.4% in the euro area and by 1.5% in the EU27, compared with +1.9% and +2.0% respectively in 2010.
 35/2012-6 March 2012 Second estimates for the fourth quarter of Euro area and EU27 down by 0.3% +0.7% and +0.9% respectively compared with the fourth quarter of 2010 decreased by 0.3% in both the euro
Publishing date: 07/02/2018. We appreciate your feedback. Share this document
 Publishing date: 07/02/2018 Document title: Electricity and gas retail - List of Figures 2016 We appreciate your feedback Please click on the icon to take a 5 online survey and provide your feedback about
Approaches in using common Rural Development indicators in regional RDPs
 WORKING DOCUMENT Approaches in using common Rural Development indicators in regional RDPs Good Practice Workshop Specific challenges in using common RD indicators at regional level Rome, 6 and 7 March
General socio-economic situation in rural areas in the Balearic islands
 Rural Development Programme (RDP) of the Balearic Islands, Spain Programa de Desarrollo Rural de las Illes Balears 2007-2013 April 2010 1 (Rural Development Programme of the Balearic Islands) Relevant
Rural Development Programmes
 Axis 2 - Improving the environment and the countryside through land management Axis 1 - Improving the competitiveness of the agricultural and forestry sector Rural Development Programmes 2007-2013 State
Annex 2: Assess the efficiency rates in function of environmental and climatic conditions and agricultural practices
 Annex 2: Assess the efficiency rates in function of environmental and climatic conditions and agricultural practices This annex supplements annex 1 by considering the various environmental and climatic
Environmental statistics in Europe Facts and figures on the environment: from environmental taxes to water resources
 STAT/10/189 10 December 2010 Environmental statistics in Europe Facts and figures on the environment: from environmental taxes to water resources What share of fresh water resources is being abstracted
WFD and Agriculture Linkages at the EU Level Summary report on an in-depth assessment of RDprogrammes as regards water management
 WFD and Agriculture Linkages at the EU Level Summary report on an in-depth assessment of RDprogrammes 2007-2013 as regards water management Final Report 10.04.2009 Prepared by: Thomas Dworak (Ecologic
Use of Internet Use of Internet Services by Citizens in the EU
 Use of Internet Use of Internet Services by Citizens in the EU Digital Agenda Scoreboard 2016 The Digital Economy and Society Index (DESI) is a composite index that summarises relevant indicators on Europe
Operating subsidies (both direct payments and rural development except investment support) 8 March 2018
 8 March 2018") (both direct payments and rural development except investment support) 8 March 218 This contribution gives an overview of the share of "operating subsidies" in farm income by different dimensions. The
(both direct payments and rural development except investment support) 8 March 218 This contribution gives an overview of the share of "operating subsidies" in farm income by different dimensions. The
EUROPEAN COMMISSION DIRECTORATE-GENERAL FOR AGRICULTURE AND RURAL DEVELOPMENT
 EUROPEAN COMMISSION DIRECTORATE-GENERAL FOR AGRICULTURE AND RURAL DEVELOPMENT Directorate H. General aspects of rural development and research H.5. Research and Innovation Ref. Ares(2014)398686-18/02/2014
Role of the trade unions in the protection and interest representation of employees in Europe
 Role of the trade unions in the protection and interest representation of employees in Europe China-EU Forum, workshop 38a Beijing, 9-10 July 2010 Béla Galgóczi bgalgoczi@etui.org European social model:
Estonian agriculture and rural development what challenges do they have to face?
 Estonian agriculture and rural development what challenges do they have to face? Toomas Kevvai Deputy Secretary General for Rural Development and Fisheries Policy My brief CV 2004 today Deputy Secretary
National action plans Prospects and requirements for the new renewables action plans in Italy
 National action plans 2030 - Prospects and requirements for the new renewables action plans in Italy Autoren: Lukas Liebmann, Gustav Resch Energy Economics Group (EEG) Technische Universität Wien Kontakt:
Europeans attitudes towards animal cloning. Analytical Report
 Flash Eurobarometer 238 The Gallup Organization Flash EB N o 238 Animal Cloning Analytical report Flash Eurobarometer European Commission Europeans attitudes towards animal cloning Analytical Report Fieldwork:
EVALUATION OF THE CAP GREENING MEASURES
 Evaluation carried out by: in collaboration with: The Thünen Institute EVALUATION OF THE CAP GREENING MEASURES What are the greening measures? The 2013 CAP reform introduced a payment for a compulsory
VALUATION OF PUBLIC GOODS AND ECOSYSTEM SERVICES PROVIDED BY AGRICULTURE
 VALUATION OF PUBLIC GOODS AND ECOSYSTEM SERVICES PROVIDED BY AGRICULTURE Ligita Melece Ligita.melece@arei.lv Ilze Šēna Institute of Agricultural Resources and Economics 17 th International Scientific Conference
Trends in waste generation and management in Europe. Özgür Saki European Environment Agency
 Trends in waste generation and management in Europe Özgür Saki European Environment Agency The European Environment Agency An EU institution situated in Copenhagen since 1994 Provides the information necessary
EU Climate and Energy Policy Framework: EU Renewable Energy Policies
 EU Climate and Energy Policy Framework: EU Renewable Energy Policies Buenos Aires 26-27 May 2015 Dr Stefan Agne European Commission DG Climate Action Energy 1 EU Climate and Energy Policy Framework 2 Agreed