Southern Finland regional analysis
|
|
|
- Amelia Hutchinson
- 6 years ago
- Views:
Transcription
1 Southern Finland regional analysis
2 Background for the exercise Training example and data created originally for training of regional council of Southern Finland 2013 Aims at presenting a realitic, yet simplified Zonation setup Note: Data has been generalised and is partially invented
3 Background for the analyses General plan process to be started for the region Aim: to ensure sustainable well-being and competitiveness Including: Safeguarding biodiversity and ecosystem services Zonation is used to identify important and less valuable areas for biodiversity and ecosystem services NOTE: this is a training example with simplifications and invented data J


4 Land use in Uusimaa region Vegetation and land use Source: Uudenmaan liitto

5 Principal formations in the area Source: Uudenmaan liitto

6 Data structure in Southern Finland Z

7 Project structure in S Finland Z
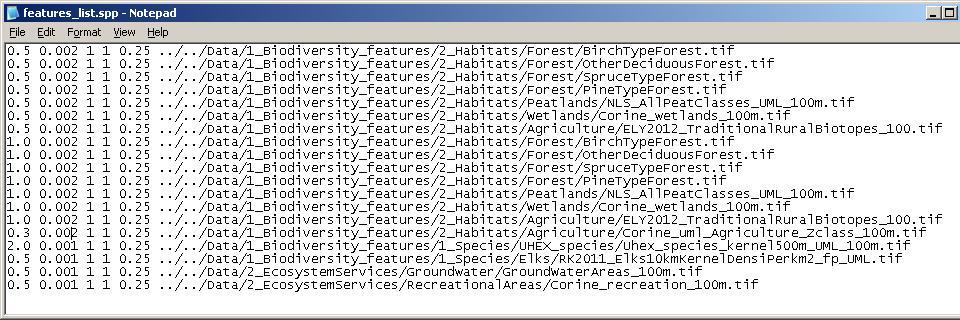
8 Important data sets

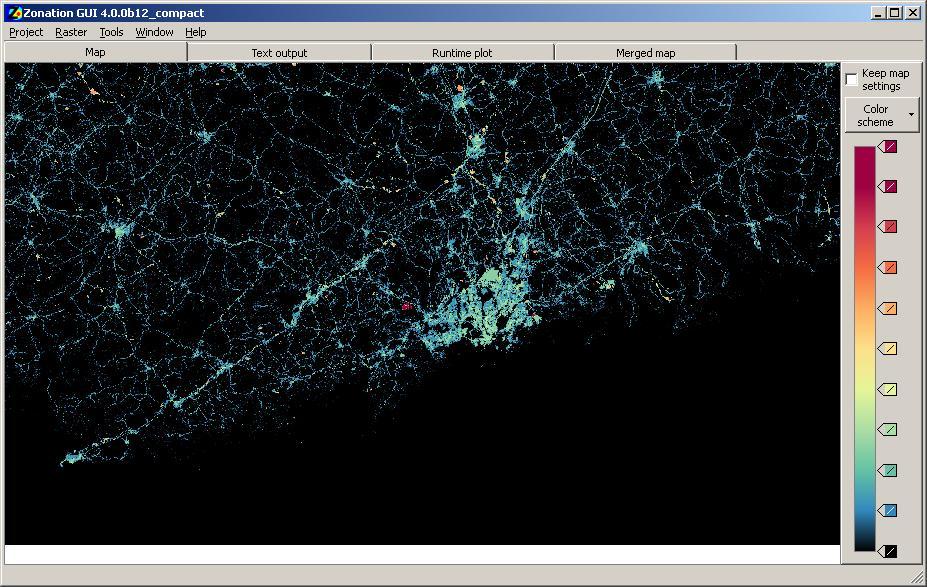
9 MASK: Analysis area mask

10 SPECIES: Occurrence of rare species
11 HABITAT: FOREST, Birch forest index Sirkiä, S., Lehtomäki, J., Lindén, H., Tomppo, E. & Moilanen, A. 2012: Defining spatial priorities for capercaillie (Tetrao urogallus) lekking landscape conservation in south-central Finland. Wildlife Biology 18:
 lekking landscape conservation in south-central Finland.")
12 HABITAT: FOREST, Pine forest index Sirkiä, S., Lehtomäki, J., Lindén, H., Tomppo, E. & Moilanen, A. 2012: Defining spatial priorities for capercaillie (Tetrao urogallus) lekking landscape conservation in south-central Finland. Wildlife Biology 18:
13 Corine Land Cover nomenclature (25 m) CLC2000- NOMENCLATURE 1 ARTIFICIAL AREAS 1.1 Urban fabric Continuous urban fabric Discontinuous urban fabric 1.2 Industrial, commercial and transport units Industrial or commercial units Road and rail networks and associated land Port areas Airports 1.3 Mine, dump and construction sites Mineral extraction sites Dump sites Construction sites 1.4 Artificial non-agricultural vegetated areas Green urban areas Sport and leisure facilities 2 AGRICULTURAL AREAS 2.1 Arable land Non-irrigated arable land Permanently irrigated land Rice fields 2.2 Permanent crops Vineyards Fruit trees and berry plantations Olive groves 2.3 Pastures Pastures 2.4 Heterogeneous agricultural areas Annual crops associated with permanent crops Complex cultivation patterns Peltojen ja niittyjen muodostama mosaiikki Land principally occupied by agriculture, with significant areas of natural vegetation Agro-forestry areas 3. FOREST AND SEMI-NATURAL AREAS 3.1 Forests Broad-leaved forest Coniferous forest Mixed forest 3.2 Shrubs and/or herbaceous vegetation associations Natural grassland Moors and heathland Sclerophylous vegetation Transitional woodland/shrub 3.3 Open spaces with little or no vegetation Beaches, dunes, and sand plains Bare rock Sparsely vegetated areas Burnt areas Glaciers and perpetual snow 4. WETLANDS 4.1 Inland wetlands Inland marshes Peatbogs 4.2 Coastal wetland Salt marshes Salines Intertidal flats 5. WATER BODIES 5.1 Inland waters Water courses Water bodies 5.2 Marine waters Coastal lagoons Estuaries Sea and ocean
14 Corine land cover data Original classification in 25 m resolution Agricultural areas Wetlands Peatlands Non-irrigated arable land 1 Fruit trees & berry plantations 6 Pastures 3 Inland marshes 1 Salt marshes 1 Salines 1 Intertidal flats 1 Peatbogs 1
15 Corine land cover data Original classification in 25 m resolution Agricultural areas Wetlands Peatlands Aggregation to 100 m Sum of agrivalues Sum of wetland values Sum of peatland values

16 HABITATS: Peatlands
17 HABITATS: Wetlands
18 HABITATS: Agricultural lands ranked with their BD value

19 HABITATS: traditional rural biotopes, nationally, regionally, locally important

20 ECOSYSTEM SERVICES: Groundwater areas

21 ECOSYSTEM SERVICES: Recreational areas
22 Land cover à Condition layer Dump sites Construction sites Green urban areas Sport and leisure facilities Sport and leisure facilities Sport and leisure facilities Non-irrigated arable land Non-irrigated arable land Fruit trees and berry plantations Pastures Broad-leaved forest Broad-leaved forest Coniferous forest Coniferous forest Coniferous forest Mixed forest Transitional woodland/shrub Transitional woodland/shrub Transitional woodland/shrub Transitional woodland/shrub Transitional woodland/shrub Beaches, dunes, and sand plains Bare rock Inland marshes Inland marshes Peatbogs 0.9 Peat extraction Intertidal flats Intertidal flats Water courses Water bodies Water bodies 0.9

23 CONDITION: All land use
24

25 CONSERVATION: All conservation areas
26 CONSERVATION / LANDUSE: Hierarchical mask
27 What is the aim of the analysis? What BD features are needed for prioritization? Protection of certain species or balanced solution? - Data sets? - Weights? - Cell removal rules
28 Step-by-step development of the analyses Forest data only (UML_01_M_abf) Forests + other environments (UML_02_MSP_abf) Forests, other environments, forest connectivity (UML_03_MSP_mc_abf) Forests, other environments, forest connectivity + ecosystem services (UML_04_MSP_mc_ESS_L_abf) As previously + condition layer (UML_05_MSP_mck_ESS_L_abf) As previously + harmful land use and negative connectivity (UML_06_MSP_mcki_ESS_L_abf) As previously + current protection (UML_07_MSP_mcki_ESS_L_abf_HM1) As in UML_6 + current plans (UML_08_MSP_mcki_ESS_L_abf_HM2)
29 Step-by-step development of the analyses 1. UML_01_M_abf 2. UML_02_MSP_abf 3. UML_03_MSP_mc_abf 4. UML_04_MSP_mc_ESS_L_abf 5. UML_05_MSP_mck_ESS_L_abf 6. UML_06_MSP_mcki_ESS_L_abf 7. UML_07_MSP_mcki_ESS_L_abf_HM1 8. UML_08_MSP_mcki_ESS_L_abf_HM2
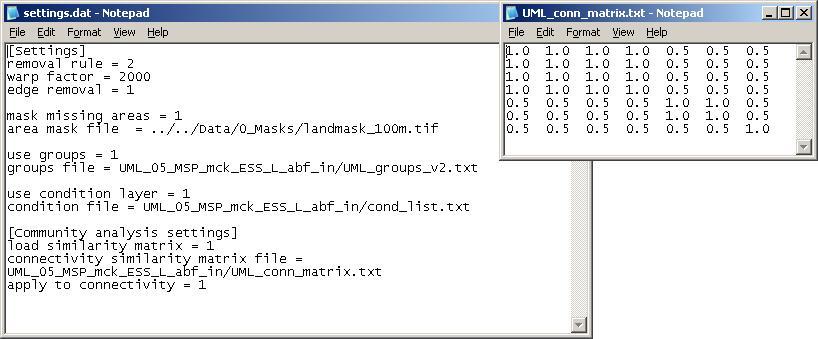
30 Codes in the names are interpreted as follows: UML = Uudenmaanliitto M = Forests (Metsät) S = Peatlands and wetlands (Suot ja kosteikot) P = Agricultural areas (Pellot ja perinnebiotoopit) ESS = Ecosystem services L = Species data (Lajiaineistot) mc = matrix connectivity k = Condition layer (kuntokerros) i = Interaction connectivity, negative landuse (interaktiot) HM1 = Hierarchical mask 1 (Regional zoning) HM2 = Hierarchical mask 2 (Protected areas) abf = Additive benefit function
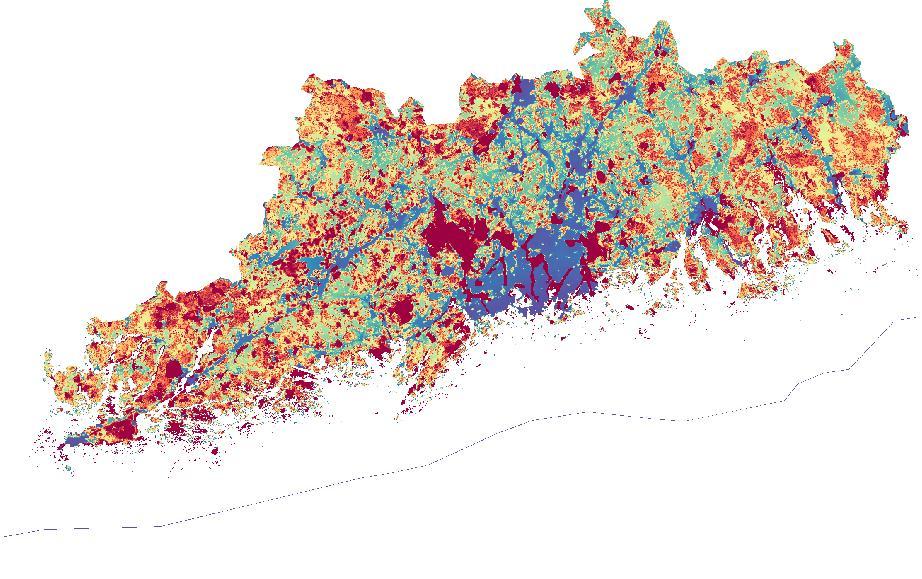
31 UML_01_M_abf Prioritization using forest indices for four forest types Sirkiä, S., Lehtomäki, J., Lindén, H., Tomppo, E. & Moilanen, A. 2012: Defining spatial priorities for capercaillie (Tetrao urogallus) lekking landscape conservation in southcentral Finland. Wildlife Biology 18:

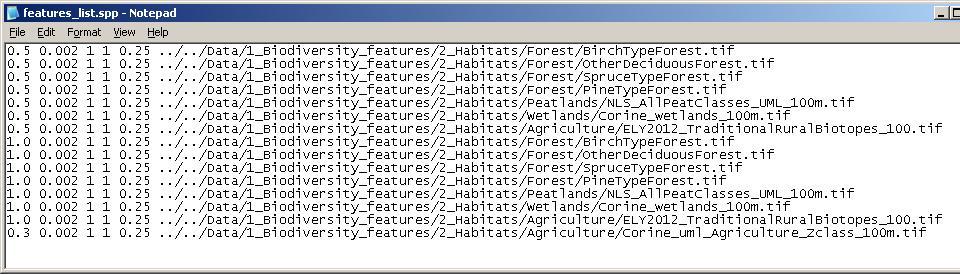
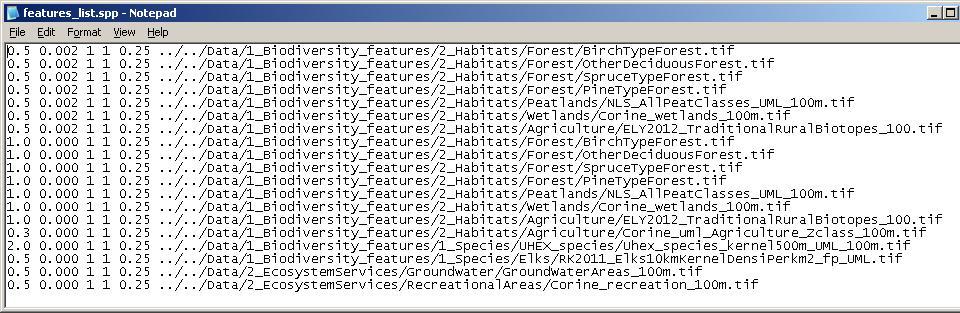
32 UML_01_M_abf Weights for individual layers List of BD features
33

34 UML_02_MSP_abf Forest index layers + other land uses (Peatlands, wetlands, agriculture: traditional rural biotopes + agricultural areas)
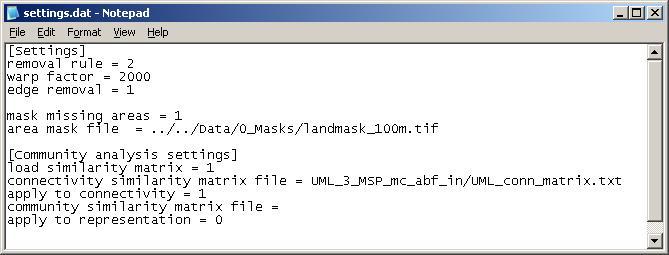
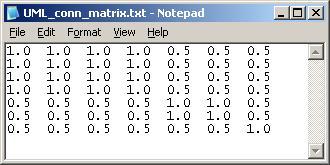
35 UML_03_MSP_mc_abf Forest index layers + other land uses (Peatlands, wetlands, agriculture: traditional rural biotopes + agricultural areas) Habitat connectivity
36
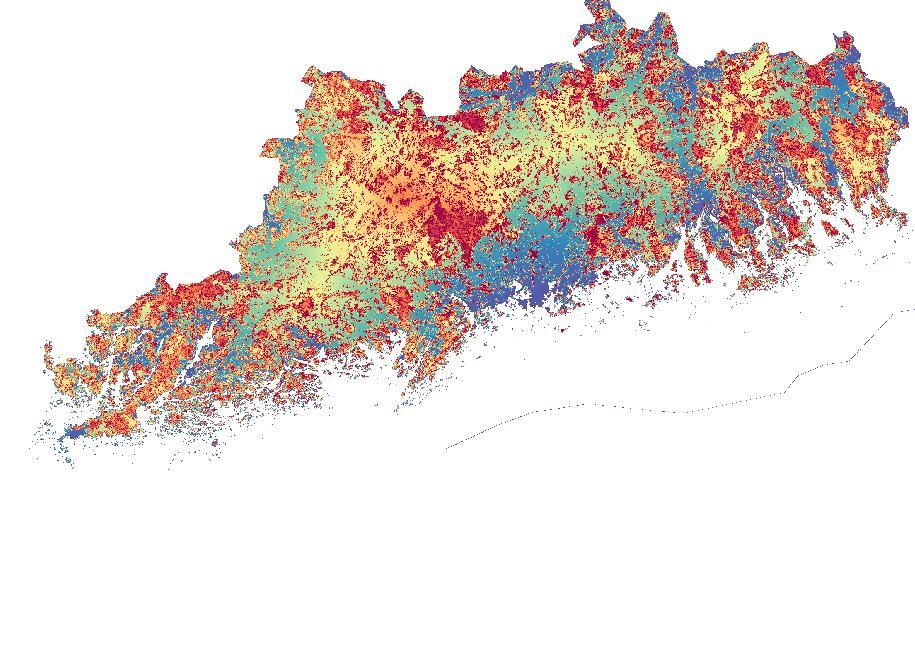
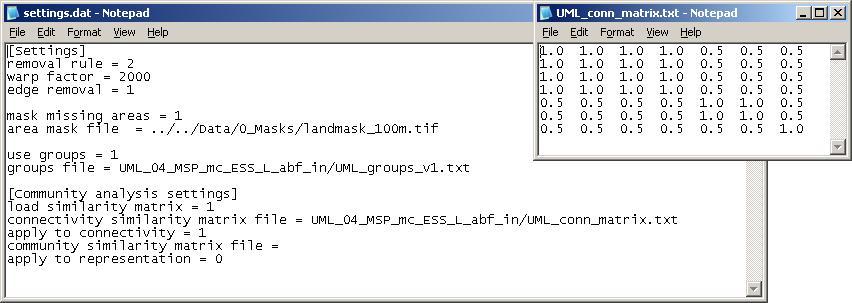
37 UML_04_MSP_mc_ESS_L_abf Habitat data + species data + ecosystem services Habitat connectivity Grouping of results
38
39
40 UML_05_MSP_mck_ESS_L_abf Habitat data + species data + ecosystem services Habitat connectivity Grouping of results Habitat condition

41
42
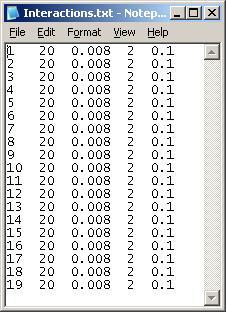
43 UML_06_MSP_mcki_ESS_L_abf Habitat data + species data + ecosystem services Habitat connectivity Grouping of results Habitat condition Negative connectivity to harmful landuse

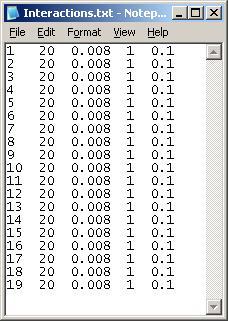
44 Other Data Layers
45 UML_07_MSP_mcki_ESS_L_abf_HM1 Habitat data + species data + ecosystem services Habitat connectivity Grouping of results Habitat condition Negative connectivity to harmful landuse Hierarchical mask with regional plan (3 levels; 3 = PA, 2 = Planned green areas, 1 = the rest)

46 CONSERVATION / LANDUSE: Hierarchical mask
47
48
49 UML_08_MSP_mcki_ESS_L_abf_HM2 Habitat data + species data + ecosystem services Habitat connectivity Grouping of results Habitat condition Negative connectivity to harmful landuse Hierarchical mask with all protected area
50

51 Explore yourself!
52 Good luck!
Country fact sheet. Land cover Liechtenstein. September Photo: Toni García, My City/EEA
 Country fact sheet Land cover 2012 Liechtenstein September 2017 Photo: Toni García, My City/EEA Land cover 2012 Overview of land cover & change As in previous periods, the land cover development in the
Country fact sheet. Land cover Switzerland. September Photo: Toni García, My City/EEA
 Country fact sheet Land cover 2012 Switzerland September 2017 Photo: Toni García, My City/EEA Land cover 2012 Overview of land cover & change In the long term, the Swiss landscape shows very low intensity
Country fact sheet. Land cover Luxembourg. September Photo: Toni García, My City/EEA
 Country fact sheet Land cover 2012 Luxembourg September 2017 Photo: Toni García, My City/EEA Land cover 2012 Overview of land cover & change The small country of Luxembourg shows significant decrease of
Country fact sheet. Land cover Malta. September Photo: Toni García, My City/EEA
 Country fact sheet Land cover 2012 Malta September 2017 Photo: Toni García, My City/EEA Land cover 2012 Overview of land cover & change Concerning the land cover development, there occurs no significant
Country fact sheet. Land cover Norway. September Photo: Toni García, My City/EEA
 Country fact sheet Land cover 2012 Norway September 2017 Photo: Toni García, My City/EEA Land cover 2012 Overview of land cover & change The Norwegian landscape is characterized by very low intensity of
Land Cover / Land Use & Digital Elevation Maps. These are required for almost all coastal products involving the terrestrial side.
 Land Cover / Land Use & Digital Elevation Maps These are required for almost all coastal products involving the terrestrial side. Example Issues to be Addressed Risk and vulnerability assessment Urbanization
Bosnia and Herzegovina
 Country fact sheet Land cover 2012 Bosnia and Herzegovina September 2017 Photo: Toni García, My City/EEA Land cover 2012 Overview of land cover & change The overall pace of land cover development in Bosnia
The former Yugoslav Republic of Macedonia
 Country fact sheet Land cover 2012 The former Yugoslav Republic of Macedonia September 2017 Photo: Toni García, My City/EEA Land cover 2012 Overview of land cover & change The period in the former Yugoslav
Changes of artificial surfaces in Slovakia
 Changes of artificial surfaces in Slovakia 1990-2006 Ján Feranec, Monika Kopecká, Ján Oťaheľ, Jozef Novaček Institute of Geography, Slovak Academy of Sciences, Bratislava, Slovakia 32 nd International
Country fact sheet. Land cover Kosovo* September Photo: Toni García, My City/EEA. *Under UNSCR 1244/99.
 Country fact sheet Land cover 2012 Kosovo* September 2017 Photo: Toni García, My City/EEA *Under UNSCR 1244/99. Land cover 2012 Overview of land cover & change The overall pace of land cover development
Country fact sheet. Land cover Cyprus. September Photo: Toni García, My City/EEA
 Country fact sheet Land cover 2012 Cyprus September 2017 Photo: Toni García, My City/EEA Land cover 2012 Overview of land cover & change In the period, there has been observed significant decrease of intensity
Country fact sheet. Land cover Finland. September Photo: Toni García, My City/EEA
 Country fact sheet Land cover 2012 Finland September 2017 Photo: Toni García, My City/EEA Land cover 2012 Overview of land cover & change The land cover development in Finland has similar intensity and
Country fact sheet. Land cover Romania. September Photo: Toni García, My City/EEA
 Country fact sheet Land cover 2012 Romania September 2017 Photo: Toni García, My City/EEA Land cover 2012 Overview of land cover & change The Romanian landscape is characterised by its low dynamics of
Country fact sheet. Land cover Denmark. September Photo: Toni García, My City/EEA
 Country fact sheet Land cover 2012 Denmark September 2017 Photo: Toni García, My City/EEA Land cover 2012 Overview of land cover & change The overall land cover change rate in Denmark, which has been below
Country fact sheet. Land cover Albania. September Photo: Toni García, My City/EEA
 Country fact sheet Land cover 2012 Albania September 2017 Photo: Toni García, My City/EEA Land cover 2012 Overview of land cover & change With an annual land cover change rate of 0.1, the overall pace
Country fact sheet. Land cover Austria. September Photo: Toni García, My City/EEA
 Country fact sheet Land cover 2012 Austria September 2017 Photo: Toni García, My City/EEA Land cover 2012 Overview of land cover & change 2006-2012 Despite its significant acceleration, compared to the
Country fact sheet. Land cover Slovenia. September Photo: Toni García, My City/EEA
 Country fact sheet Land cover 2012 Slovenia September 2017 Photo: Toni García, My City/EEA Land cover 2012 Overview of land cover & change 2006-2012 In the long term, Slovenia is a country with one of
1.2. Net change in land cover [ha] 15
![1.2. Net change in land cover [ha] 15](/thumbs/88/115381486.jpg "1.2. Net change in land cover [ha] 15") Land cover 2006 Overview of land cover & change The Irish landscape (dominated by pastures and peatlands) shows to be less dynamic during this period as average yearly land cover change rate decreased
Land cover 2006 Overview of land cover & change The Irish landscape (dominated by pastures and peatlands) shows to be less dynamic during this period as average yearly land cover change rate decreased
Country fact sheet. Land cover Serbia. September Photo: Toni García, My City/EEA
 Country fact sheet Land cover 2012 September 2017 Photo: Toni García, My City/EEA Land cover 2012 Overview of land cover & change The development of the n landscape seems to remain stable compared to previous
Country fact sheet. Land cover Sweden. September Photo: Toni García, My City/EEA
 Country fact sheet Land cover 2012 Sweden September 2017 Photo: Toni García, My City/EEA Land cover 2012 Overview of land cover & change Landscape development in Sweden is very intensive in the 2006-2012
Country fact sheet. Land cover Bulgaria. September Photo: Toni García, My City/EEA
 Country fact sheet Land cover 2012 Bulgaria September 2017 Photo: Toni García, My City/EEA Land cover 2012 Overview of land cover & change The overall change rate in Bulgaria is very low, compared to other
Country fact sheet. Land cover Turkey. September Photo: Toni García, My City/EEA
 Country fact sheet Land cover 2012 Turkey September 2017 Photo: Toni García, My City/EEA Land cover 2012 Overview of land cover & change The overall pace of land cover development in Turkey has increased,
Country fact sheet. Land cover Germany. September Photo: Toni García, My City/EEA
 Country fact sheet Land cover 2012 Germany September 2017 Photo: Toni García, My City/EEA Land cover 2012 Overview of land cover & change Characterized by the annual land cover change rate of 0,1, the
Country fact sheet. Land cover Slovakia. September Photo: Toni García, My City/EEA
 Country fact sheet Land cover 2012 Slovakia September 2017 Photo: Toni García, My City/EEA Land cover 2012 Overview of land cover & change With the overall land cover change rate of 0.3 of total area,
1.2. Net change in land cover [ha] 50000
![1.2. Net change in land cover [ha] 50000](/thumbs/92/107846366.jpg "1.2. Net change in land cover [ha] 50000") Land cover 2006 Overview of land cover & change Finish landscape is characterized by high amount of forested areas and water bodies (almost ¾ of area are composed of coniferous and mixed forest, together
Land cover 2006 Overview of land cover & change Finish landscape is characterized by high amount of forested areas and water bodies (almost ¾ of area are composed of coniferous and mixed forest, together
Country fact sheet. Land cover Spain. September Photo: Toni García, My City/EEA
 Country fact sheet Land cover 2012 Spain September 2017 Photo: Toni García, My City/EEA Land cover 2012 Overview of land cover & change The overall annual land cover change rate in Spain is 0,2, which
Country fact sheet. Land cover Portugal. September Photo: Toni García, My City/EEA
 Country fact sheet Land cover 2012 Portugal September 2017 Photo: Toni García, My City/EEA Land cover 2012 Overview of land cover & change In the long term, Portugal is a country with the highest dynamics
1.2. Net change in land cover [ha] 8000
![1.2. Net change in land cover [ha] 8000](/thumbs/72/66958110.jpg "1.2. Net change in land cover [ha] 8000") Land cover 2006 Overview of land cover & change Landscape in Bosnia and Herzegovina is covered mostly by forests (54%), pastures (34%) and semi-natural vegetation (7%). The overall development of land
Land cover 2006 Overview of land cover & change Landscape in Bosnia and Herzegovina is covered mostly by forests (54%), pastures (34%) and semi-natural vegetation (7%). The overall development of land
1.2. Net change in land cover [ha] 12000
![1.2. Net change in land cover [ha] 12000](/thumbs/72/66539401.jpg "1.2. Net change in land cover [ha] 12000") Land cover 2006 Overview of land cover & change The change of landscape in Cyprus during is dominated by formation of artificial and forested land and on the other hand consumption of open spaces/bare
Land cover 2006 Overview of land cover & change The change of landscape in Cyprus during is dominated by formation of artificial and forested land and on the other hand consumption of open spaces/bare
1.2. Net change in land cover [ha] 1000
![1.2. Net change in land cover [ha] 1000](/thumbs/73/69481075.jpg "1.2. Net change in land cover [ha] 1000") Land cover 2006 Overview of land cover & change The development of landscape in Kosovo is characterized by formation of artificial areas, forested land and, to a lesser extent, arable/crop land and consumption
Land cover 2006 Overview of land cover & change The development of landscape in Kosovo is characterized by formation of artificial areas, forested land and, to a lesser extent, arable/crop land and consumption
Country fact sheet. Land cover Poland. September Photo: Toni García, My City/EEA
 Country fact sheet Land cover 2012 Poland September 2017 Photo: Toni García, My City/EEA Land cover 2012 Overview of land cover & change The comparison of annual change rates for the last three observing
Country fact sheet. Land cover Italy. September Photo: Toni García, My City/EEA
 Country fact sheet Land cover 2012 Italy September 2017 Photo: Toni García, My City/EEA Land cover 2012 Overview of land cover & change Italy is a country with a relatively stable landscape, compared to
Country fact sheet. Land cover Czech Republic. September Photo: Toni García, My City/EEA
 Country fact sheet Land cover 2012 Czech Republic September 2017 Photo: Toni García, My City/EEA Land cover 2012 Overview of land cover & change According to the annual change rate (0.40%), the overall
Country fact sheet. Land cover Hungary. September Photo: Toni García, My City/EEA
 Country fact sheet Land cover 2012 Hungary September 2017 Photo: Toni García, My City/EEA Land cover 2012 Overview of land cover & change With a mean annual land cover change rate of 0.5%, the overall
1.2. Net change in land cover [ha] 20000
![1.2. Net change in land cover [ha] 20000](/thumbs/96/128717489.jpg "1.2. Net change in land cover [ha] 20000") Land cover 2006 Overview of land cover & change The landscape in is characteristic by predominant share of natural land cover, mostly forested land and water bodies. The development of land cover in is
Land cover 2006 Overview of land cover & change The landscape in is characteristic by predominant share of natural land cover, mostly forested land and water bodies. The development of land cover in is
1.2. Net change in land cover [ha] % 1
![1.2. Net change in land cover [ha] % 1](/thumbs/74/69747122.jpg "1.2. Net change in land cover [ha] % 1") Land cover 2006 Overview of land cover & change In period, the situation in landscape of the FYR of Macedonia can be characterized by dynamic development of agricultural land, driven by both internal agricultural
Land cover 2006 Overview of land cover & change In period, the situation in landscape of the FYR of Macedonia can be characterized by dynamic development of agricultural land, driven by both internal agricultural
1.2. Net change in land cover [ha]
![1.2. Net change in land cover [ha]](/thumbs/72/67518217.jpg "1.2. Net change in land cover [ha]") Land cover 2006 Overview of land cover & change After the large political and economical changes in Slovakia during 90 s, the period is characterised by stabilization - rapid decrease of overall intensity
Land cover 2006 Overview of land cover & change After the large political and economical changes in Slovakia during 90 s, the period is characterised by stabilization - rapid decrease of overall intensity
1.2. Net change in land cover [ha] 5000
![1.2. Net change in land cover [ha] 5000](/thumbs/94/120614901.jpg "1.2. Net change in land cover [ha] 5000") Land cover 2006 Overview of land cover & change consists of two regions with significantly different character of the landscape. Lowland region of Vojvodina, situated in the northern part of the country,
Land cover 2006 Overview of land cover & change consists of two regions with significantly different character of the landscape. Lowland region of Vojvodina, situated in the northern part of the country,
Methodological notes for the calculation of Total Surface Area and Land surface area for all NUTS
 EUROPEAN COMMISSION EUROSTAT Directorate E: Sectoral and regional statistics Unit E-4: Regional statistics and geographical information Methodological notes for the calculation of Total Surface Area and
1.2. Net change in land cover [ha] 20000
![1.2. Net change in land cover [ha] 20000](/thumbs/79/80301912.jpg "1.2. Net change in land cover [ha] 20000") Land cover 2006 Overview of land cover & change Polish landscape is dominated by (63%) and forest (3). The situation is characterized by consumption of agricultural areas (with a predominant share of arable
Land cover 2006 Overview of land cover & change Polish landscape is dominated by (63%) and forest (3). The situation is characterized by consumption of agricultural areas (with a predominant share of arable
Translation of the CORINE Land Cover nomenclature to the Land Cover Meta Language using LCCS3
 Translation of the CORINE Land Cover nomenclature to the Land Cover Meta Language using LCCS3 Vasco Nunes Remote Sensing Group (GDR) Portuguese Geographic Institute (IGP) http://www.igeo.pt/gdr/ Coordinator:
Open Linked Data in Portugal
 Open Linked Data in Portugal Contribution for INSPIRE Implementation Maria José Vale, Rui Reis, Bruno M. Meneses, Raquel Saraiva, Paulo Patrício, Jesus Estrada Maria José Vale, Rui Reis, Bruno M. Meneses,
Use of CORINE Land Cover in delivering the EEA strategy
 Use of CORINE Land Cover in delivering the EEA strategy Prof. Jacqueline McGlade Executive Director EIONET Member Countries national teams / co-funding Commission Services: Acknowledgements JRC: joint
1.2. Net change in land cover [ha] 50000
![1.2. Net change in land cover [ha] 50000](/thumbs/81/84015495.jpg "1.2. Net change in land cover [ha] 50000") Artificial areas Arable & permanent crops Pastures & mosaics Forested Semi-natural vegetation Open spaces/ bare soils Wets Water bodies TOTAL [hundreds ha] Turkey Land cover 2006 Overview of cover & change
Artificial areas Arable & permanent crops Pastures & mosaics Forested Semi-natural vegetation Open spaces/ bare soils Wets Water bodies TOTAL [hundreds ha] Turkey Land cover 2006 Overview of cover & change
CORINE land cover nomenclature definitions
 By: Roula Trigou/ HOS CORINE land cover nomenclature definitions 1. Artificial surfaces 1.1. Urban fabric 1. 1. 1. Continuous urban fabric Most of the land is covered by areas of urban centres. Buildings,
Corine Land Cover and Land & Ecosystem Accounting tools
 Enrichment of the MedWet Inventory Method Exploring applications of Remote Sensing techniques and of Spatial Data Infrastructure Corine Land Cover and Land & Ecosystem Accounting tools Jean-Louis Weber
Optimization of the Hub Height of a Wind Turbine
 Journal of Industrial and Intelligent Information Vol., No. 4, December 014 Optimization of the Hub Height of a Wind Turbine Jaehwan Lee, Woojin Cho, and Kwan-Soo Lee School of Mechanical Engineering of
Overview of land cover & change
 Note The results presented here are based on a change analysis of 44 land cover types mapped consistently on a 1:1. scale across Europe over the decade 199-2 - see Corine land cover programme for details.
The European Environment s Agency requirements for Meteorological and Climatic data
 The European Environment s Agency requirements for Meteorological and Climatic data With special focus on reanalysed meteorological fields Philippe Crouzet EEA with inputs from André Jol EEA and Hadley
Land & Ecosystem Accounts in Europe. Ronan Uhel & Jean-Louis Weber
 Land & Ecosystem Accounts in Europe Ronan Uhel & Jean-Louis Weber Why accounting for Land? Produce synthetic assessments, keeping track of the geographic differences Analyse the relation between changes
for Wildland Fire GOFC-GOLD Fire IT Workshop October 2011 Stresa, Italy
 The Global Early Warning System for Wildland Fire 1 GOFC-GOLD Fire IT Workshop 18-19 October 2011 Stresa, Italy Presentation Outline 1. Fire danger and early warning 2. Overview of the Global EWS 3. Recent
The wetland ecosystems in MAES nomenclature
 The wetland ecosystems in MAES menclature SWOS modifications Version 1.2 Date of Creation 11/05/2017 This project has received funding from the European Union s Horizon 2020 research and The wetland invation
ASSESSMENT AND SCENARIOS OF LAND USE CHANGE IN EUROPE
 ASSESSMENT AND SCENARIOS OF LAND USE CHANGE IN EUROPE Content: Layout: Illustrations: Published by: RIKS BV (November 28) RIKS BV RIKS BV RIKS BV RIKS BV This is a publication of the Research Institute
Annex 2.1 The dynamic use of land in the period
 Annex 2.1 The dynamic use of land in the period 1990 2000 Land use (CLC) Code CLC Area (ha) 1990 2000 1990 2000 Class 1: Artificial areas 2.361,616 Class 1.1 Urban fabric 39,974 Discontinous urban fabric
A Framework for Land Accounting - Draft Set of Tables
 A Framework for Land Accounting - Draft Set of Tables Note: an earlier version of this set of tables was discussed by the Eurostat Task Force on Land Accounting at its meeting 5-6 July 1999 in Luxembourg
TOWARDS ESTIMATING EMISSIONS FROM GM AND CM IN THE UK
 TOWARDS ESTIMATING EMISSIONS FROM GM AND CM IN THE UK Defra project SP1113 CEH, SRUC, ADAS, AFBI, Ricardo-AEA, University of Aberdeen OBJECTIVES To assess the feasibility of including changes in soil carbon
PRIORITISATION OF TARGET AREAS FOR FOREST RESTORATION. Final Report. Produced by WCMC for WWF International
 PRIORITISATION OF TARGET AREAS FOR FOREST RESTORATION Final Report Produced by WCMC for WWF International May 2000 PRIORITISATION OF TARGET AREAS FOR FOREST RESTORATION Contents 1. Background... 1 2. Objectives...
Land Accounts. March 2018
 Land Accounts March 2018 Land accounts Land cover Land use Land value Relationship to ecosystem accounting 2 Definition and scope Definition: Land is a unique environmental asset that delineates the space
Tier 1 estimation of GHG emissions from organic soils in Cropland Management (CM) and Grazing Land Management (GM) at EU level
 and Grazing Land Management (GM) at EU level") Tier 1 estimation of GHG emissions from organic soils in Cropland Management (CM) and Grazing Land Management (GM) at EU level Simone Rossi, Roland Hiederer, Giacomo Grassi, Raul Abad Viñas Joint Research
Tier 1 estimation of GHG emissions from organic soils in Cropland Management (CM) and Grazing Land Management (GM) at EU level Simone Rossi, Roland Hiederer, Giacomo Grassi, Raul Abad Viñas Joint Research
LCEU11 = Rainfed herbaceous cropland Total LCEU08. LCEU09 Summary Table
 Spatial Units: Group Exercise 1: Calculate area of each LCEU and LCEU type LCEU Table LCEU BSU count Area (km 2 ) LCEU01 LCEU02 LCEU01 = Rainfed herbaceous cropland 80 5.0 LCEU02 = Forest tree cover 42
JRC Contribution to MAES-SOIL Workshop
 JRC Contribution to MAES-SOIL Workshop Ghent 02-03.06.16 Arwyn Jones EC-JRC, Land Resource Management Natural Capital: Unit-Soil Project arwyn.jones@jrc.ec.europa.eu LUCAS Soil Sampling strategy First
Forest/Grassland, Secondary / Vegetation. not used
 Table 1 Biodiversity damage potential (BDP) characterization factors (median) of occupation per land use type, 1. and 3. quartile and number of data points (n). For n
Key requirements of ecosystem service classification for ecosystem accounting
 Key requirements of ecosystem service classification for ecosystem accounting Julian Chow Environmental Economic Accounts Section United Nations Statistics Division Expert Group Meeting Towards a Standard
European Mapping activities and results
 The Economics of Action 5 - Valuation of ecosystems and their services, INBO, Brussels 01-02 July 2015 European Mapping activities and results Markus Erhard European Environment Agency, Copenhagen markus.erhard@eea.europa.eu
GIS-based Valuation of Ecosystem Services in Mountain Regions:
 GIS-based Valuation of Ecosystem Services in Mountain Regions: A Case Study of the Karlovo Municipality in Bulgaria Boian Kulov 1, Ekaterina Ivanova 2, Bilyana Borisova 3, Assen Assenov 4, Aleksandra Ravnachka
Supplementary material. Assessing the effect of a fuel break network to reduce burnt area and wildfire risk transmission
 International Journal of Wildland Fire 25(6), 619 632 doi: 10.1071/WF15146_AC IAWF 2016 Supplementary material Assessing the effect of a fuel break network to reduce burnt area and wildfire risk transmission
VEGETATIVE, WATER, FISH AND WILDLIFE RESOURCES POLICIES
 VEGETATIVE, WATER, FISH AND WILDLIFE RESOURCES POLICIES The County will: GOALS AND OBJECTIVES 1.1 Conserve, Enhance, Protect, Maintain and Manage Vegetative, Water, Fish and Wildlife Resources Promote
Habitat Quality: Model Overview
 Habitat Quality: Model Overview Biodiversity is not treated as an ecosystem service Instead, it s used to assess overlaps and tradeoffs InVEST models habitat quality and rarity as indicators of the status
Overview of the SEEA Experimental Ecosystem Accounting with examples from the Netherlands. Sjoerd Schenau Statistics Netherlands
 Overview of the SEEA Experimental Ecosystem Accounting with examples from the Netherlands Sjoerd Schenau Statistics Netherlands Outline Overview of the SEEA Experimental Ecosystem Accounting Core accounting
Benefits of SSSIs in England and Wales
 Benefits of SSSIs in England and Wales Sites of Special Scientific Interest Sites of Special Scientific Interest (SSSIs) are the best places for wildlife and geology nationally. There are 5,000 SSSIs in
SPATIAL ANALYSIS OF LAND COVER AND LAND USE CHANGES IN BULGARIA FOR THE PERIOD BASED ON IMAGE AND CORINE LAND COVER DATA
 Proceedings of the 2 nd Workshop of the EARSeL SIG on Land Use and Land Cover SPATIAL ANALYSIS OF LAND COVER AND LAND USE CHANGES IN BULGARIA FOR THE PERIOD 1990-2000 BASED ON IMAGE AND CORINE LAND COVER
Means of forest management to adapt to climate change Seppo Kellomäki
 Means of forest management to adapt to climate change Seppo Kellomäki University of Joensuu, Faculty of Forest Sciences, Finland Contents Climate change Impacts and vulnerabilities Adaptation with a case
Oslo, September. Brendan Freeman. UK Office for National Statistics
 22 nd Meeting of the London Group on Environmental Accounting Oslo, 28-30 September CARBON ACCOUNTING IN THE UK: AN OVERVIEW OF PROGRESS AND ISSUES Brendan Freeman UK Office for National Statistics Introduction
Manual of CORINE Land Cover changes
 Manual of CORINE Land Cover changes EEA subvention 2011 Final Draft Prepared by: Gy. Büttner and B. Kosztra Date: 30 Nov 2011 Project Manager: Gy. Büttner Manual of CORINE Land Cover Changes 1 TABLE OF
The thematic accuracy of Corine land cover 2000
 EEA Technical report No 7/2006 Assessment using LUCAS (land use/cover area frame statistical survey) ISSN 1725-2237 X EEA Technical report No 7/2006 Assessment using LUCAS (land use/cover area frame statistical
Ecosystem accounting at the European Environment Agency: a summary of progress 1
 Ecosystem accounting at the European Environment Agency: a summary of progress 1 Glenn-Marie Lange, The Earth Institute at Columbia University Jean-Louis Weber, European Environment Agency 25 October 2006
An Eco-metric Approach to Growing Natural Capital. Alison Smith, ECI, University of Oxford CIWEM Environmental Net Gain Conference 30 October 2018
 An Eco-metric Approach to Growing Natural Capital Alison Smith, ECI, University of Oxford CIWEM Environmental Net Gain Conference 30 October 2018 Project team Clare Warburton, Alison Chapman, Nick White
The UNCCD is the custodian agency leading an Inter-Agency Advisory Group on
 SDG indicator 15.3.1 Proportion of land that is degraded over total land area The UNCCD is the custodian agency leading an Inter-Agency Advisory Group on 15.3.1 composed of our key partner FAO as well
Peatland Restoration in Finland - 25 years of practise makes an
 Peatland Restoration in Finland - 25 years of practise makes an expert (?) Restoration of mire habitats in Boreal Biogeographical Region 24-26 September 2013, Soomaa, Estonia Päivi Virnes Metsähallitus,
Mekong Wetland Assets
 1 Basin-wide Climate Change Impact and Vulnerability Assessment for Wetlands of the LMB for Adaptation Planning 2nd Regional Expert Advisory Workshop, Vientiane 11-12 July 2011 Mekong Wetland Assets Prepared
Forest and climate change
 Forest and climate change Seppo Kellomäki University of Eastern Finland School of Forest Sciences Joensuu Campus Finland 1 Contents Forests in the world Global climate change and impacts on forests Climate
3. Forests and semi-natural areas Forests Shrub and/or herbaceous vegetation associations Open spaces with little or no vegetation
 3. Forests and semi-natural areas 3.1. Forests 3.2. Shrub and/or herbaceous vegetation associations 3.3. Open spaces with little or no vegetation CORINE land cover 131 3.1. Forests 3.1.1. Broad-leaved
Collect Earth an innovative tool
 The International Climate Initiative (IKI) Collect Earth an innovative tool Danilo Mollicone Ingredients for the success: 1) Open source software 2) Developed on technology 3) Rely of existing open source
Eionet NRC Soil Meeting 15. Oct. 2015
 Eionet NRC Soil Meeting 15. Oct. 2015 Soil biodiversity and ecosystem services: MAES progress Andrus Meiner & Markus Erhard European Environment Agency (EEA) Ecosystem Assessment in Biodiversity Strategy
Annex. Suggestion for EC GIG
 Annex Category Introduction REFCOND-Guidance High status or reference conditions is a state in the present or in the past corresponding to very low pressure, without the effects of major industrialisation,
Approach to Simplified Ecosystem Capital Accounts
 Sixth Meeting of the UN Committee of Experts on Environmental-Economic Accounting New York, 15-17 June 2011 Approach to Simplified Ecosystem Capital Accounts Jean-Louis Weber Special Adviser to Economic
Kent Biodiversity 2020 and beyond a strategy for the natural environment
 Kent Biodiversity 2020 and beyond a strategy for the natural environment 2015-2025 Introduction Action for the natural environment in Kent and Medway will be delivered by many organisations and individuals
Beverly. Produced in This report and associated map provide information about important sites for biodiversity conservation in your area.
 CONSERVING THE BIODIVERSITY OF MASSACHUSETTS IN A CHANGING WORLD Beverly Produced in 2012 This report and associated map provide information about important sites for biodiversity conservation in your
DEGRADATION IN EAST KALIMANTAN
 DEGRADATION IN EAST KALIMANTAN 2006-2016 7 sheets Deg 06-09,, Deg 15-16 contain LUTM for the calculation of emission from forest degradation (loss of living biomass due to change from primary to secondary
Mapping of ecosystems and their services
 Mapping of ecosystems and their services in the EU and its Member States Leon C. Braat, Alterra, Wageningen, The Netherlands Ecosystem Services Part 1 Concepts, Models, Studies Ecosystem (Based) (Goods
A valuation of the natural capital of the Cam and Ely- Ouse catchment. Final report prepared for WWF-UK Appendix 2 August 2017
 A valuation of the natural capital of the Cam and Ely- Ouse catchment Final report prepared for WWF-UK Appendix 2 August 2017 2 Appendix 2: Maps and Data Tables 1. Maps of catchment activity, natural capital
Defining spatial priorities for capercaillie Tetrao urogallus lekking landscape conservation in south-central Finland
 Defining spatial priorities for capercaillie Tetrao urogallus lekking landscape conservation in south-central Finland Authors: Saija Sirkiä, Joona Lehtomäki, Harto Lindén, Erkki Tomppo, and Atte Moilanen
Implementation of Tier 1 for Mineral Soil under Cropland and Grassland in EU MS
 Implementation of Tier 1 for Mineral Soil under Cropland and Grassland in EU MS IPCC Tier 1 Approach Roland Hiederer, Raul Abad-Viñas, Viorel Blujdea, Giacomo Grassi European Commission Joint Research
DANUBEparksCONNECTED Workshop Corridor Land
 DANUBEparksCONNECTED Workshop Corridor Land 06.-07. April 2017, Spitz a. D., Wachau, Austria Copernicus Land Monitoring Services: from satellite data to ecosystem condition, ecosystem services and green
AP Environmental Science
 AP Environmental Science Types of aquatic life zones MARINE Estuaries coral reefs mangrove swamps neritic zone pelagic zone FRESHWATER lakes and ponds streams and rivers wetlands Distribution of aquatic
6 TH. Most of the Earth Is Covered with Water (2) Most Aquatic Species Live in Top, Middle, or Bottom Layers of Water (1)
 Most Aquatic Species Live in Top, Middle, or Bottom Layers of Water (1)") A Healthy Coral Reef in the Red Sea MILLER/SPOOLMAN ESSENTIALS OF ECOLOGY 6 TH Chapter 8 Aquatic Biodiversity Fig. 8 1, p. 168 Most of the Earth Is Covered with Water (2) Aquatic life zones Saltwater life
A Healthy Coral Reef in the Red Sea MILLER/SPOOLMAN ESSENTIALS OF ECOLOGY 6 TH Chapter 8 Aquatic Biodiversity Fig. 8 1, p. 168 Most of the Earth Is Covered with Water (2) Aquatic life zones Saltwater life
6. Land take by intensive agriculture
 6. Land take by intensive agriculture Key message Intensive agriculture attributes mainly to South of Europe, particularly to Mediterranean region. Outside this region land areas taken by intensive agriculture
Habitat mapping for valuation of biodiversity and ecosystem functions in the Czech Republic
 Habitat mapping for valuation of biodiversity and ecosystem functions in the Czech Republic Pavel Cudlín 1, Ondřej Cudlín 1, Lenka Štěrbová 1, Jan Purkyt 1,2, Vilém Pechanec 3 1 Global Change Research
Chapter 8 Natural Resources
 Chapter 8 Natural Resources 127-134 8.1 Introduction 8.2 Extractives Industry 8.3 Forestry 8.4 Fishing / Aquaculture 8.1 Introduction Kerry has a number of naturally occurring resources that contribute
Society for the Conserv ation of Philippine Wetlands. Inc.
 Society for the Conserv ation of Philippine Wetlands. Inc. Environment immediate surroundings of an individual is a complex system that deals with a network of living and non-living entities Includes: