The Science Behind Quantifying Urban Forest Ecosystem Services. David J. Nowak USDA Forest Service Northern Research Station Syracuse, NY, USA
|
|
|
- Bertina Peters
- 6 years ago
- Views:
Transcription


1 The Science Behind Quantifying Urban Forest Ecosystem Services David J. Nowak USDA Forest Service Northern Research Station Syracuse, NY, USA
2 Current Model Version 3.0
3 i-tree Version 4.0 (March 10, 2011) 5 New or Enhanced Tools Canopy Pest
4
5 Assessing Urban Tree Populations i-tree Eco assesses: Structure Function Energy Air pollution Carbon VOC emissions Value Management needs Pest risk Tree health Exotic/invasive spp.
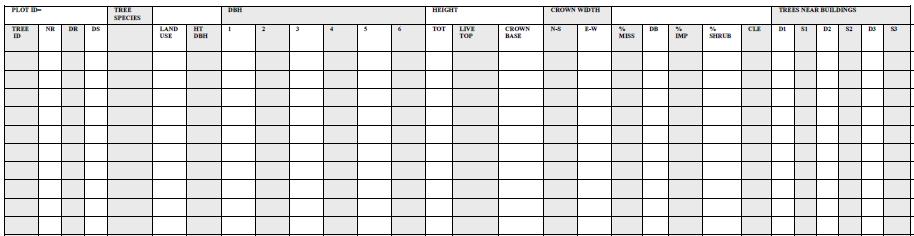
6 Data Collection
7 i-tree Eco Methods - Structure No. trees, species composition, tree sizes, tree condition Direct measures, statistical estimates with standard errors Leaf area Formula based on species factors and crown measurements; adjusted based on crown missing Leaf biomass Converts leaf area to leaf biomass based on species conversion factors Data can be stratified (e.g., land use)
8 i-tree Eco Methods - Functions Carbon Biomass equations (spp, dbh, ht) Adjusted downward for open-grown trees Annual growth based on dieback, competition and length of growing season Air Pollution Removal Leaf area index, canopy cover by evergreen or deciduous; in-leaf season length Local hourly weather & pollution conc. (C) data O 3, SO 2, NO 2 : multi-layer/big-leaf hybrid model PM, CO: average deposition velocity (Vd) Hourly Removal = Vd x C
9 i-tree Eco Methods - Functions Building Energy Use Based on work by McPherson and Simpson Tree size by distance and direction from building Average effects for region (heating and cooling) VOC emissions (not reported) Local hourly weather data Species leaf biomass Genera specific emission factors adjusted by NCAR and EPA formulas based on hourly light intensity and temperature (BEIS approach)
10 i-tree Eco Methods - Valuation Air Pollution Removal National average externality values from literature (updated to 2007) Converting to EPA BenMap estimates Carbon Storage and Sequestration Global externality estimates (Fankauser, 1994) = $22.8/metric ton Energy Use State average electricity and heating fuel costs (oil, wood, natural gas) Structural Value CTLA formula
11 Project Equipment and Costs Crew salary Transportation Project oversight (QA/QC, training) Equipment Aerial photographs and street map to locate plots Clinometer Diameter tape Clipboard; data sheets, pens/pencils (or digital recorders- PDA) 50/100 ft tape measure (or electronic measuring device) Species ID guide Compass Camera (if taking pictures of plot) Chalk/Flagging (to mark trees that have been measured in plots with many trees)
12
13
14 Research Process Structural Analysis Data collection 900 trees, 20 predominant species age, species, dbh, ht., crown dia., condition, digital photos, foliar biomass samples, etc. Calculate leaf area and foliar biomass Regression models predict growth. Regional Climate Vegetation Structure ---- Tree locations Species Canopy cover Leaf area Biomass Growth Mortality Diversity Health Site Bldg. data M Vegetation Structure ---- Tree locations Species Canopy cover Leaf area Biomass Growth Mortality Diversity Health Site Sequestration CO2 Released Bldg. data Emission Factors Meteor. Data Shade Air temp. Wind speed RH Energy Heating Cooling Air Quality Data NOx, SOx, O3, PM10 Dry deposition B.V.O.C. Isoprenes Monoterpenes Stormwater Runoff Interception Firewise Landscape s Aesthetics Other Sequestration CO2 Released Reduction in atmospheric CO2 Emission Factors Reduction in atmospheric CO2 Structure Avoided Emissions Energy & CO2 Air quality improvement Air Quality Hydrology Fire Other Structure
15 Research Process Functional Analysis Models use structural data (size at various ages). Vegetation To determine magnitude Structure of annual benefits: Energy saved Atmospheric CO 2 reduction Air pollutants removed Rainfall intercepted Aesthetics & other ---- Tree locations Species Canopy cover Leaf area Biomass Growth Mortality Diversity Health Site Sequestration CO2 Released Reduction in atmospheric CO2 Bldg. data Emission Factors Regional Climate Meteor. Data Shade Air temp. Wind speed RH Energy Heating Cooling Avoided Emissions Air Quality Data NOx, SOx, O3, PM10 Dry deposition Air quality improvement B.V.O.C. Isoprenes Monoterpenes Stormwater Runoff Interception L Structure Energy & CO2 Air Quality Hydrology
16 Research Process Value Analysis (Net Benefits) Convert resource units (kwh, lbs) to $ Annual Benefits: B = Energy + CO 2 + AQ + Hydrology + property value Annual Costs: C = Plant + Trim + Removal + IPM + Irrigation + Clean-Up + Sidewalk + Liability + Admin + Other Net Benefits = B C Benefits/Costs ratio = B/C
17

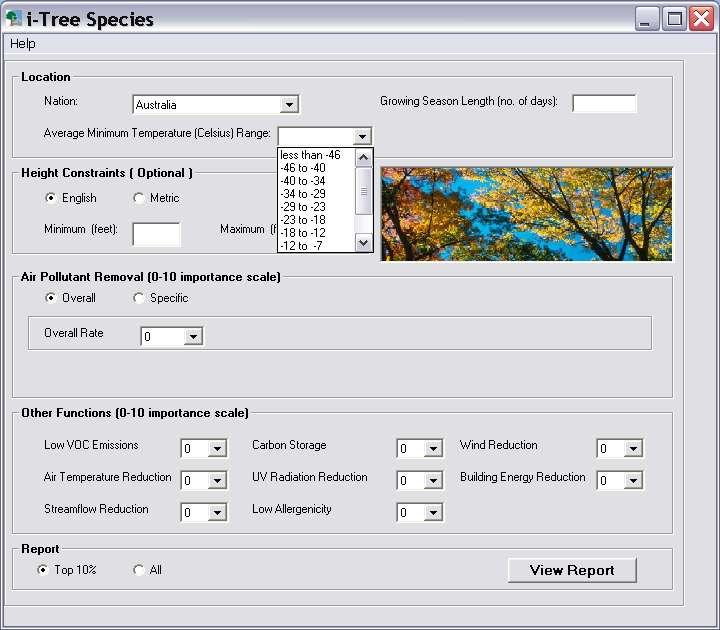
18 What Does Species Do? Ranks tree species based on their environmental benefits at maturity Complements existing tree selection programs
19 v. 4.0 Improvement

20 How Does Species Work? Utilizes local data Simple user interface Produces reports based on function
21 Using i-tree Species Input location, height, pollutant removal, and other functions Includes user input of importance values
22
23 UFORE - Hydro Management model designed to be relatively easy to use Object-oriented, physical based, semidistributed, topographic model TOPMODEL theory is used to simulate saturation excess overland flow (for forest area), base flow and ET process Warm weather, semi-distributed urban soilvegetation-atmosphere transfer scheme (SVATS) C++ code with GIS inputs
24 UFORE Hydro Strengths Specifically designed to incorporate urban tree and impervious surface effects on stream flow and water quality Built to simulate the dynamic forest interception, infiltration and ET processes as well as urban impervious effect on runoff generation. Calibrated against measure stream flow data Relatively easy to use
25 UFORE Hydro Weaknesses Lacks capabilities of fully-distributed model Currently does not allow for specific locational designs of tree cover, impervious cover, or retention/detention ponds (operates on general cover types) Works on watershed basis (with gauging station)
26 Model Inputs Hourly discharge data (USGS) Digital elevation map (USGS) Hourly weather and evaporation data Evaporation data calculated from weather data Structural information on watershed (NCLD and UFORE data) e.g., Tree cover Impervious cover Shrub and grass cover LAI
27 Model Calibration Auto calibrator (DOS Parameter Estimation (PEST) program) Iterative process Calibration results Peak flow weighted (CRF1) Base flow weighted (CRF2) Balanced flow (peak and base) (CRF3)
28 Model Calculations Topographic index with tree and impervious cover Interception routine Canopy parameters (throughfall, storage capacity, daily leaf and trunk area) Depression storage (impervious) Evaporation and transpiration from vegetation, soil and water surfaces Infiltration into soils Subsurface, overland and impervious runoff
29 Model Outputs For each time step (1 hour for these simulations): Canopy interception Depression storage Infiltration Evapotranspiration Surface and subsurface (base flow) runoff Channel discharge (total runoff)
30 Water Quality Separate program with inputs from UFORE Hydro files Multiple options that incorporate universal soil loss equation; buildup wash off routines Currently only using EMC Many other options need more input data Dissolved sediment / solid pollutant load Septic load Dissolved pollutant concentration
 3.5 Percent Shrub Cover 7.")
31 Baisman Run Watershed Area (m2) 3,844,800 Percent Impervious cover 0.2 Percent Tree Cover 68.7 Percent of Tree Cover over Impervious Area 5 Percent Water Cover 0 Average Tree Leaf Area Index (LAI) 3.5 Percent Shrub Cover 7.8 Percent Grass Cover 20 Percent Evergreen Trees 4.2 Percent Evergreen Shrubs 21 Shrub LAI 3.9 Leaf on Day 80 Leaf off Day 294
32 Baisman Run CRF1 = 0.56 CRF2 = 0.63 CRF3 = 0.70 Red Observed; Black - Modeled
33 Baisman Run 1,000, , , ,000 Runoff (m3/yr) 600, , , , , , Impervious Cover (%) Tree Cover (%)
34 Percent Change in Annual Stream Flow. Percent Change in Annual Stream Flow. Baisman Run Canopy held at 70% Impervious held at 10% Percent Impervious Cover Percent Tree Cover
35 Canopy
36 i-tree Canopy (v. 4.0)

37 You choose the cover classes

38 Classify random points
39 Statistics
40
41
42 Pest


43 Pest Pest Detection Protocol Collect Pest & Disease Signs Symptoms Reports Associated pest & diseases Trends/patterns

44 I-PED Pest Evaluation & Detection (beta) IPED Goal- detect pest and diseases in urban environments as soon as possible
45 Reporting by species, zone or street

46 IPED Online Diagnostic Key
47

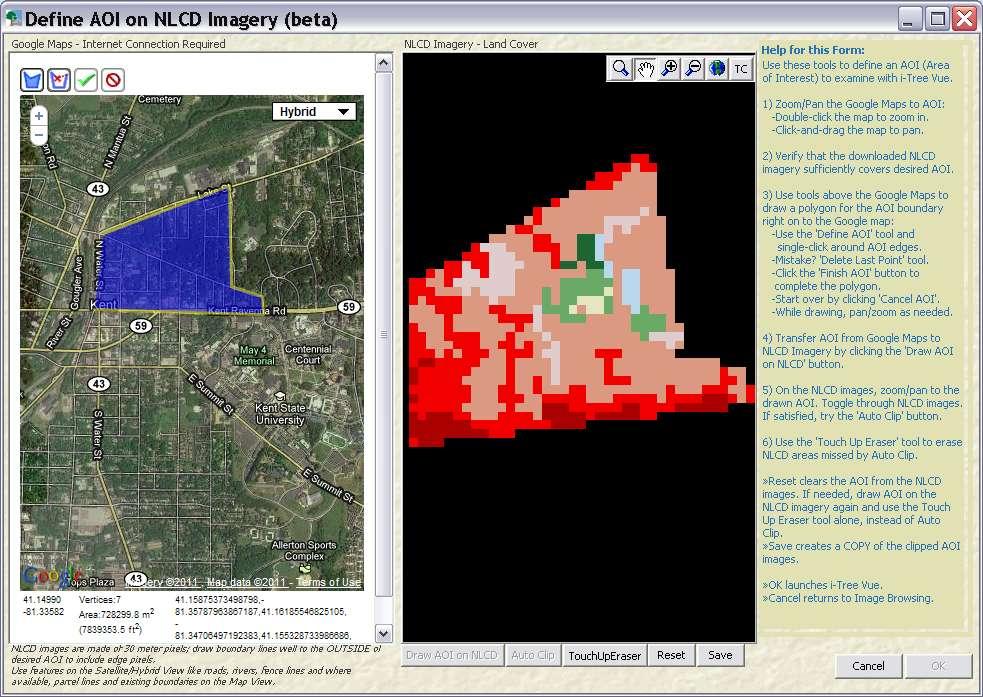
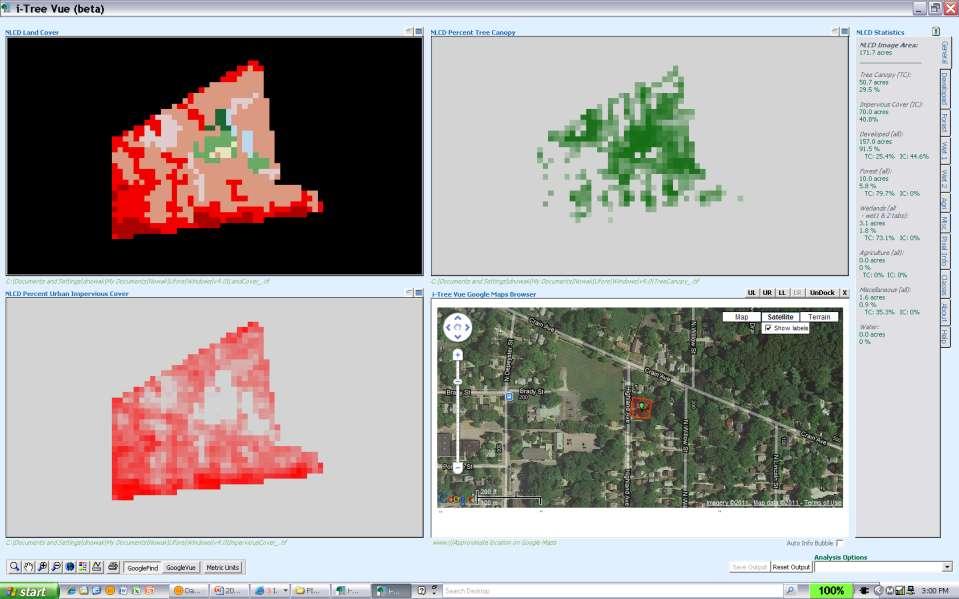
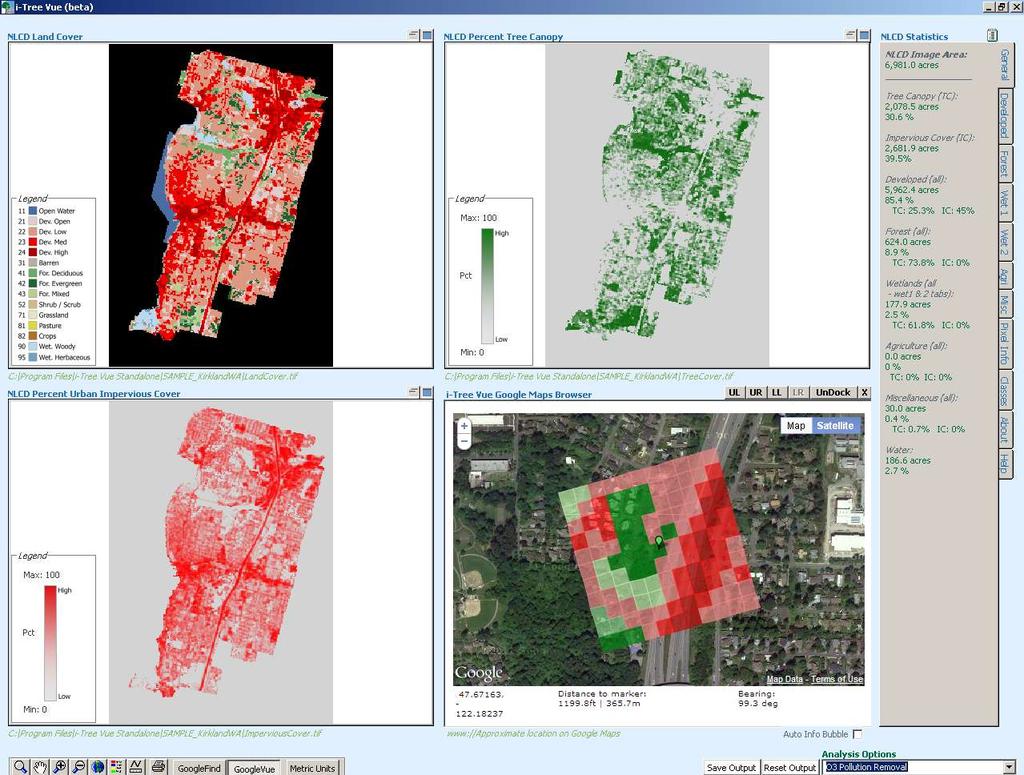
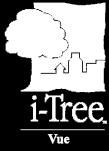
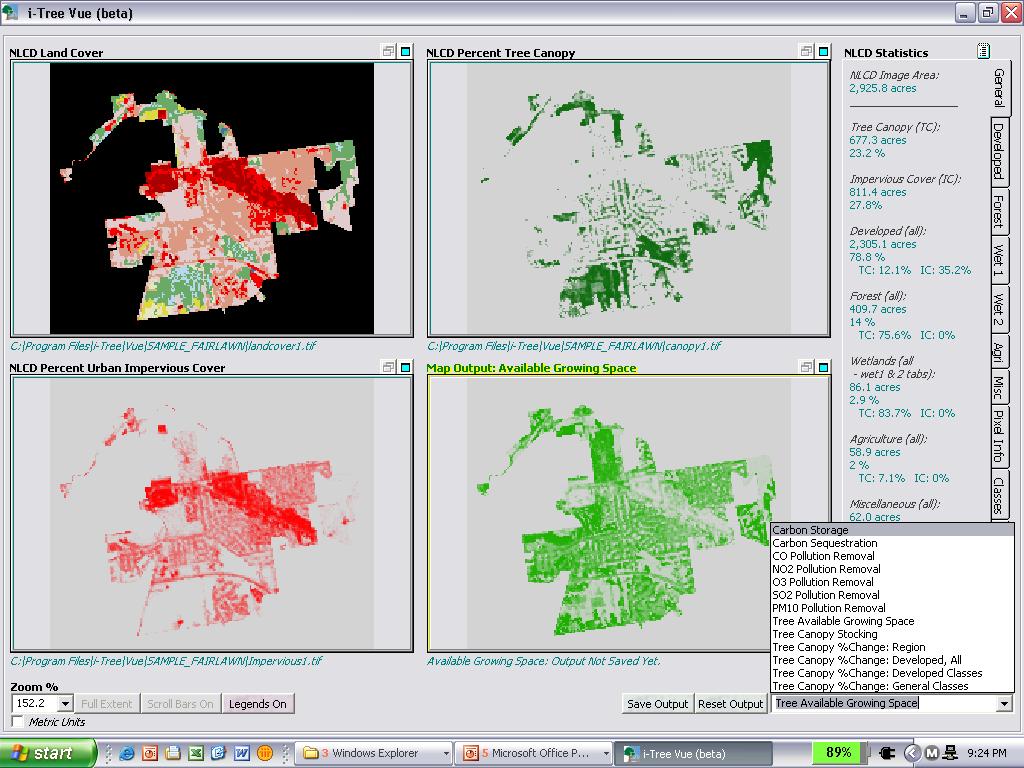
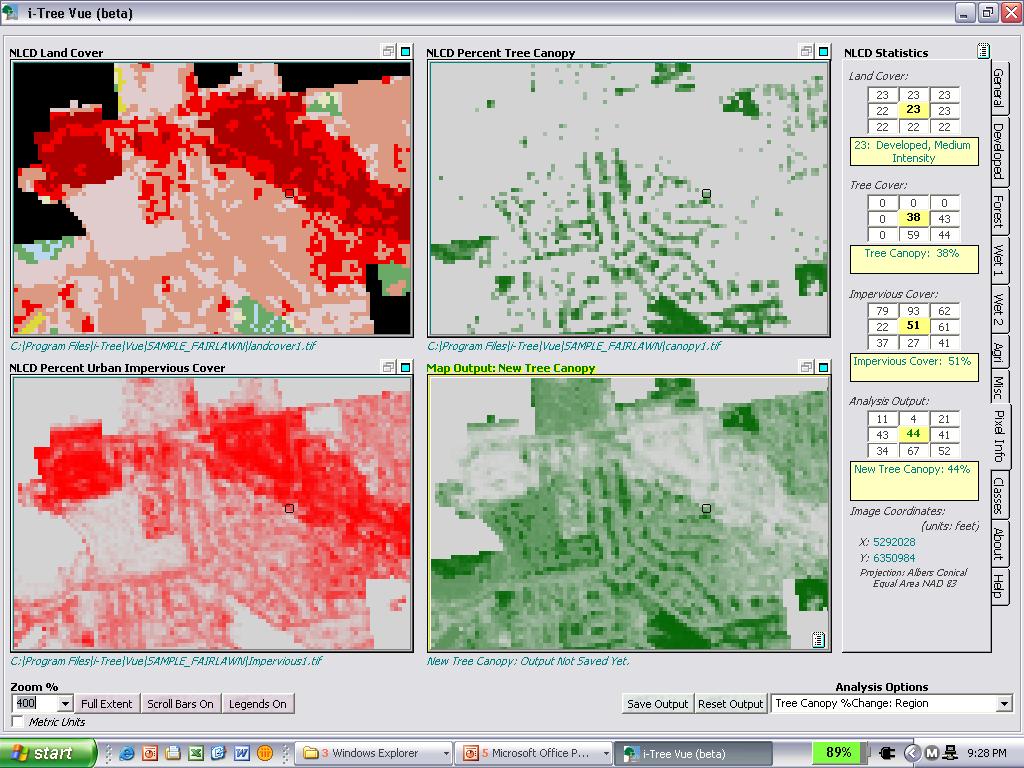
48 What Does Vue Do? Utilizes existing land cover data maps for analysis Provides modeling for future planting scenarios Analyzes canopy cover Illustrates ecosystem services
49 How Does Vue Work? Utilizes existing public data sets Produces simple maps Can be used at various scales

50 Vue Home Page
51 Vue Home Page
52
53
54
55
56
57
58 Main Navigation Window

59 Main Navigation Window

60 Analysis Tabs
61
62
63
64
65 Map Output Carbon Storage

66 Save Options
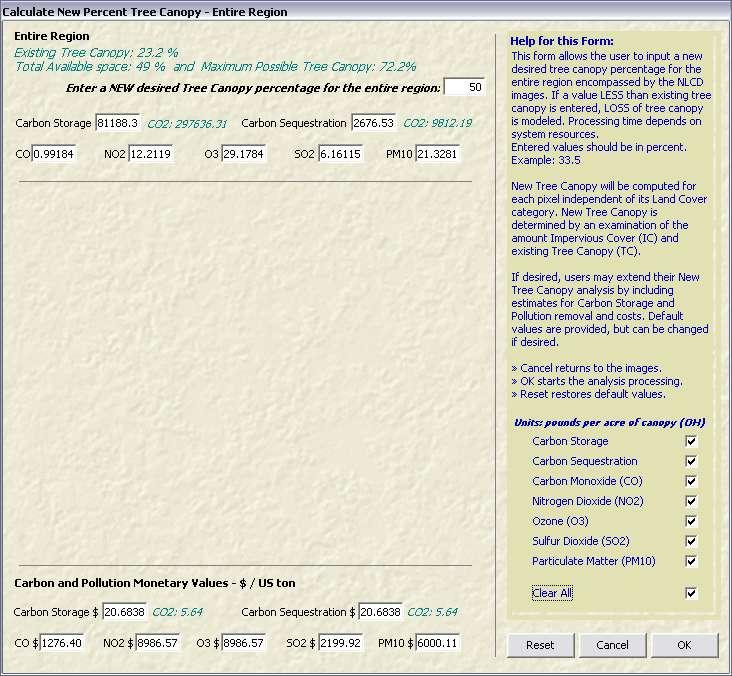
67 Analysis Report Carbon Storage

68 Map Output Canopy Stocking

69 Map Output Canopy Stocking

70 Analysis Report Canopy Stocking
71

72 Street Tree Storm Damage Estimates


73 The SDAP Process PLOT GENERATOR Random Plots Pre-Storm Sample Survey Estimating Engine Post-Storm Survey Final Damage

74 Questions? nrs.fs.fed.us/units/urban


75 How is an assessment done? i-tree Step 1 Determine Study Area


76 i-tree Step 2 Determine if inventory or sample
77 i-tree Step 2a Determine Number of Plots Typically 200 1/10 acre plots

78 i-tree Step 3 Determine what data to collect Required core variables (spp, dbh) Optional variables Crown parameters Tree health Distance to buildings Shrub data Ground cover data


79 i-tree Step 4 Lay sample points Random Pattern Random Grid Pattern Stratified by LU

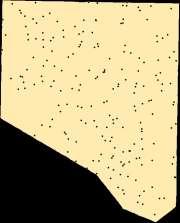
80 Random with no Stratification
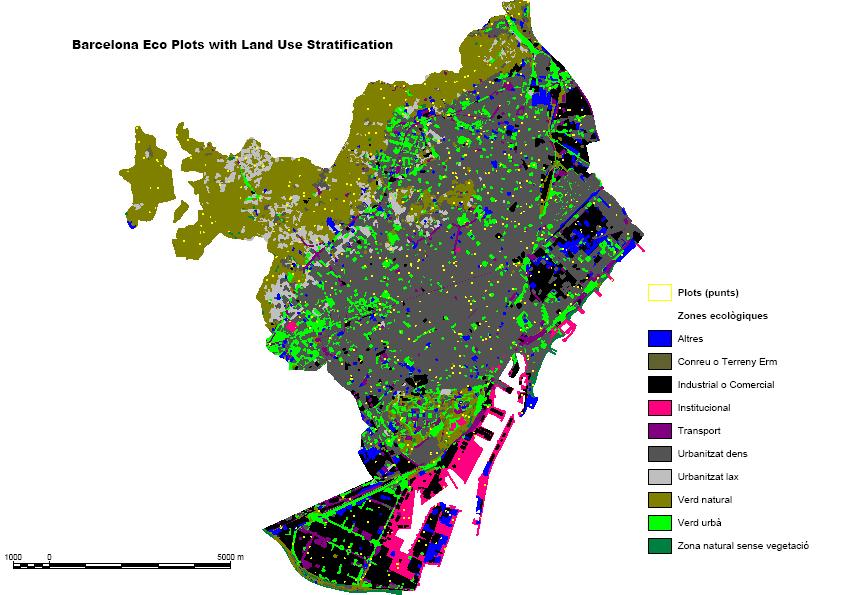
81 Random with Stratification

82 i-tree Step 5 Set up project


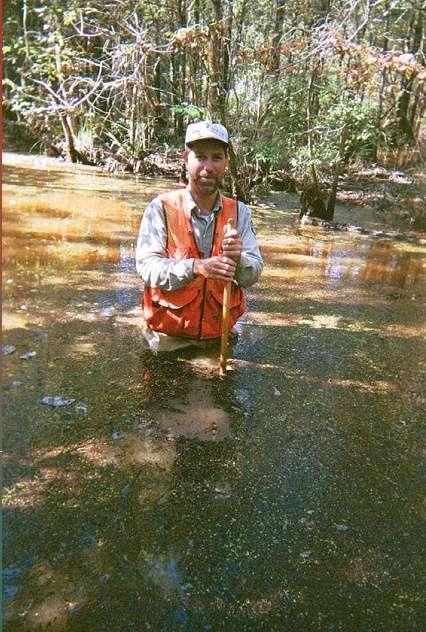
83 i-tree Step 6 Train crews and collect field data

84 i-tree Step 7 Enter data and analyze

85 i-tree analyses

86 i-tree Step 8 Use data and reports to make a difference Automatic Report Generator
David J. Nowak USDA Forest Service
 David J. Nowak USDA Forest Service Overview What is i-tree Eco? Background & Methods Project Steps Putting i-tree Eco to work Questions & Answers Assessing Urban Tree Populations i-tree Eco assesses: Structure
Quantifying Ecosystem Service and Values of the Urban Forest. David J. Nowak USDA Forest Service Northern Research Station Syracuse, NY, USA
 Quantifying Ecosystem Service and Values of the Urban Forest David J. Nowak USDA Forest Service Northern Research Station Syracuse, NY, USA Overview Ecosystem services Measuring services Top down Bottom
The Value of Your Urban Forest: i-tree Tools Al Zelaya The Davey Institute
 The Value of Your Urban Forest: i-tree Tools www.itreetools.org Al Zelaya The Davey Institute How do we communicate the value of the resource at risk? Evanston has over 4,000 ash trees on its parkways
Assessing Your Local Urban Forest. David J. Nowak USDA Forest Service Northern Research Station Syracuse, NY
 Assessing Your Local Urban Forest David J. Nowak USDA Forest Service Northern Research Station Syracuse, NY 1 Measurement is Critical Structure Function Value 2 Assessing Urban Forests Top-down approach
Valoración ambiental y económica de la infraestructura verde en las ciudades de Estados Unidos y su replicabilidad en Ciudades Chilenas
 Valoración ambiental y económica de la infraestructura verde en las ciudades de Estados Unidos y su replicabilidad en Ciudades Chilenas David J. Nowak USDA Forest Service Northern Research Station Syracuse,
Local Ecosystem Analysis Garland, Texas Calculating the Value of Nature
 April 2000 Local Ecosystem Analysis Garland, Texas Calculating the Value of Nature Report Contents 2 Project Overview and Major Findings 3 Urban Ecosystem Analysis Methods 4-5 Garland Study Sites 6 Analysis
USDA Forest Service. Davey Tree Expert Co. National Arbor Day Foundation Society of Municipal Arborists International Society of Arboriculture
 USDA Forest Service Research and Development State and Private Forestry Davey Tree Expert Co. National Arbor Day Foundation Society of Municipal Arborists International Society of Arboriculture Putting
Greening Oakland s Infrastructure Tree by Tree
 Greening Oakland s Infrastructure Tree by Tree Greg McPherson Environmental Lecture Series Oakland, CA March 5, 2008 Center for Urban Forest Research Vision Habitat for People Cities Without Trees Cities
Assessment of the Benefits of Ecosystem Restoration with i-tree Eco
 Assessment of the Benefits of Ecosystem Restoration with i-tree Eco Jason Henning, The Davey Institute and US Forest Service Philadelphia Urban Field Station Talk Outline What is i-tree? What does i-tree
Air Pollutant Removals, Biogenic Emissions and. Hydrologic Estimates for i-tree Applications
 Air Pollutant Removals, Biogenic Emissions and Hydrologic Estimates for i-tree Applications Satoshi Hirabayashi 1 Version 1.1 April 14, 2016 1 The Davey Tree Expert Company, 5 Moon Library, State University
So I just gave an overview of i-tree and more specifically, i-tree Eco. Now, let s get into the nuts and bolts of how to prepare for an Eco project.
 So I just gave an overview of i-tree and more specifically, i-tree Eco. Now, let s get into the nuts and bolts of how to prepare for an Eco project. 1 This presentation walks you through the process of
Regional Ecosystem Analysis Puget Sound Metropolitan Area
 Final Report: 7/25/98 Regional Ecosystem Analysis Puget Sound Metropolitan Area Calculating the Value of Nature Report Contents 2 Project Overview and Major Findings 3 Regional Level Analysis 4 Neighborhood
Tree Canopy Mapping & Modeling of Ecosystem Services for Georgia Communities
 Brown Bag Webinar March 31, 2010 Tree Canopy Mapping & Modeling of Ecosystem Services for Georgia Communities AGRICULTURE COMMERCIAL INDUSTRIAL/OFFICE PROW PUBLIC/SEMI-PUBLIC RESIDENTIAL VACANT 0 1,000
Using i-tree to Estimate Environmental Services. Eric Kuehler Technology Transfer Specialist USDA Forest Service
 Using i-tree to Estimate Environmental Services Eric Kuehler Technology Transfer Specialist USDA Forest Service ekuehler@fs.fed.us 706-559-4268 Why do we plant trees in cities? Aesthetic beauty What are
Second Wednesdays 1:00 2:15 pm ET USDA is an equal opportunity provider and employer.
 Second Wednesdays 1:00 2:15 pm ET www.fs.fed.us/research/urban-webinars USDA is an equal opportunity provider and employer. Eric Kuehler Science Delivery/Technology Specialist USDA Forest Service ekuehler@fs.fed.us
Benefits of Goshen s Public Trees. Stormwater Mitigation
 Chapter 3: Goshen s Benefit-Cost Analysis Public trees provide the City of Goshen a multitude of environmental and economic benefit savings equivalent to what the community may pay to manage their environment.
GreenPlan Modeling Tool User Guidance
 GreenPlan Modeling Tool User Guidance Prepared by SAN FRANCISCO ESTUARY INSTITUTE 4911 Central Avenue, Richmond, CA 94804 Phone: 510-746-7334 (SFEI) Fax: 510-746-7300 www.sfei.org Table of Contents 1.
Managing trees to reduce stormwater: i Tree Hydro can help
 Managing trees to reduce stormwater: i Tree Hydro can help Photo by Gary Simpson Catherine Deininger, Biocenosis LLC cdeininger@biocenosis.org www.biocenosis.org Roadmap 1. Trees as Green Infrastructure
Collaborative Urban Forest Studies in the GTA. May 12 th 2010 Meaghan Eastwood
 Collaborative Urban Forest Studies in the GTA May 12 th 2010 Meaghan Eastwood Outline Background Collaborative Urban Forest Studies Methodology Preliminary Results and Recommendations Next Steps 2 3 Background
An Analysis of Street Tree Benefits for
 An Analysis of Street Tree Benefits for By T. Davis Sydnor and Sakthi Subburayalu School of Environment and Natural Resources The Ohio State University Columbus, OH In cooperation with Green County Extension
Air Pollution Removal by Green Infrastructure and i Tree Software. David J. Nowak US Forest Service Syracuse, NY
 Air Pollution Removal by Green Infrastructure and i Tree Software David J. Nowak US Forest Service Syracuse, NY Overview Ecosystem services Vegetation and air pollution i-tree Management guidelines Percent
Environmental Benefits Analysis for Trees in Bowersville, Ohio
 Environmental Benefits Analysis for Trees in Bowersville, Ohio T. Davis Sydnor and Sakthi Subburayalu School of Environment and Natural Resources as well as Greene County Master Gardeners Ohio State University
Software for Sustainable Landscapes
 Software for Sustainable Landscapes Society of American Foresters National Convention 2005 Shelley Gardner Forester Center for Urban Forest Research Center for Urban Forest Research USDA Forest Service
STRATUM: The Benefits and Costs of the Green Infrastructure
 STRATUM: The Benefits and Costs of the Green Infrastructure Paula Peper, Center for Urban Forest Research, Pacific Southwest Research Station, USDA Forest Service Center for Urban Forest Research Demonstrate
The Digital Forest. Geospatial Technologies in Urban Forest Management. Justin Morgenroth New Zealand School of Forestry University of Canterbury
 The Digital Forest Geospatial Technologies in Urban Forest Management Justin Morgenroth New Zealand School of Forestry University of Canterbury Why Measure a Tree? Determine annual growth Determine value
ASSESSING THE VALUE OF URBAN FORESTS IN THE UNITED _,,_3 STATES
 FVUR }uai table ASSESSING THE VALUE OF URBAN FORESTS IN THE UNITED _,,_3 STATES David J. Nowak, John F. Dwyer, and Daniel E. Crane,, m,,2._.- ABSTRACT. Urban forests have value to society based upon the
Chicagoland Region i-tree Eco Assessment An analysis of the structure and function of the region s urban forest. Gary Watson
 Chicagoland Region i-tree Eco Assessment An analysis of the structure and function of the region s urban forest Gary Watson Partners: The Morton Arboretum -Data collection, funding, report preparation
Frequently Asked Questions about the UFORE model (www.ufore.org)
") Frequently Asked Questions about the UFORE model (www.ufore.org) What is UFORE? UFORE, which stands for Urban Forest Effects, is a science-based, peer-reviewed computer model designed to calculate urban
Frequently Asked Questions about the UFORE model (www.ufore.org) What is UFORE? UFORE, which stands for Urban Forest Effects, is a science-based, peer-reviewed computer model designed to calculate urban
Energy, Climate Change, Air Quality and Urban Greening
 Energy, Climate Change, Air Quality and Urban Greening Decision-Maker s Seminar Sacramento, CA June 21, 2010 Greg McPherson US Forest Service PSW Research Station Davis, CA Tree Quiz Bradford Pear 9 years
The Texas A&M University and U.S. Bureau of Reclamation Hydrologic Modeling Inventory (HMI) Questionnaire
 Questionnaire") The Texas A&M University and U.S. Bureau of Reclamation Hydrologic Modeling Inventory (HMI) Questionnaire May 4, 2010 Name of Model, Date, Version Number Dynamic Watershed Simulation Model (DWSM) 2002
The Texas A&M University and U.S. Bureau of Reclamation Hydrologic Modeling Inventory (HMI) Questionnaire May 4, 2010 Name of Model, Date, Version Number Dynamic Watershed Simulation Model (DWSM) 2002
The University of Arizona Campus Arboretum Tree Benefits Assessment
 The University of Arizona Campus Arboretum Tree Benefits Assessment - 2012 The landscaped grounds of the University of Arizona, Tucson, are rooted in the research and educational missions of the land grant
Environmental Benefits Analysis for Trees in Clifton, Ohio
 Environmental Benefits Analysis for Trees in Clifton, Ohio T. Davis Sydnor and Sakthi Subburayalu School of Environment and Natural Resources as well as Greene County Master Gardeners Ohio State University
Urban Ecosystem Restoration
 Urban Ecosystem Restoration Scott Courtright Coastal and Natural Resources Manager URS Assessing and Managing the Urban Forest and Calculating the Benefits 1 2 Natural Ecology Native soils Primarily-Native
Second Wednesdays 1:00 2:15 pm ET USDA is an equal opportunity provider and employer.
 Second Wednesdays 1:00 2:15 pm ET www.fs.fed.us/research/urban-webinars USDA is an equal opportunity provider and employer. Karen Cappiella Director of Research Center for Watershed Protection kc@cwp.org
Single most important determinant of the establishment and maintenance of specific types of wetlands & wetland processes
 Wetland Ecology Lectures 12 & 13 Wetland Hydrology Hydrology Single most important determinant of the establishment and maintenance of specific types of wetlands & wetland processes Starting point of hydrological
East Baton Rouge Parish Micro-Watershed Characterization
 26 th Annual Louisiana Remote Sensing and GIS Workshop José E. Villalobos-Enciso Warren L. Kron, Jr. April 28, 2010 Presentation Outline Objectives Warren Kron Data Warren Kron Concept José Villalobos
The Changing Urban Landscape. David J. Nowak US Forest Service Northern Research Station Syracuse, NY
 The Changing Urban Landscape David J. Nowak US Forest Service Northern Research Station Syracuse, NY Overview Factors of Change Changing Tree Cover Changing Species Composition Steps to Sustainability
Second Wednesdays 1:00 2:15 pm ET USDA is an equal opportunity provider and employer.
 Second Wednesdays 1:00 2:15 pm ET www.fs.fed.us/research/urban-webinars USDA is an equal opportunity provider and employer. Karen Cappiella Director of Research Center for Watershed Protection kc@cwp.org
Environmental Benefits Analysis of Trees for the Governor s Residence and Heritage Gardens
 Environmental Benefits Analysis of Trees for the Governor s Residence and Heritage Gardens T. Davis Sydnor and Sakthi Subburayalu School of Environment and Natural Resources and James Chatfield Department
Models Overview: Purposes and Limitations
 Models Overview: Purposes and Limitations Pollutant load originates from: Point-source discharges (NPDES facilities) Info is available on the discharges (DMRs, etc.) Some are steady-flow, others are precip-driven
GREEN INFRASTRUCTURE. An Introduction to. CITYgreen. Prepared by the Green Infrastructure Center Inc.
 An Introduction to CITYgreen Prepared by the Green Infrastructure Center Inc. August 20, 2010 Thanks to our funders! This project is funded in part by the Virginia Coastal Zone Management Program at the
THE IMPORTANCE OF NATURAL WATERSHED HYDROLOGY AND HOW TO ADVANCE IT IN URBAN AREAS
 THE IMPORTANCE OF NATURAL WATERSHED HYDROLOGY AND HOW TO ADVANCE IT IN URBAN AREAS Pacific Northwest Forest Hydrology Surface runoff rare, slow sheet flow when it occurs Trees Intercept rainfall, evaporate
NREM 407/507 WATERSHED MANAGEMENT Day 2
 NREM 407/507 WATERSHED MANAGEMENT 1-15-09 - Day 2 1. Review Hydrologic Cycle Terminology/Model 2. Summarize Differences Cropfield vs Perennial Watershed 3. Tues Lab Develop International River PPT bring
Environmental Benefits Analysis of Trees for Greenmount Cemetery in Springfield, Ohio
 Environmental Benefits Analysis of Trees for Greenmount Cemetery in Springfield, Ohio T. Davis Sydnor and Sakthi Subburayalu School of Environment and Natural Resources and Pamela J. Bennett Ohio State
Regional Ecosystem Analysis for Metropolitan Denver and Cities of The Northern Front Range, Colorado
 April 2001 Regional Ecosystem Analysis for Metropolitan Denver and Cities of The Northern Front Range, Colorado Calculating the Value of Nature Report Contents 2 Project Overview and Major Findings 5 Local
Modeling the Urban Stormwater (and the rest of the watershed) Katherine Antos, Coordinator Water Quality Team U.S. EPA Chesapeake Bay Program Office
 Katherine Antos, Coordinator Water Quality Team U.S. EPA Chesapeake Bay Program Office") Modeling the Urban Stormwater (and the rest of the watershed) Katherine Antos, Coordinator Water Quality Team U.S. EPA Chesapeake Bay Program Office May 13, 2010 Management Actions Chesapeake Bay Program
Modeling the Urban Stormwater (and the rest of the watershed) Katherine Antos, Coordinator Water Quality Team U.S. EPA Chesapeake Bay Program Office May 13, 2010 Management Actions Chesapeake Bay Program
Source: City of Salem Public Works Department. Salem, Oregon Potential Urban Tree Canopy Analysis AMEC Environment & Infrastructure 1
 GIS Anallysiis of Sallem s Potentiiall Urban Tree Augus tt 2011 Source: City of Salem Public Works Department Prepared for: The City of Salem, Oregon Public Works Department Prepared by: AMEC Environment
Unit 2: Geomorphologic and Hydrologic Characteristics of Watersheds. ENVS 435: Watershed Management INSTR.: Dr. R.M. Bajracharya
 Unit 2: Geomorphologic and Hydrologic Characteristics of Watersheds ENVS 435: Watershed Management INSTR.: Dr. R.M. Bajracharya Watersheds are hydro-geologic units Water flow and cycling are basic and
COMPENSATORY VALUE OF AN URBAN FOREST: AN APPLICATION OF THE TREE-VALUE FORMULA
 Journal of Arboriculture 19(3): May 1993 173 COMPENSATORY VALUE OF AN URBAN FOREST: AN APPLICATION OF THE TREE-VALUE FORMULA by David J. Nowak Abstract. Understanding the value of an urban forest can give
Monitoring Urban Forest Structure and Function after Hurricane and Assessing Ecosystem Services for Louisiana Cities
 Monitoring Urban Forest Structure and Function after Hurricane and Assessing Ecosystem Services for Louisiana Cities Kamran K. Abdollahi, PhD Urban Forestry and Natural Resources Southern University Agricultural
CAN URBAN TREES REDUCE THE IMPACT OF CLIMATE CHANGE ON STORM RUNOFF?
 University of Ljubljana Faculty of Civil and Geodetic Engineering CAN URBAN TREES REDUCE THE IMPACT OF CLIMATE CHANGE ON STORM RUNOFF? Katarina ZABRET, Mojca ŠRAJ spa-ce.net conference Ljubljana, 28 September
Environmental Benefits Analysis of Public Trees for Chillicothe, Ohio
 Environmental Benefits Analysis of Public Trees for Chillicothe, Ohio T. Davis Sydnor and Sakthi Subburayalu School of Environment and Natural Resources And Ann Bonner ODNR Urban Forestry December 4, 2012
Environmental Benefits Analysis of Trees for Beavercreek, Ohio T. Davis Sydnor and Sakthi Subburayalu School of Environment and Natural Resources
 Environmental Benefits Analysis of Trees for Beavercreek, Ohio T. Davis Sydnor and Sakthi Subburayalu School of Environment and Natural Resources February 25, 2011 January 29, 2008 An Analysis of Tree
1 THE USGS MODULAR MODELING SYSTEM MODEL OF THE UPPER COSUMNES RIVER
 1 THE USGS MODULAR MODELING SYSTEM MODEL OF THE UPPER COSUMNES RIVER 1.1 Introduction The Hydrologic Model of the Upper Cosumnes River Basin (HMCRB) under the USGS Modular Modeling System (MMS) uses a
Stormwater: Too Simple?
 Stormwater: Too Simple? Getting Closer to Advertised Level of Service Brandon Klenzendorf, Ph.D., P.E. 13 December 2017 - CWEA Fall Seminar Introduction Traditional approaches to solving stormwater problems
Using city tree inventory data as a tool of planning, management and economic valuation of ecosystem services provided by urban trees
 Using city tree inventory data as a tool of planning, management and economic valuation of ecosystem services provided by urban trees Eeva-Maria Tuhkanen Natural Resources Institute Finland Luke Researcher,
Environmental Benefits Analysis of Public Trees for Springfield, Ohio
 Environmental Benefits Analysis of Public Trees for Springfield, Ohio T. Davis Sydnor and Sakthi Subburayalu School of Environment and Natural Resources and Pamela J. Bennett Ohio State University Extension
I-3 THE IMPERVIOUS COVER MODEL
 I-3 THE IMPERVIOUS COVER MODEL AT A GLANCE Imperviousness is a metric that represents the sum of roads, parking lots, sidewalks, rooftops, and other impermeable surfaces that prevents water from infiltrating
BAEN 673 / February 18, 2016 Hydrologic Processes
 BAEN 673 / February 18, 2016 Hydrologic Processes Assignment: HW#7 Next class lecture in AEPM 104 Today s topics SWAT exercise #2 The SWAT model review paper Hydrologic processes The Hydrologic Processes
An Analysis of Environmental Benefits. Park Trees
 An Analysis of Environmental Benefits for Park Trees By T. Davis Sydnor and Sakthi Subburayalu School of Environment and Natural Resources The Ohio State University 2021 Coffey Road Columbus, Ohio 43210
Total Tons Stored: Total Tons Sequestered (Annually):
:") The CDP of Linton Hall, VA Rapid Ecosystem Analysis for 1992 Cropland: Pasture/Hay 1,646.3 31.0% Cropland: Row Crops 69.3 1.3% Forest: Deciduous Forest 2,191.4 41.2% Forest: Evergreen Forest 617.6 11.6%
The CDP of Linton Hall, VA Rapid Ecosystem Analysis for 1992 Cropland: Pasture/Hay 1,646.3 31.0% Cropland: Row Crops 69.3 1.3% Forest: Deciduous Forest 2,191.4 41.2% Forest: Evergreen Forest 617.6 11.6%
SOUTHEAST TEXAS CONTINUING EDUCATION
 EXAM No. 118 FLOOD - RUNOFF ANALYSIS 1. Information gained from flood - runoff analysis includes which one: A. Stage, discharge, volume. B. Measure depth, volume. C. Velocity, depth, storm occurrence.
Effect of forest management on water yields & other ecosystem services in Sierra Nevada forests UCB/UC Merced/UCANR project
 Effect of forest management on water yields & other ecosystem services in Sierra Nevada forests UCB/UC Merced/UCANR project Some motivating points Water is the highest-value ecosystem service associated
HYDROLOGIC CONSIDERATIONS. 22 nd Annual Nonpoint Source Pollution Conference Saratoga Springs, NY
 LOW IMPACT DEVELOPMENT HYDROLOGIC CONSIDERATIONS 22 nd Annual Nonpoint Source Pollution Conference Saratoga Springs, NY May 18, 2011 PRESENTATION AGENDA Introduction Definitions Discuss Impacts to Hydrologic
WWHM4 MODELING USING NATIONAL MAP
 WWHM4 MODELING USING NATIONAL MAP Clear Creek Solutions, Inc., 2010 How to create a project that uses national data. WWHM4 is one of the most powerful continuous simulation hydrologic models available.
Recommendations for the Expert Panel to Define BMP Effectiveness for Urban Tree Canopy
 Recommendations for the Expert Panel to Define BMP Effectiveness for Urban Tree Canopy Summary of Recommendations to the Forestry Work Group May 4, 2016 1 Panel Scope Recommendations for Phase 6 CBWM only
Rangeland Watersheds. Maintenance and provision of genetic resources Maintenance and regeneration of habitat Provision of shade and shelter
 Rangeland Watersheds What is a Watershed? A surface water designation The area that flows into a distinct drainage (i.e., stream, river, creek, pond) Separated from other watershed by ridge-top boundaries.
Total Tons Stored: Total Tons Sequestered (Annually):
:") The CDP of Woodbridge, VA Rapid Ecosystem Analysis for 1992 Cropland: Pasture/Hay 602.7 8.7% Cropland: Row Crops 4.0 0.1% Forest: Deciduous Forest 1,809.3 26.3% Forest: Evergreen Forest 97.8 1.4% Forest:
The CDP of Woodbridge, VA Rapid Ecosystem Analysis for 1992 Cropland: Pasture/Hay 602.7 8.7% Cropland: Row Crops 4.0 0.1% Forest: Deciduous Forest 1,809.3 26.3% Forest: Evergreen Forest 97.8 1.4% Forest:
ISA Arborist Cer-fica-on Training Chapter 14 - Urban Forestry
 ISA Arborist Cer-fica-on Training Chapter 14 - Urban Forestry Illinois Arborist Association Arborist Certification Training September 1, 2015 Presented by: Ben Reynoso & Eva Saunders Natural Path Urban
A Method for Examining the Ecosystem Services of Roadside Trees: Springfield, Massachusetts
 Ross Kahn University of Massachusetts Department of Landscape Architecture & Regional Planning April 2016 A Method for Examining the Ecosystem Services of Roadside Trees: Springfield, Massachusetts Photo
Why Tree Canopy Land Uses in Phase 6?
 Why Tree Canopy Land Uses in Phase 6? Since 2003, it has been the policy of the Chesapeake Bay Program partners to increase urban tree canopy cover for water quality and other benefits Reaffirmed and strengthened
Learning Lab Learning About Tree Benefits Using i-tree Canopy
 P2 / ORGANIZATION Learn about the supplies, P3/ INSTRUCTIONAL PROCESS This section provides an P4 / TREE CANOPY In this section, discover the P5 / DATA PROCESSING This section provides resources and learning
Hydromodification Computer Modeling
 Hydromodification Computer Modeling Douglas Beyerlein, P.E. Clear Creek Solutions, Inc. 15800 Village Green Drive #3 Mill Creek, WA 98012 beyerlein@clearcreeksolutions.com Phone: 425.892.6454 Introduction
Co-Benefits of Green Infrastructure: An Environmental and Economic Analysis of the Save the Rain Program
 Co-Benefits of Green Infrastructure: An Environmental and Economic Analysis of the Save the Rain Program Zachary Monge, P.E. CH2M Syracuse NYSAWWA/NYWEA Joint Energy Conference November 16, 2016 Co-Authors:
i-tree User Group Meeting 2011 Partners in Community Forestry Conference
 i-tree User Group Meeting 2011 Partners in Community Forestry Conference Agenda State of i-tree (30 mins) Where is i-tree today? Where is i-tree going? Discussion (30 mins) User question & answer period
L-THIA Online and LID in a watershed investigation
 L-THIA Online and LID in a watershed investigation Larry Theller Agricultural and Biological Engineering, Purdue University Great Lakes Sedimentation Workshop Ann Arbor Mi. L-THIA On-line watershed delineation
A Tool To DeTerMIne CroWn AnD PloT CAnoPy TrAnSPArenCy For ForeST InvenTory AnD AnAlySIS PHASe 3 PloTS USInG DIGITAl PHoToGrAPHS
 2010 Joint Meeting of the Forest Inventory and Analysis (FIA) Symposium and the Southern Mensurationists A Tool To DeTerMIne CroWn AnD PloT CAnoPy TrAnSPArenCy For ForeST InvenTory AnD AnAlySIS PHASe 3
Water Data Needs and Applications in the Private Sector. Robert Annear, Vice President, Ph.D., P.E. Water is our nature
 Water Data Needs and Applications in the Private Sector Robert Annear, Vice President, Ph.D., P.E. Water is our nature GRN Forum: Global Water - 2010 and Beyond Oct 21 2010 - Oct 22 2010 Introduction Our
6.0 Runoff. 6.1 Introduction. 6.2 Flood Control Design Runoff
 October 2003, Revised February 2005 Chapter 6.0, Runoff Page 1 6.1 Introduction 6.0 Runoff The timing, peak rates of discharge, and volume of stormwater runoff are the primary considerations in the design
Climate- Proofing Arizona s Urban Forests, One Community at a Time
 Climate- Proofing Arizona s Urban Forests, One Community at a Time Dr. Greg McPherson US Forest Service, PSW Davis, California U.S. Department of Agriculture Pacific Southwest Research Station Science
Hydrologic Modeling with the Distributed-Hydrology- Soils- Vegetation Model (DHSVM)
") Hydrologic Modeling with the Distributed-Hydrology- Soils- Vegetation Model (DHSVM) DHSVM was developed by researchers at the University of Washington and the Pacific Northwest National Lab 200 Simulated
Hydrologic Modeling with the Distributed-Hydrology- Soils- Vegetation Model (DHSVM) DHSVM was developed by researchers at the University of Washington and the Pacific Northwest National Lab 200 Simulated
Assessing Urban Forest Effects and Values: Douglas County, Kansas
 United States Department of Agriculture Assessing Urban Forest Effects and Values: Douglas County, Kansas David J. Nowak Allison R. Bodine Robert E. Hoehn III Alexis Ellis Kim Bomberger Daniel E. Crane
Maximizing the Environmental Services and Value of Plano s Urban Forest
 Maximizing the Environmental Services and Value of Plano s Urban Forest 2014 City of Plano Urban Forest Ecosystem Assessment Micah Pace Urban Forestry Consultant Preservation Tree Services, Inc. Climate
Ecosystem Services BUCK KLINE AND VIJAY A SATYAL
 Ecosystem Services BUCK KLINE AND VIJAY A SATYAL CO 2 Presented to USDA Economists Group Washington DC May 14, 2008 CO 2 External Costs The loss of many of these ecosystem services is a social cost. It
Supporting Online Material for
 www.sciencemag.org/cgi/content/full/318/5853/1107/dc1 Supporting Online Material for Hurricane Katrina s Carbon Footprint on U.S. Gulf Coast Forests Jeffrey Q. Chambers,* Jeremy I. Fisher, Hongcheng Zeng,
Metropolitan Washington Regional Tree Canopy Workgroup
 Metropolitan Washington Regional Tree Canopy Workgroup Overview Michael Knapp, Chair Fairfax County Brian LeCouteur, Committee Liaison MWCOG Anacostia Watershed Steering Committee January 10 th, 2014 1
STRATUM: The who, what, when, where and how of street trees
 STRATUM: The who, what, when, where and how of street trees Paula Peper, Center for Urban Forest Research, Pacific Southwest Research Station, USDA Forest Service Center for Urban Forest Research USDA
An Analysis of Environmental Benefits for Canfield Fairground Trees
 An Analysis of Environmental Benefits for Canfield Fairground Trees By T. Davis Sydnor and Sakthi Subburayalu School of Environment and Natural Resources The Ohio State University and Mahoning County Extension
The Urban Forest of New York City
 United States Department of Agriculture The Urban Forest of New York City Forest Service Northern Research Station Resource Bulletin NRS-117 September 2018 Abstract An analysis of the urban forest in New
TOPMODEL. Download Information Availability: Nonproprietary, (http://www.es.lancs.ac.uk/hfdg/topmodel.html) Cost: None for non-commercial uses.
 Cost: None for non-commercial uses.") TOPMODEL Contact Information Keith Beven Department of Environmental Science Institute of Environmental and Natural Sciences Lancaster University Lancaster LA1 4YQ United Kingdom +44 (0)1524 593892 K.Beven@lancaster.ac.uk
TOPMODEL Contact Information Keith Beven Department of Environmental Science Institute of Environmental and Natural Sciences Lancaster University Lancaster LA1 4YQ United Kingdom +44 (0)1524 593892 K.Beven@lancaster.ac.uk
SOCIAL AND HEALTH BENEFITS
 1. Why do communities make a special effort to conserve trees? The reasons to conserve trees are numerous. Trees and forests evoke emotions that cannot be quantified. They form biological communities that
Insect pests, warming, and the future of forests. Emily K. Meineke, Elsa Youngsteadt, Adam G. Dale, Robert R. Dunn, & Steven D.
 Insect pests, warming, and the future of forests Emily K. Meineke, Elsa Youngsteadt, Adam G. Dale, Robert R. Dunn, & Steven D. Frank Over 50% of people worldwide live in cities. City environments are increasingly
Phoenix s Urban Forest
 Phoenix s Urban Forest Rises Up to Meet Municipal Challenges Richard Adkins, Forestry Supervisor City of Phoenix Dana Karcher, Market Manager Western Region Davey Resource Group What is the Urban Forest
Green Infrastructure Asset Management in York, Ontario. Matthew Rodwell Karen Robichaud
 Green Infrastructure Asset Management in York, Ontario Matthew Rodwell Karen Robichaud Ontario: pop. 13.5m (38%) Region of York: pop. 1.11m Regulation: O. Reg. 588/17 regulates asset management planning
Scale Effects in Large Scale Watershed Modeling
 Scale Effects in Large Scale Watershed Modeling Mustafa M. Aral and Orhan Gunduz Multimedia Environmental Simulations Laboratory School of Civil and Environmental Engineering Georgia Institute of Technology
Land Modeling II - Biogeochemistry: Ecosystem Modeling and Land Use Dr. Peter Lawrence
 Land Modeling II - Biogeochemistry: Ecosystem Modeling and Land Use Dr. Peter Lawrence Project Scientist Terrestrial Science Section Climate and Global Dynamics Division (With thanks to TSS and IAM groups
Second Wednesdays 1:00 2:15 pm ET USDA is an equal opportunity provider and employer.
 Second Wednesdays 1:00 2:15 pm ET www.fs.fed.us/research/urban-webinars USDA is an equal opportunity provider and employer. Eric Kuehler Science Delivery/Technology Specialist USDA Forest Service ekuehler@fs.fed.us
Hydrological Impact of Large Scale Conversion of Rubber to Oil Palm Plantation
 2014 International SWAT Conference Pernambuco, Brazil [July 30 - August 1, 2014] Mature rubber Oil palm Hydrological Impact of Large Scale Conversion of Rubber to Oil Palm Plantation Source: Google earth
Module 10b: Gutter and Inlet Designs and Multiple Design Objectives
 Module 10b: Gutter and Inlet Designs and Multiple Design Objectives Bob Pitt University of Alabama and Shirley Clark Penn State Harrisburg Evening traffic plows through high water at the intersection of
The Urban Forest Effects (UFORE) Model: Field Data Collection Manual
 Model: Field Data Collection Manual") The Urban Forest Effects (UFORE) Model: Field Data Collection Manual David J. Nowak, Daniel E. Crane, Jack C. Stevens and Robert E. Hoehn USDA Forest Service, Northeastern Research Station 5 Moon Library,
The Urban Forest Effects (UFORE) Model: Field Data Collection Manual David J. Nowak, Daniel E. Crane, Jack C. Stevens and Robert E. Hoehn USDA Forest Service, Northeastern Research Station 5 Moon Library,