Oregon Spatial Analysis Project
|
|
|
- Beverly French
- 6 years ago
- Views:
Transcription


1 Oregon Spatial Analysis Project Oregon Department of Forestry June 2006
2 Table of Contents Executive Summary... 1 Introduction... 3 Background... 3 History of Forest Stewardship and Spatial Analysis Projects... 4 Vision for Spatial Analysis in implementing the National Forest Stewardship Program... 5 Spatial Analysis Project... 7 Oregon s Non-Industrial Private Forest Ownership... 7 Selection and Weighting of Data Layers... 8 o Additional data layers... 8 o Weighting... 9 o Data Layer Descriptions... 9 Opportunities... 9 Riparian Corridors... 9 Conservation Opportunity Areas... 9 Priority Zoning Forest Patch Size Public Water Supply Areas Private Individual Forestland Activity Forest Soils Capability Threatened & Endangered Species Proximity to Public/Industrial Forestland Wetlands Topography Threats Wildfire Risk Insect and Diseases Risk Development Community Interface Management Planning Data Spatial Analysis o SAP Process Non Industrial Private Lands Mask GIS Analysis Landowner Management Plan Activities o Prioritization and Existing Management Plans Forest Stewardship on Non-Forest Lands Forest Stewardship on Non-Industrial Private Forest Lands Assessment of Spatial Analysis Spatial Analysis as a Management Tool Suitability of USDA-FS Northeastern Area Protocols o Weighting o Non-forest, Non-developed o Federal Forests Recommendations for Modifying Northeastern Area Protocols o Regional Priorities o Assessment of Non-Forest Lands o Analysis of Data by Forest Sectors... 22
3 Summary Appendices National Land Cover Database Tables Maps 1: Potential for Forest Stewardship Program Benefits on Non-industrial Private Lands 2: Potential for Forest Stewardship Program Benefits and Existing Management Plan 3: Forest Stewardship Program Potential on Non-industrial Private Forest Lands and Existing Management Plans 4: Resource Richness 5: Resource Threats 6: Forest Stewardship Potential on Non-forest, Non-developed Lands 7: Regional Map of Pudding/Molalla Watershed 8: Oregon Forest Land Ownership
4 Executive Summary The Oregon Department of Forestry (ODF) along with three other Western US states were provided USDA-Forest Service grants to test the value of spatial analysis projects that used a set of protocols established by the Forest Service s Northeastern Area and partnering state forestry agencies. This report provides the findings of Oregon s analysis, assessment of using the established Northeastern protocols in the Pacific Northwest, and recommendations for modifying the protocols to better fit Oregon s conditions and issues. This GIS analysis project has four primary goals: 1) to better understand and prioritize the relative importance of non-industrial private (NIP) lands, 2) to identify the location of past management planning and evaluate the locations of these plans in relationship to the newly defined priority areas, 3) to use the findings to help direct future FSP efforts, and 4) evaluate the appropriateness of using a set of protocols established in the Northeastern United States. ODF recognizes additional benefits beyond meeting these goals. Spatial analysis can assist in managing its full Private Forest Program and can help as an analytical tool when addressing forest policy issues. A national objective is to have a country wide analysis completed state by state. Participating states are being asked to use a given set of 11 data layer themes and to follow an establish set of procedures and standards for displaying results. States have the freedom to add additional GIS data layers needed to describe local conditions, and to weight each data layer to best reflect is level of importance. Oregon used three additional data layers: NIPF Activities, Conservation Opportunity Areas, and Soil Productivity. The standard data layers themes include: Riparian Corridors, Forest Patches, Public Water Supply Areas, Priority Watersheds, Threatened & Endangered Species, Proximity to Public Forestlands, Wetlands, Topographic, Wildfire Risk, Insect and Disease Risks, and Development Risk. ODF worked with the Oregon Forestland Coordinating Group, its Forest Stewardship committee, in establishing weighting factors for each data layer. These data layers and weighting factors focus on NIPF issues. The analysis provides a priority value for each 300 by 300 foot cell (2.07 acres) of NIP lands across the state. These cells were then grouped into high, medium, or low categories. NIP land was identified through a process of elimination. First, all forestland was identified along with other private land capable of growing trees and not developed. Next, public and industrial forests were removed. What remain were nonindustrial private forests and non-forested/non-developed (agricultural) lands. A management plan layer of Forest Stewardship and Tree Farm plans was digitized from existing databases, County Assessor digital tax lot information, and local field forester input. Oregon SAP Project Report 7-7.doc/Jaz F (PF) 1 07/10/2006
5 The GIS analysis is displayed in a set of seven maps and associated tables. Results of the study show just over 21 percent of Oregon NIPF lands are covered by a multiresource management plan. Forty six percent of the plans and 22 percent of the NIPF plan acres are on High Priority lands; 47 percent of the plans and 29 percent of the NIPF acres are on Medium. Just eight percent of the plans are on Low Priority lands, but these plans represent 49 percent of the acres under management plans. The spatial analysis strategy developed in the Northeastern U.S. has a lot of value for other states. In addition, their approach of developing flexibility unto the process to allow for the varying conditions and issues across the county will provide a more accurate picture nationally and make this tool more valuable locally. Oregon discovered three areas where the Northeastern protocols don t fit conditions and issues in Oregon. A single state-wide weighting strategy is problematic for a state with diverse forest and social conditions. The value of weighting also becomes an issue as additional data layers are added to the analysis. Each added layer reduces the significance of individual layer s weighting. The second area where Oregon s conditions don t fit well is in evaluating nonforested/non-developed private lands. The Northeastern protocol lists these farm lands as potential forestland, but Oregon does not have the conversion of farm to forest as an objective. The third area where the provided protocols don t work well is in assigning a value to owning forestland near federal forests. The model has this as a positive, but while there are many areas in Oregon where this is true, there are also many other areas where proximity to federal forests in a negative. ODF has three recommendations with regards to developing a national set of standards/protocols for spatial analysis. They are: 1) allow for sub-state weighting of data layers to more accurately identify priority forestlands, 2) have the evaluation of agricultural lands as optional, and 3) design a multi-phased analysis process that first identifies the state or sub-state economic, environmental, and social importance of NIPF forestland and then combines the three sectors into a one weighting according to each sector s importance at the level being studied. In summary, spatial analysis is a great tool to both better understanding issues facing NIPF landowners, and to be more effective in addressing identified natural resource issues. The Forest Service s Northeast Area and partnering states have provided a valuable service to the rest of the nation for their initial efforts. With states across the country facing different conditions and issue, it will take additional time and work to establish a national protocol for using spatial analysis to manage FSP and other landowner assistance programs at both the state and national level. Oregon SAP Project Report 7-7.doc/Jaz F (PF) 2 07/10/2006
6 Introduction USDA-Forest Service and state forestry agencies have a long standing partnership that began in the late 1940s promoting the protection and improvement of private forestland. Current efforts are defined in the Cooperative Forestry Assistance Act of 1978 and have the Forest Stewardship Program (FSP) of 1990 as the primary program for assisting family and other non-industrial forest landowners. The focus of this Spatial Analysis project is to assist the Forest Service and state forestry agencies in the administering and monitoring of FSP, but this analysis is part of a rapidly growing use of Geographic Information Systems (GIS) to improve the understanding and management of natural resources, and can be used to support the broader goals of supporting sustainable forest management on private forest lands. A national spatial analysis has merit, and the Oregon Department of Forestry (ODF) fully supports a national spatial analysis effort. FSP has been very successful as a national program in promoting sustainable forest management. Comparing today s national and state strategies for assisting NIPF landowners with those of 1990 when FSP was introduced demonstrates the value of the program. Multi-resource management planning, the hallmark of FSP, is now an accepted standard. Today, few think solely of timber production when considering forest planning. Efforts such as spatial analysis can strengthen FSP and other assistance efforts, and benefit landowners, states, and the nation. Definitions: For this report, the terms family forest landowners and non-industrial private forest (NIPF) landowners are interchangeable. For Oregon the term nonforest/non-developed land primarily describe agricultural land; and therefore, the two are used interchangeably. Non-industrial Private (NIP) represents both NIPF and agricultural lands. NIPF landowners are defined as individuals, partnerships and privately held corporations that have less than 25 percent of their income coming from a primary forest products milling facility, and do not employ a professional forestry staff. Landowners with more than 5,000 acres were identified and then individually classified as industrial or non-industrial with the assistance of local ODF foresters. (It takes significantly more forested acres in Eastern Oregon s lower site class areas than in Western Oregon to support a family.) Forestland has been identified using the National Land Cover Database (NLCD) (Appendix 1). The Oregon Forestland Coordinating Group (OFCG) serves as the state s Forest Stewardship Coordinating Committee. Background The USDA-Forest Service Northeast Area, in partnership with four state forestry agencies, developed a GIS process for mapping lands eligible for the FSP, prioritizing them, and overlaying these lands with existing forest stewardship plans in support of administering the FSP. After these four states completed their spatial analysis project in , the Forest Service invited Western states to take on spatial analysis projects to test the appropriateness of their analysis strategy for other regions of the county. In Oregon SAP Project Report 7-7.doc/Jaz F (PF) 3 07/10/2006
7 June of 2004 Oregon was one of four Western states that volunteered to participate in a Spatial Analysis Project (SAP). Since then, all states have been invited and encouraged to complete analysis projects as part of a national strategy to use GIS analyses to improve and monitor the Forest Stewardship Program. History of Forest Stewardship and Spatial Analysis Projects The Forest Stewardship Program (FSP) was established in the 1990 Farm Bill to assist NIPF landowners in the management of their lands through professionally prepared forest stewardship plans, technical assistance and improved coordination of landowner assistance through the establishment of state coordinating committees. FSP also marked the official move from timber resources to multiple resource management. As a component of the Cooperative Assistance Act, FSP is implemented through a Forest Service - state forestry partnership. FSP has forest stewardship planning as a priority focus of its landowner assistance effort. Stewardship plans developed with the assistance of resource professionals record individual landowner s forest management objectives; evaluate their timber, wildlife, fish, water, soils, aesthetics, and other associated forest resources; and establish an action plan for the management of these resources. The FSP has as a national program successfully met the intent of the program with more than 25 million acres of family forestland plans being developed. During this same time period the American Tree Farm System and other NIPF assistance efforts have expanded their landowner management plan standards to include economic, ecological and social forest resources. There is a need to evaluate the effectiveness of FSP with its 10 plus years of efforts in assisting landowners in the development of stewardship management plans. Major questions such as how effective is FSP in its use of stewardship planning as the focus of its landowner assistance, and how can the FSP be more effective in assisting landowners toward their forest management objectives need answers. While landowner assistance programs and FSP in particular are developed to address national and local needs, their approaches are largely through assisting individual landowners. These efforts were not set up to address accumulative effects from individual forest landowner improvement, nor where they were established, with built-in monitoring strategies. With the technological advances in GIS, it now appears that there are cost effective ways to evaluate and monitor landowner assistance efforts, and over time adapt administrative processes in response to these findings to improve the effectiveness of these efforts. Oregon SAP Project Report 7-7.doc/Jaz F (PF) 4 07/10/2006
8 Vision for Spatial Analysis in implementing the Forest Stewardship Program Using GIS for spatial analyses, the USDA-Forest Service and state forestry agencies can track and display FSP activities over the landscape and over time. Through GIS analysis, resource data dealing with multiple issues can be mapped and analyzed. FSP managers can benefit from knowing more about the location of stewardship plans across the landscape, and potential opportunities where individual landowner planning can address key larger scale resource needs. Spatial analysis can also assist regional and national FSP managers to address program effectiveness and public funds accountability. The FSP Spatial Analysis Project (SAP) is an effort to provide a consistent methodology across the country to evaluate and prioritize natural resource issues, while at the same time offering states the ability to customize collection and analysis of pertinent data to spatially display: Important forest lands (rich in natural resources, vulnerable to threat, or both); Existing stewardship tracts (properties under management plans); and Areas of opportunity to focus future FSP efforts (stewardship potential). Each state s project addresses the following questions, as they relate to the FSP: Where are the state s NIPF lands? Where are the management plans? Where are the state s priority NIPFs (those lands of highest potential to benefit from active forest management)? What percentage of existing NIPF management plans are on the state s priority family forest lands? Are there opportunities to modify program delivery to increase forest management activities in high priority areas? With additional GIS data layers, spatial analyses can also be used to: Assess program effectiveness in serving state-identified critical resource management needs. Relate factors such as completed cost/share practices, landowner activities, and monitoring data to help determine program strategies and effectiveness. Establish future practices that can improve effectiveness in addressing priority needs based on landscape scale resource issues. Determine the economic, environmental and social importance of NIPFs. Provide additional information and clarity when addressing a broad range of forest policy issues. There are seven major components to Oregon s Forest Stewardship Program Spatial Analysis Project. Three deal with the development of GIS based data, and four deal with the analysis of this data. They include: Development of a GIS generated statewide forest ownership map showing the public and private ownership categories. Oregon SAP Project Report 7-7.doc/Jaz F (PF) 5 07/10/2006
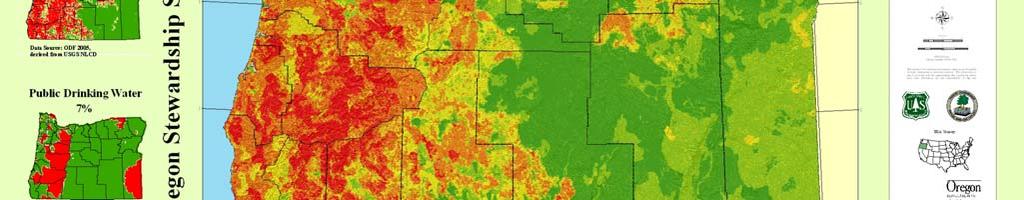
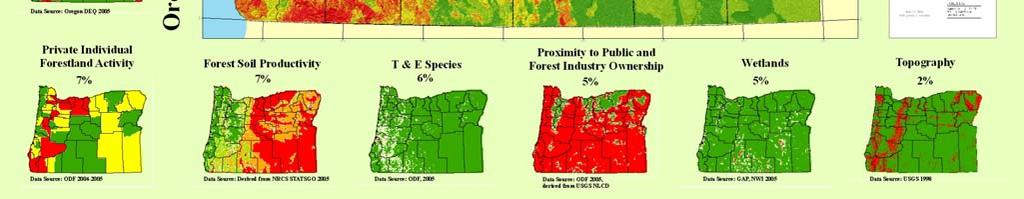
9 Development of a historic management plan database and associated georeferenced map of existing stewardship and Tree Farm plans. Development of a statewide assessment of NIPF lands incorporating spatial and tabular data to display the importance of and potential threat to these forests. Analysis of the location of lands currently under management plans and how they relate to the forest lands defined through this project as priority. Assessment of how the state can use the results of GIS processes to guide future landowner assistance activities in conjunction with other programs available to NIPF landowners. Assessment of how this SAP model developed in the Forest Service s Northeast Area fits when used to address similar FSP issues in a Pacific Northwest state. Recommendations for modifying the spatial analysis protocols to better fit Western states conditions and issues. Wildfire Developing Areas Forest Health Riparian Corridors Conservation Areas Zoning Forest Patch Public Drinking Water Private Forestland Activity Forest Soil Productivity Threatened & Endangered Species Proximity to Public Forestland Wetlands Topography Oregon SAP Project Report 7-7.doc/Jaz F (PF) 6 07/10/2006
10 Spatial Analysis Project Oregon s Non-Industrial Private Forest Ownership Family and other non-industrial private forest landowners make up one of the state s six forestland ownership categories as described in the Forestry Program for Oregon (FPFO). The FPFO is developed by the Board of Forestry with extensive public participation. The Board of Forestry is responsible for establishing the state s forest policies and oversees the ODF. Oregon Forest Ownership Tribal 2% Non-Industrial Private 18% USFS 46% Industrial Private 19% Local Government 1% State 4% Other Federal 1% BLM 9% NIPF landowners control approximately 18 percent of total 27.4 million acres of forests in Oregon. The other ownership categories include: federal, 56 percent; state and local government, 5 percent; tribal, 2 percent; industrial 19 percent; and urban forests that grow on a variety of non-forest land uses. These acreage percentages reflect the amount of forest cover by owner as identified through the National Land Cover Database (NLCD) (Appendix 1) and ODF/County Assessor ownership data. NIPF landowners percentage of the state s annual harvest has averaged 13 percent of an average 4.2 billion board feet harvest over the past 13 years. Western Oregon landowners harvest the majority of NIPF timber, 83 percent for 2004; but the NIPF landowners share of forestland, 15%, is higher in Eastern Oregon where timber harvests provide a more significant portion of the local economy. Oregon SAP Project Report 7-7.doc/Jaz F (PF) 7 07/10/2006
11 Harvest Percentages by Ownership 90% 80% 70% NIPF For Indust Federal 60% Million BF 50% 40% 30% 20% 10% 0% ODF used a process of elimination to map NIPF ownership. First, the state s total forestland was identified through the use of the NLCD vegetative classifications derived from satellite imagery (Appendix 1). After all forestlands were identified, public and tribal forestland previously identified from existing ODF GIS data were masked out. Oregon s industrial forest landowners were identified from County Assessor s tax lot data. Ownerships greater than 5,000 acres that were not clearly industrial were placed on a list and individually classified as industrial or non-industrial with the assistance of local ODF foresters using the NIPF definitions discussed in the introduction. Industrial forest ownerships were added to the area masked out. All remaining rural private forests were classified as NIPF (see Map #8) Year Selection and Weighting of Data Layers Additional Data Layers ODF in partnership with its Oregon Forestland Coordinating Group (OFCG) reviewed the 11 GIS data layers identified by the initial Northeastern states effort. The OFCG discussed with ODF what additional GIS data could be important and available for an Oregon analysis. Three additional layers were chosen: Forest Activities, Soil Productivity, and Conservation Opportunity Areas. Weighting The OFCG met twice to establish and review the weighting scheme. Each layer was assigned a percentage. Once all data layers were assigned a percentage, the percentages were converted to points; that is, 10% became 10 points and the sum of the maximum points for all 14 layers equaled 100. Five layers have a range of values. These layers have their points assigned across the layers range of values. Oregon SAP Project Report 7-7.doc/Jaz F (PF) 8 07/10/2006
12 Each layer has a minimum weighting of one; the maximum weighting is between two and 10. Data Layers Layer Resource Threats Weight (points) Wildfire Risk 1,5 or 10 Development Risk 1 or 10 Forest Health 1,5 or 10 Resource Richness Riparian Corridors 1 or 10 Conservation Opportunity Areas 1 or 7 Zoning 1 or 7 Forest Patches 1,3,5 or 7 Public Water Suppliers 1 or 7 Private Industrial Forestland Activity 1,4 or 7 Forest Soil Productivity 1,3,5 or 7 Threatened and Endangered Species 1 or 6 Proximity to Public/Industrial Forest Lands 1 or 5 Wetlands 1 or 5 Topography 1 or 2 Data Layer Descriptions There were multiple factors that influenced the weighting. Some of these factors reflect benefits while others provide varying forest threats. The 14 data layers were divided into two categories: opportunities and threats. Opportunities Riparian Corridors This layer identifies land within 200 feet of streams. After reviewing the various stream layers and attributes, the USGS 1:100,000 scale stream layer was used. The intent of this layer is to recognize the added value in managing forests adjacent to streams. Land was given 10 pts when adjacent to stream; 1 point if not. Conservation Opportunity Areas This layer, developed by Oregon Department of Fish and Wildlife in 2006, is from their Comprehensive Conservation Strategy. Funded by US Fish and Wildlife as part of a national effort, it used a similar analysis process of multiple data layers. Conservation Opportunity Areas are landscape level habitat types important to key wildlife species. These areas were given 7 pts; other areas 1 pt. Priority Zoning Oregon has a regulatory land use system administered by the Department of Land Conservation and Development (DLCD). Counties designate land into a number of Land Use Planning Zones. For this project DLCD zoning data listed as Agriculture, Agriculture/Forest, Range, Forestry, Natural Resource, Refuge, Oregon SAP Project Report 7-7.doc/Jaz F (PF) 9 07/10/2006


13 Recreation, or Indian Reservation was defined as non-developable, free from development pressures; and therefore, more important. This data set represents the initial group s Priority Watershed theme. Non-developable land was given 7 points; developable land was given 1 point. Forest Patch Size This layer builds on the assumption that large, contiguous forests are better. It uses data from US Geological Survey, National Land Cover Data and ODF. Contiguous forests were stratified into 0-40 acres, acres, acres, and greater than 640. The size categories were assigned 1,3,5,7 points respectively. Public Water Supply This layer, developed by the Oregon Department of Environmental Quality in 2005, identifies forested watersheds that are part of public water supply systems. Identified watersheds received 7 points. Lands that do not feed public water systems were given 1 point. Private Individual Forestland Activity This layer uses ODF Forest Practices Act Notification data for 2004 and 2005 on family forestlands to identify landowner activity. This recognizes the value in working with those landowners currently doing something on their forest lands. The state is divided into stewardship forester geographic areas. The more family forest land activity in a forester s area, the heavier the weighting. Activity was tracked from January 2004 through October This layer also recognizes that this spatial analysis can be used in the future when considering the positioning of field foresters. Since these foresters work in Oregon SAP Project Report 7-7.doc/Jaz F (PF) 10 07/10/2006
14 both incentive and regulatory areas, any work load analysis must consider the effectiveness of the integrated services. The number of notifications on family forestlands by Stewardship Forester was stratified into three groups. Forester areas with less than 198 notifications were assigned 1 point, those between 199 and 349 were assigned 4 points, and those areas with more than 349 were assigned 7 points. Forest Soil Capability Soil productivity provides greater opportunities for a variety of forest products, wildlife habitats and social values. Soil data is from the USDA- Natural Resources Conservation Service s State Soil Geographic (STATSGO) database which is generalized from detailed county soil survey data. The mapping scale for STATSGO is 1:250,000. The soils were stratified into 4 groups based on site index. Site indexes less than 42 were given 1 point; site indexes between 42 and 82 were given 3 points; site indexes between 83 and 117 were given 5 points; and those greater than site index 118 were given 7 points. Threatened and Endangered (T&E) Species Forests supporting T&E species can provide additional wildlife benefits from active forest management. ODF developed 500 ac hexagon grids that overlaid T&E points and polygons. This was done to avoid identifying the exact location of T&E species. For listed fish species a 100 foot buffer was developed. Species data is from ODF and Oregon State University s Institute for Natural Resources Natural Heritage data. Hexagons covering a T&E point or polygon and/or a T&E stream buffer were given 6 points; all other hexagons were given 1 point. Proximity to Public/Industrial Forestlands This layer recognizes an added value of NIPF land adjacent to working forests. This assumes that it is easier to find the workforce, equipment and markets for family forestlands activities near forest lands that are being actively managed. NIPF lands within a mile of public or industrial forests were given 7 points, while family forestland more than a mile from public and/or industrial land was given 1 point. While not considered in the analysis project, public lands not being managed become a negative factor where wildfire and insects provide significant threats. Wetlands While forested wetlands are an important resource, not all of Oregon s identified wetlands have been digitized. Available data are from the Gap Analysis Program (GAP) and the National Wetlands Inventory (NWI). Lands identified as wetlands were assigned 5 points, all others were assigned 1 point. Topography Steeper slopes are more difficult to manage and carry additional risks. They also require additional attention from ODF stewardship foresters when a landowner notifies that they will be operating on steep ground. Slopes were divided into two groups under or over 60%. US Geological Survey data was used to identify the topography. Slopes identified over 60% were given 2 points; those less than 60 % were given 1 point. Oregon SAP Project Report 7-7.doc/Jaz F (PF) 11 07/10/2006
15 Threats This project evaluated the three major threats to forest lands identified in the initial SAP effort. They are: wildfire, insect and disease outbreaks, and development of forestlands to non-forest uses. Wildfire and insect/diseases are more significant threat east of the Cascade Mountains and in Southern Oregon, whereas development is a more significant threat in Western Oregon. Western Oregon s Douglas-fir forests do have some notable insect and disease concerns but not to the level of the pine forests in Eastern and Southern Oregon. Wildfires are a threat to all forest but occur less frequently in Western Oregon. Historically when they do occur, wildfires are more destructive in the west-side Douglas-fir forests than in the Pine forests. Pressure to develop forestlands has been largely held in check for over the past 20 years by the state s regulatory land use planning program. Ballot Measure 37 passed in November 2004, allows for additional development of some forest lands. While this measure will have an effect on land use, the significance of the impact is not yet clear. This, and the current trend among publicly traded forest industry of selling forest land that has a higher use value, may increase the development pressures on Oregon s forests. For now, land use change impacts on forest lands are clouded, and future development risks are not yet predictable. The extent of these changes will become clearer as the courts define the applicability of Ballot Measure 37. Wildfire Risk - (Communities at Risk) This layer addresses wildfire impacts. It was developed through a GIS analysis of several data layers by ODF in 2005 to identify communities at risk from wildfire. The risk of wildfire was stratified into three levels low, medium, and high, with 1, 5 and 10 points respectively assigned. Insect and Disease Risk This 2006 USDA Forest Service layer represents a risk defined as: "the expectation that 25 percent or more of the standing live volume of trees greater than 1 inch in diameter will die over the next 15 years due to insect and disease activity. The layer, at one km scale, is part of a National Insect and Disease Risk Mapping effort. It is an integration of 186 individual risk models constructed within a common consistent framework, and was developed to aid in the allocation of resources for forest health management. For additional detail, visit: riskmap.shtml. The risk was separated into low, medium and high categories and assigned points of 1, 5, and 10 respectively. Development - Community Extent Influence This layer attempts to show a social factor to consider in managing forests. It was developed by ODF in 2005 and is a product of analyzing several data layers. Areas identified represent forestlands outside Urban Growth Boundaries that have aesthetic and other community values. Identified areas were given 10 points; those not identified were given 1 point. Oregon SAP Project Report 7-7.doc/Jaz F (PF) 12 07/10/2006
16 Management Planning Data The development of forest management plans can assist landowners in advancing their forest goals and objectives, reducing risk to their forest, and capitalizing on local opportunities. Efforts to promote individual landowner management plans are built on the belief that the collective results of individual family forest landowner actively working to meet their goals and objectives will provide public benefits. Technologies such as those used in this spatial analysis project are moving state and federal natural resource agencies forward to where they will be able to test this belief and display the benefits. ODF has placed a priority on landowner management planning since An ODF Service Forestry Assessment in 1989 and the 1990 Farm Bill s establishment of the Forest Stewardship Program reinforced this priority and expanded planning to address multiple resources. In the mid-1990s the American Tree Farm System began a process to strengthen its management plan standards. Their current standards address all forest resources and with FSP are driven by individual landowner goals and objectives to promote sustainable forest management. Oregon State University s Forestry Extension program also promotes integrated forest resource management through its Resource Management Planning courses. In these courses landowners are assisted by resource professionals in developing their own management plans. ODF, OSU Extension, Tree Farm and the Association of Consulting Foresters have been working together for over 10 years to develop management plan standards that recognize and complement the various landowner planning efforts. In recognition of Oregon s collaborative approach, this analysis goal is to display all multi-resource landowner plans that are designed to promote sustainable forest management. Oregon s Forest Stewardship Plan template was developed in partnership with other management plan efforts, namely Oregon Tree Farm System s planning template and OSU Forestry Extension s Resource Management coached planning management plan outline. These plans all address landowner goals and objectives, multiple natural resource inventories, and priority activities; and therefore, substitute for each other. There is no benefit to the landowner or the public in having multiple plans on the same property. Because of this, Oregon s spatial analysis identifies known Forest Stewardship, Tree Farm and Resource Management plans as landowner planning efforts. Information on existing Forest Stewardship and Tree Farm management plans has been kept in MS Access tabular databases. Developing GIS shape files of these landowner plans was a three-step process. Step 1: ODF acquired county spatial tax lot data for individual counties. Most counties have attributed these shape files with a long list of information. For this project ODF used landowner name and address information. The Oregon s Department of Revenue Oregon SAP Project Report 7-7.doc/Jaz F (PF) 13 07/10/2006
17 has been assisting the state s 36 County Assessors in capturing tax lot map information in a GIS format. Most counties completed this effort in early Step 2: a landowner has one management plan but can own multiple tax lots. To establish the needed one-to-one relationship between landowner and plan data, ODF s GIS staff created a management plan layer of centroids that represent individual plans. These centroids were positioned using a variety of methods with section, township, and range information being the preferred methods. Not all plans had good legal descriptions in the Stewardship and Tree Farm databases. Plans with very general or no legal location information were placed on the edge of the county map for field forester review. Step 3: when a centroids layer was completed for a given county, it was displayed with the county s tax lot shape files. Management plan centroids were then moved inside the appropriate tax lot through comparing name, address and acreage attributes from the centroids and tax lot polygon data layers. This was a manual process since there is a low probability that a given landowner s name and address are spelled exactly the same in the management plan and county databases. For those counties that had not developed or would not share their tax lot attributes, local field foresters were asked to identify landowners tax lots. There are 20 of the 1,294 forest stewardship plans that could not be located and have yet to be located on geo-referenced tax lot maps. Landowner plans are tracked and displayed as either Forest Stewardship or Tree Farm. Landowner plans that have been certified as both a Stewardship and Tree Farm plan are displayed as Stewardship Plans for this project. Spatial Analysis This spatial analysis project takes geo-referenced data to identify relative importance of non-industrial private lands and to overlay existing forest stewardship plans on these lands to determine acres of lands under management plans by level of priority. SAP Process Non-Industrial Private Lands Mask This mask defines the non-industrial private lands for analysis by excluding lands that are developed, desert, industrial private forest lands, and public forest lands. The NIP lands are identified as forest or non-forest /non-developed (agricultural) capable of growing trees. For Western Oregon all agricultural lands are considered capable of growing trees. This is not the case east of the Cascade Mountains where precipitation is less. For this project, lands below 14 inches of annual rainfall were classified as desert, not capable of growing trees. GIS Analysis Oregon SAP Project Report 7-7.doc/Jaz F (PF) 14 07/10/2006
18 Fourteen data layers were selected to evaluate and prioritize the NIP lands. The analysis used all layers (map 1), 11 resource richness layers (map 4), and the three resource threats layers (map 5). Each layer was first converted to 300 x 300 foot raster cells. Then the layers were assigned values to reflect the importance of the data. The weighting strategy assigned cell values between 1 and the maximum value for that layer (2 10). Through the use of function Cell Statistics, the layers we combined provided a state map with potential cell values between 14 and 100 for Map 1, between 11 and 70 for Map 4, and between 3 and 30 for Map 5. Natural Breaks (Jenks) statistics were then used to divide the cells into three priority categories; low, medium, and high. ArcMap Model to sum rasters The majority of high priority NIPF lands are in Western Oregon. Data layers Public Drinking water, Forest Activities, Soil Productivity, Threatened and Endangered Species, and Development Risk appear to be the major factors for having the higher percentage of high sites on the Westside. The spatially identified Forest Stewardship and Tree Farm Plan polygons were then placed over the SAP analysis layer to determine plan acres by priority areas. Just over 21 percent of Oregon s NIPF lands are under a management plan. Landowner Management Plan Activities A national goal is to have individual landowner plans scheduled activities recorded in digital attribute files. Oregon s spatial analysis does not include this data. ODF has considered this proprietary information and will not use it until a process is developed to assure that the information is protected. Oregon does recognize that a list of landowner planned activities has value. It could be of help to the state and its partners in seeking additional incentives to assist landowners and in notifying individuals when new incentives became available for their planned forest improvement activities. Oregon SAP Project Report 7-7.doc/Jaz F (PF) 15 07/10/2006
19 Prioritization and Existing Management Plans Forest Stewardship on Non-Forest Lands This project prioritized all non-industrial private lands. The forest evaluation of farm lands is part of this national project, but it doesn t correspond with Oregon s land use strategies. The state s existing forest policies focus on maintaining and improving existing forest lands. The state has a strong agricultural base; communities and the state depend on farming for a wide assortment of products. The state s land use program has goals to protect both forest and farm lands; while forestry is a compatible land use in farm zones, converting farm lands to forests is not an identified benefit. NIPF Lands by SAP Priorities 21 % of NIPF Lands in Management Plan 38% 23% 39% Low Medium High Forest Stewardship on Non-industrial Private Forest Lands For NIPF lands the analysis identified nearly equal acreages of high and medium priority forests. Combined they make up 77% of 4.9 million NIPF acres. There are management plans on 21 percent of all NIPF lands. Forty six percent of plans and 22 percent of the plan acres are on high priority acres; 47 percent of the plans and 29 percent of the plan acres are on medium priority acres; and eight percent of the plans and 49 percent of the plan acres are on low priority acres. On lands identified as low priority NIPF lands, nearly one-half are covered by management plans. The major shifts between acres and numbers of plans by priority is because of the ownership sizes west and east of the Cascade Mountains. Westside ownerships are smaller and their lands have been identified as higher priority. Oregon SAP Project Report 7-7.doc/Jaz F (PF) 16 07/10/2006
20 NIPF Acres in Plans by Priority High 22% Medium 29% Low 49% Number of NIPF Plans by Priority Lo w 8% High 46% Medium 46% When considering just the number of Forest Stewardship plans by priority area, 49 percent of the plans are in the high priority area, 44 percent are in the medium priority area and 7 percent in the low priority area. Ninety two percent of Tree Farm plans are also in the high and medium priority areas. Assessment of Spatial Analysis This assessment focuses on the use of spatial analysis in managing landowner assistance efforts, and on the appropriateness of the Northeastern US established protocols. Oregon s forests play a significant role in the state and the policies that focus their management are defined in the Forestry Program for Oregon (FPFO). ODF works for the Board of Forestry and its actions are guided by the FPFO. This policy document, last updated in 2003, shares with the FSP the promotion of sustainable forest management. FSP is a component of the broader state effort to support NIPF landowners. ODF views this FSP spatial analysis as a tool to better understand and evaluate its total NIFP and other FPFO efforts. Oregon SAP Project Report 7-7.doc/Jaz F (PF) 17 07/10/2006
21 Spatial Analysis as a Management Tool GIS with the appropriate data layers is a powerful tool to analyze, identify, and study NIPF lands and to develop strategies to help private forest landowners manage their lands. Spatial analysis can assist national and state natural resource agencies to better understand issues, as well as tell the story how these lands support issues facing individual states and the nation. It can also contribute to more effective and efficient administration of programs in support of sustainable forestry goals on private lands. This project has been very helpful for ODF in better understanding GIS analysis, what data is needed, and what decisions need to be addressed in using spatial analysis as an effective tool. The built-in flexibility of this spatial analysis effort is very helpful in merging local and national issues. Providing states the ability to add additional data layers and develop their unique weighting strategy makes it a strong tool for understanding and describing non-industrial private forest land issues, and in displaying how national strategies can be implemented at the local level. ODF has detailed vegetation data that addresses stocking and tree species for Western Oregon and the northeastern portion of the state. There is a problem in adding more data layers to an analysis. Additional layers allow for more in-depth analysis of a particular issue and for studying additional issues; but as layers are added, the significance of any particular layer is diminished. For example, if three layers were analyzed together and the first layer had twice the value as the others, the values in percent would be 50, 25, and 25, a difference of 25 percent between the first and other layers. If 15 layers were analyzed together and the first layer had twice the value as the others, the values in percent would be 12.6 and the other would be 6.3 percent; and difference of 6.3 percent between the first and other layers. ODF added three data layers to this analysis project to improve its understanding of issues facing NIPF landowners, and has identified additional information that would be valuable for future spatial analysis efforts. Additional work is needed to better understand how to use various data layers in spatial analysis. One possible solution is to first focus separately on the social, economic, and environmental components of forest sustainability and then weight and analyze these three data sets. An economic analysis could include data themes that deal with timber growing potential, proximity to markets, timber stocking levels, potential to increase harvest levels, percent of timber supply provided by NIPF lands. An analysis of the social importance of NIPF lands is an important area but less understood than the economic and environmental components of forest sustainability. Largely because of this, less data is readily available for analysis. Data could include themes such as percentage of local economy supported by forests and NIPF lands potential share, unemployment, need for open space, quality of life. Increasing or maintaining harvests from family forestlands in areas that remain timber dependent is Oregon SAP Project Report 7-7.doc/Jaz F (PF) 18 07/10/2006
22 critical to retain mill and timber management infrastructure so that community health can be restored and forestland management can continue to be viable. Suitability of USDA-Forest Service Northeastern Area Protocols Many of the inputs and decisions made by the initial Northeastern states fit Oregon but there are three major areas where the initial SAP strategy needs modifications to meet the intended goals. These areas deal with weighted data layers for analysis, the focus on non-forested, non-developed lands, and federal forests. Weighting Oregon followed the national protocols and analyzed the data using a proposed state-wide weighting strategy, but the state has extremely varied eco-regions and population centers that limit the value of a state-wide weighting strategy. This statewide analysis has value, for example, in evaluating the positioning of available ODF resources, but it does not work well in assisting local managers and foresters in setting their priorities, or in evaluating the contribution individual landowner management plans have in dealing with high priority issues. The issue of statewide versus regional weighting schemes was not apparent to ODF or the OFCG until the results of the spatial analysis were being evaluated. Priority areas of resource richness and threats are different if weighting focuses on regional issues. For example, the pine forests of Eastern Oregon have fire, fuel buildup, insects, and the loss of forest product markets as major concerns. For the Douglas-fir forests of Western Oregon, development pressure and underproducing forests are major concerns. Oregon cannot find a single weighting scheme that adequately reflects each forest type s priorities. A statewide weighting strategy has value for some issues, but it appears that region weighting will be more appropriate for other issues. To go to regional analyses, regions will need to be defined based on shared resource richness and threats, as well as other economic, ecological, and social factors. ODF and the OFCG will need to reconsider weighting strategies based on these regions and the issues needing study. Example of regional factors include the risk of wildfire, forest health concerns, soil productivity, forest product mills, development pressure, andcommunity expectations. These themes are very different in the various regions of the state. Weighting of various layers is also dependent on the available data and issues being addressed. GIS data on other factors such as options for technical assistance, community dependency on forest products, and access to mills, could be valuable in using spatial analysis to better understand the importance of NIPFs and to improve assistance to NIPF landowners. Dividing the state for analysis can help Oregon and other states with significantly different regional economic, ecological and/or social conditions. This may create issues when using the results to build a national product. Oregon SAP Project Report 7-7.doc/Jaz F (PF) 19 07/10/2006
23 Non-forest/Non-developed Lands A second significant difference between Oregon and the Northeastern part of the nation is how forestry views non-forest, non-developed lands. While the SAP strategy views these lands as potential forests, Oregon views them as productive agricultural lands. Agriculture is important to the state s economy and its social fabric and there is no state goal to convert these lands to forests. The state s existing forest policies as defined in the FPFO focus on maintaining and improving existing forest lands. NIP Lands by SAP Priorities Low 30% High 31% Medium 39% NIPF Lands by SAP Priorities Low 23% High 38% Medium 39% An evaluation of farm lands as potential forestland is also out of step with the state s land use strategies. The state s strong agricultural base is protected along with forestland under major goals of the state s land use planning program. Forestry is a compatible land use in agricultural zones, and landowners have the right to convert farm to forests and forests to farmland but that is a landowner s prerogative. With little to no net gain from converting these lands, ODF sees no value in considering these lands as part of a spatial analysis effort, and considers them a distraction. Federal Forests In the section Oregon s Family Forestland Ownership, the FPFO categorizes Oregon s forest into six ownership classes. It explains how each class provides a unique set of products and values that when combined provide a sustaining array of products and values. Oregon SAP Project Report 7-7.doc/Jaz F (PF) 20 07/10/2006
24 Federal lands are a key component of Oregon s sustainable forest model, and federal policies are very compatible with the state s strategy, but for a variety of reasons, there is a lack of management activity on federal forests. This results in two major negative impacts. The lack of active management threatens adjacent private forests because these overstocked federal forests with historically high forest fuel buildups increase the threat of wildfire and insect infestations. Currently, ODF s SAP layer Proximity to Public/Industrial Forestland places a higher value on NIPF lands that are adjacent to federal forests. Most Eastern and Southern Oregon NIPF landowners have significant risks of wildfire and insect outbreaks and consider being next to federal forests a negative. Federal lands have much higher stocking levels and forest fuels than adjacent managed private forests. The second negative impact deals with the loss of local forest management infrastructure. Federal forests make up over 70 percent of Eastern Oregon forests so removing them from active management has had a major impact on the economies of Eastern Oregon s rural communities. This lack of activity has decimated the forestry infrastructure. Federal forests are now harvesting 10 to 15 percent of what they provided 10 years ago. So while the analysis ranked proximity to public forest a positive, in Eastern and Southern Oregon, federal forests are more often a negative factor. Regional analysis can address this issue. Recommendations for Modifying Northeastern Area Protocols Oregon s SAP has discovered several issues that need addressing before an analysis can serve both the states and the nation. Regional Priorities The findings from a statewide weighting has value for Oregon but it does not accurately define the state s priority NIPF lands. There is such a wide range of issues because of the broad variation in climate and forest types within the state. Also, the value of being near federal forests is a regional issue. It varies from being a positive to being a negative depending where in the state one owns forestland. ODF did not test sub-state weighting, but it appears that this would provide a better description of priority forests. Assessment of Non-Forest Lands Non-forest, non-developed lands in Oregon are primarily agricultural lands, and the state does not have a goal to convert these lands to forests. Since this is a strategy for some states, there should be a process for making the analysis of farm land optional. Oregon SAP Project Report 7-7.doc/Jaz F (PF) 21 07/10/2006
Forest Stewardship Spatial Analysis Project Illinois Methodology March, 2007
 Forest Stewardship Spatial Analysis Project Illinois Methodology March, 2007 Project Summary Administered by the U.S. Forest Service and implemented by State forestry agencies, the Forest Stewardship Program
New Jersey Forest Stewardship Program Spatial Analysis Project Map Products And Data Layers Descriptions
 New Jersey Forest Stewardship Program Spatial Analysis Project 2007 Map Products And Data Layers Descriptions 01/07 NJ Forest Stewardship Program (FSP) Spatial Analysis Project (SAP) Methodology Project
SPATIAL ANALYSIS OF POTENTIAL IMPACTS OF LOCAL FORESTRY ORDINANCES
 SPATIAL ANALYSIS OF POTENTIAL IMPACTS OF LOCAL FORESTRY ORDINANCES David R. Daversa, Stephen P. Prisley, and Michael J. Mortimer Department of Forestry, Virginia Tech, Blacksburg, VA 24061 ABSTRACT Local
State and Private Forestry Programs
 Appropriation State and Private Forestry The Fiscal Year (FY) 2009 President s Budget proposes $109,500,000 for programs under the State and Private Forestry appropriation, a decrease in budget authority
Forest Stewardship Spatial Analysis Project Methodology Report for Washington July 2008
 Forest Stewardship Spatial Analysis Project Methodology Report for Washington July 2008 Washington Forest Stewardship Spatial Analysis Project Final Report Contact Info: Steve Gibbs Stewardship Coordinator
Minnesota Stewardship Spatial Analysis Project Methodology and Analysis documentation January 28, 2008
 Minnesota Stewardship Spatial Analysis Project Methodology and Analysis documentation January 28, 2008 Summary In the fall of 2004, Minnesota DNR and the U.S. Forest Service began working together to create
Forest Stewardship Program National Standards and Guidelines
 Forest Stewardship Program National Standards and Guidelines Second Edition September 2005 USDA Forest Service State & Private Forestry Cooperative Forestry Forest Stewardship Program National Standards
11. Prioritizing Farmlands for Future Protection
 11. Prioritizing Farmlands for Future Protection Identification of Important Farmlands in Putnam County I n order to implement this Plan successfully, Putnam County decision-makers will have to take advantage
Appendix 5A Priority Landscapes GIS Analysis Methodology
 Appendix 5A Priority Landscapes GIS Analysis Methodology Overview This appendix describes the methodology used for Pennsylvania s Priority Landscapes GIS Analysis. The figure below is a conceptual diagram
Green Infrastructure: A Guide to Asset Mapping in the Rappahannock-Rapidan Region. Rappahannock-Rapidan Regional Commission December 2015
 Green Infrastructure: A Guide to Asset Mapping in the Rappahannock-Rapidan Region Rappahannock-Rapidan Regional Commission December 2015 What Is Green Infrastructure? Green infrastructure is an interconnected
Project Brief: Small Forestland Owner Parcel Identification and County GIS Data Compilation for Washington State WRIAs 23 & 49
 Project Brief: Small Forestland Owner Parcel Identification and County GIS Data Compilation for Washington State WRIAs 23 & 49 Prepared For: Mary McDonald Program Director Small Forest Landowner Office
Montana Spatial Analysis Project
 Montana Spatial Analysis Project Montana Department of Natural Resources and Conservation December 2006 Table of Contents Executive Summary... 2 Stewardship Analysis Project (SAP) Introduction... 5 SAP
Forest Management Programs for New Jersey Woodlot Owners. Mark C. Vodak, Ph.D. Rutgers Cooperative Extension 31 August, 2010
 Forest Management Programs for New Jersey Woodlot Owners Mark C. Vodak, Ph.D. Rutgers Cooperative Extension 31 August, 2010 Forest Management Programs in New Jersey Farmland/woodland Assessment Program
COLORADO FOREST LEGACY PROGRAM APPLICATION FOR 2019 FUNDS
 COLORADO FOREST LEGACY PROGRAM APPLICATION FOR 2019 FUNDS The Colorado Forest Legacy Program purpose is to protect environmentally important private forest areas that are threatened by conversion to non-forest
American Tree Farm System Management Plan Template
 American Tree Farm System Management Plan Template State Tree Farm # Tree Farm Property Location Tree Farm Name: Ownership 1 : County: Tax Map ID: Location 2 : State: GPS Coordinates: Tree Farmer Contact
TAC CHARRETTE WORKBOOK Ecosystem Management and Sustainable Forestry Practices
 For Discussion Purposes TAC CHARRETTE WORKBOOK Ecosystem Management and Sustainable Forestry Practices NEW JERSEY HIGHLANDS COUNCIL March 28, 2006 1 Overview of RMP Goals and Structure NEW JERSEY HIGHLANDS
Forest Legacy Program
 Forest Legacy Program Forest Management Sheet Legacy http://texasforestservice.tamu.edu The State of Texas contains 26 million acres of forestland, primarily in the Eastern third of the state. This forestland
Characterizing the Fire Threat to Wildland Urban Interface Areas in California
 Introduction Characterizing the Fire Threat to Wildland Urban Interface Areas in California This document outlines the procedures used to identify areas in California that pose significant threats from
US Forest Service Open Space Conservation Strategy
 US Forest Service Open Space Conservation Strategy Transportation Research Board September 3, 2008 Atlanta, Georgia Photo Credit: Regents at the University of Minnesota. All rights reserved. Used with
State and Private Forestry Fact Sheet
 State and Private Forestry Fact Sheet New Mexico 2017 Investment in State's Cooperative Programs Program FY 2016 Final Community Forestry and Open Space $0 Cooperative Lands - Forest Health Management
COMMUNITY SUPPORT FOR ADOPTING WOODLAND CONSERVATION REGULATIONS EXAMPLE OF A WOODLAND CONSERVATION ORDINANCE STATEMENT OF PURPOSE:
 EXAMPLE OF A WOODLAND CONSERVATION ORDINANCE STATEMENT OF PURPOSE: To preserve wooded corridors that connect large tracts of forests to act as wildlife corridors, encouraging species diversity by providing
PRINCE GEORGE NATURAL AREAS AND THE EFFECTS OF CLIMATE CHANGE: CASE STUDY
 PRINCE GEORGE NATURAL AREAS AND THE EFFECTS OF CLIMATE CHANGE: CASE STUDY Natural Areas in Prince George The City of Prince George is dominated by natural, undeveloped areas within city limits and in adjacent
The USDA. Farm Bill:
 The USDA Farm Bill: What is in it for woodland owners? Why is the 2008 Farm Bill important to me? As the owner of forested property or woodlands, you may qualify for landowner assistance under the 2008
Urban and Community Forestry Working Together to Cultivate Green Infrastructure
 Urban and Community Forestry Working Together to Cultivate Green Infrastructure Regional Tree and Shade Summit Phoenix, Arizona March 9, 2011 1 Presentation Scope Provide a general description of the State
Forest Management Plan Criteria Practice/Activity Code (106) (No.)
 (No.)") 1. Definition Forest Management Plan Criteria Practice/Activity Code (106) (No.) A forest management plan is a site specific plan developed for a client, which addresses one or more resource concerns on
1. Definition Forest Management Plan Criteria Practice/Activity Code (106) (No.) A forest management plan is a site specific plan developed for a client, which addresses one or more resource concerns on
S E C T I O N. six. Environment
 S E C T I O N six Environment 202 VOLUME 15: EXAMPLES OF SUCCESSFUL PUBLIC-PRIVATE PARTNERSHIPS 23 Chesapeake Forest, Maryland, United States P R O J E C T S U M M A R Y The Chesapeake Bay is the largest
Appendix C Risk Assessment Methods
 Appendix C Risk Assessment Methods The following section outlines the specific methods, data, and values used to evaluate wildfire risk in Lane County. Identifying the Wildland Urban Interface Risk The
INSTRUCTIONS Determination for Eligibility of Financial Assistance For Timber Salvage Operations
 INSTRUCTIONS Determination for Eligibility of Financial Assistance For Timber Salvage Operations Background: Oregon Administrative Rule (OAR) 629-610-070 of the Oregon Forest Practices Act provides for
Grant Narrative for Forest Stewardship and Urban and Community Forestry Programs [State] Division of Forestry FY 2011
![Grant Narrative for Forest Stewardship and Urban and Community Forestry Programs [State] Division of Forestry FY 2011](/thumbs/85/92405963.jpg "Grant Narrative for Forest Stewardship and Urban and Community Forestry Programs [State] Division of Forestry FY 2011") Grant Narrative for Forest Stewardship and Urban and Community Forestry Programs [State] Division of Forestry FY 2011 This grant application includes S&PF Program and project elements within Cooperative
Grant Narrative for Forest Stewardship and Urban and Community Forestry Programs [State] Division of Forestry FY 2011 This grant application includes S&PF Program and project elements within Cooperative
State and Private Forestry Fact Sheet
 State and Private Forestry Fact Sheet Oregon 2018 Investment in State's Cooperative Programs Program FY 2017 Final Community Forestry and Open Space $0 Cooperative Lands - Forest Health Management $797,131
STAFF REPORT. Permit Number: Tallman. Kitsap County Board of Commissioners; Kitsap County Planning Commission
 STAFF REPORT Permit Number: 15 00742 Tallman DATE: November 9, 2015 TO: FROM: RE: Kitsap County Board of Commissioners; Kitsap County Planning Commission Katrina Knutson, AICP, Senior Planner, DCD and
Forest Stewardship Program
 Forest Stewardship Program James Starr, Forest Management 06/2003 Purpose of Forest Stewardship Program is to assist private forest landowners in more actively managing their forest and related resources;
Introduction. Property Boundary and Survey Evidence
 Introduction The Peacham Town Forest is approximately 190 acres of land located in the Northwest corner of the town, close to the town line with Cabot. The tract is the former Ike Peck farm and was acquired
(Draft) Addendum to 5-year Management Plan Mohican-Memorial State Forest
 Addendum to 5-year Management Plan Mohican-Memorial State Forest") (Draft) Addendum to 5-year Management Plan Mohican-Memorial State Forest Forest Description Mohican- Memorial State Forest (Mohican SF) is located in southern Ashland County, midway between Columbus and
(Draft) Addendum to 5-year Management Plan Mohican-Memorial State Forest Forest Description Mohican- Memorial State Forest (Mohican SF) is located in southern Ashland County, midway between Columbus and
Forest Stewardship Spatial Analysis Project Wisconsin Methodology
 Project Summary One purpose of the Spatial Analysis Project (SAP) is to create a data layer for the state that represents levels of potential benefit from, or suitability for inclusion in, the Forest Stewardship
Linda Joyce. USFS Rocky Mountain Research Station, October 13, 2015
 Linda Joyce USFS Rocky Mountain Research Station, October 13, 2015 Context, Opportunities, Challenges Forests where are they, how productive, what are they valued for, and what are the threats currently
San Gabriel Mountains National Monument Need to Change Analysis June 2015
 San Gabriel Mountains National Monument San Gabriel Mountains National Monument Need to Change Analysis June 2015 I. Background Throughout this document for consistency, the term Monument will be used
Forest Stewardship Management Plan
 Forest Stewardship Management Plan James Starr, Forest Management 06/2003 Forest Stewardship Management Plans Plans must identify and describe actions to protect, manage, maintain and enhance relevant
Resources for Private Forest Landowners in New Mexico
 Resources for Private Forest Landowners in New Mexico Staff from the Natural Resources Conservation Service, New Mexico State Forestry and the South Central Mountain Resource Conservation & Development
Using Ecosystem Services Frameworks to Increase Forest Value and Enhance Forest Health
 Using Ecosystem Services Frameworks to Increase Forest Value and Enhance Forest Health Robert Deal, USDA Forest Service, Pacific Northwest Research Station, Portland, OR Outline of Presentation Working
Appendix C. Consistency With Eastside Screens. Salvage Recovery Project
 Consistency With Eastside Screens Salvage Recovery Project APPENDIX C Consistency of Forest Vegetation Proposed Actions With Eastside Screens (Forest Plan amendment #11) CHANGES BETWEEN DRAFT EIS AND FINAL
There are four test that agricultural and horticultural land must meet in order to qualify for present-use valuation. Forestland only has to meet
 There are four test that agricultural and horticultural land must meet in order to qualify for present-use valuation. Forestland only has to meet three test since the income test is not applied to forestland.
The Science Behind Forest Riparian Protection in the Pacific Northwest States By George Ice, Summer 2004
 The Science Behind Forest Riparian Protection in the Pacific Northwest States By George Ice, Summer 2004 Riparian buffers, streamside management zones, and similar measures are essential parts of forest
Protect forest lands from incompatible uses.
 GOAL 4: FOREST LANDS General Discussion To encourage conservation of forest lands in Klamath County for forest uses. Forest land shall be retained for the production of wood fiber and other forest uses.
DECISION CRITERIA BENTON COUNTY FORESTLAND CLASSIFICATION COMMITTEE
 DECISION CRITERIA BENTON COUNTY FORESTLAND CLASSIFICATION COMMITTEE General Parameters The primary mission of the Oregon Department of Forestry (ODF) is protecting forest resources (ORS 477.005). The definition
State and Private Forestry Fact Sheet. Investment in State's Cooperative Programs:
 State and Private Forestry Fact Sheet 2015 Idaho Investment in State's Cooperative Programs: Program FY 2014 Final Community Forestry and Open Space $0 Cooperative Lands - Forest Health Management $364,500
Delaware Wild Lands, Inc Public Summary Audit Report
 Introduction Delaware Wild Lands, Inc. 2018 Public Summary Audit Report The SFI program of Delaware Wild Lands, Inc. of Delaware and Maryland has demonstrated conformance with the SFI 2015-2019 Standard
Sierra Nevada Forest Plan Amendment Volume 1, Summary, Chapters 1 & 2
 reader's guide Sierra Nevada Forest Plan Amendment Table of Contents Sierra Nevada Forest Plan Amendment Volume 1, Summary, Chapters 1 & 2 TABLE OF CONTENTS The Table of Contents is divided into 3 Sections.
ASSESSING THE DIRECTION OF THE FOREST RESOURCE
 ASSESSING THE DIRECTION OF THE FOREST RESOURCE C U R T W I L S O N - R E G I O N A L F O R E S T R Y L E A D E R N O R T H E A S T R E G I O N - G R E E N B A Y, W D N R J U N E 2 0 1 2 QUESTIONS FOR TODAY
St. Louis County Land and Minerals Department 2018 SFI Forest Management Public Summary Report
 Appendix 2 St. Louis County Land and Minerals Department 2018 SFI Forest Management Public Summary Report Introduction The SFI Program of the St. Louis County Land and Minerals Department has achieved
Acres within Planning Area. Total Acres Burned
 Calf-Copeland Project Description Figure 1: Dead sugar pine in the Calf-Copeland planning area. Sugar pine grow best in open conditions. In the absence of fire disturbance, high densities of Douglas-fir
Forests in the Farm Bill Coalition. Photo: David Harvey, Dixfield, Maine. Forest Priorities for the 2012 Farm Bill
 Forests in the Farm Bill Coalition Photo: David Harvey, Dixfield, Maine Forest Priorities for the 2012 Farm Bill January 2011 Congress and the Administration must work to ensure that the Farm Bill provides
Recent Efforts by States to Incentivize Working Forests
 November 3, 2005 Sarah Murray Graduate, Social Sciences College of Forest Resources University of Washington Box 352100 Seattle WA 98195-2100 (206) 719-7020 scmurra1@u.washington.edu University of Washington
Anchor Forests: Improving forest ecosystem function through balanced Social, Economic, and Ecologic Management
 Anchor Forests: Improving forest ecosystem function through balanced Social, Economic, and Ecologic Management National Forest Foundation: Collaborative Restoration Workshop April 26 28, 2016 Denver, Colorado
Nebraska. State & Private Forestry Fact Sheet. Investment in State's Cooperative Programs: Key Issues:
 Nebraska Investment in State's Cooperative Programs: Program State & Private Forestry Fact Sheet FY 2006 Final FY 2007 Estimate Cooperative Lands - Forest Health Management 65,000 65,000 Cooperative Lands
NDSU - North Dakota Forest Service North Dakota Cooperative Fire Protection Initiative Budget Request
 Agency Information NDSU - North Dakota Forest Service North Dakota Cooperative Fire Protection Initiative 2015-17 Budget Request North Dakota State Board of Higher Education May 29, 2014 NDSU-North Dakota
Rogue Basin Ecological Integrity Assessment and Climate Change Management Interactions
 Rogue Basin Ecological Integrity Assessment and Climate Change Management Interactions Jimmy Kagan OSU PSU UO Ecological Integrity Measures (by area) Land management status Landscape features Habitat characteristics
National Association of State Foresters (NASF) 2014 Farm Bill Crosswalk 1
 2014 Farm Bill Crosswalk 1") (NASF) 1 NASF Farm Bill Platform Support consolidation of certain Conservation Title programs if the adjustment facilitates forest landowner participation in those programs, improves agency program delivery,
(NASF) 1 NASF Farm Bill Platform Support consolidation of certain Conservation Title programs if the adjustment facilitates forest landowner participation in those programs, improves agency program delivery,
Central Oregon Cohesive Strategy Initiative
 Central Oregon Cohesive Strategy Initiative Background and Concept September 2015 The National Cohesive Wildland Fire Management Strategy The Federal Land Assistance, Management and Enhancement Act (FLAME)
3.14 VISUAL RESOURCE (SCENERY)
") 3.14 VISUAL RESOURCE (SCENERY) 3.14.1 INTRODUCTION The Lower West Fork analysis area lies in the Bitterroot Mountain Range and is bisected by the West Fork Road (State Highway 473). The Lower West Fork
3.14 VISUAL RESOURCE (SCENERY) 3.14.1 INTRODUCTION The Lower West Fork analysis area lies in the Bitterroot Mountain Range and is bisected by the West Fork Road (State Highway 473). The Lower West Fork
The New Economies of the Redwood Region in the 21 st Century 1
 The New Economies of the Redwood Region in the 21 st Century 1 William Stewart 2 Abstract The redwood region of California has experienced a number of major land use changes over the past one hundred and
Wildlife Conservation Strategy
 Wildlife Conservation Strategy Boise National Forest What is the Wildlife Conservation Strategy? The Boise National Forest is developing a Wildlife Conservation Strategy (WCS) in accordance with its Land
Wildlife Conservation Society Climate Adaptation Fund 2014 Restoring Oak Resilience at the Table Rocks, Rogue River Basin, Oregon FACT SHEET
 Wildlife Conservation Society Climate Adaptation Fund 2014 Restoring Oak Resilience at the Table Rocks, Rogue River Basin, Oregon FACT SHEET Project Overview Oak ecosystems in the Pacific Northwest exist
IN Forestry Planning. Chris Gonso IDNR Forestry
 IN Forestry Planning Chris Gonso IDNR Forestry cgonso@dnr.in.gov Statewide Forest Assessment & Strategy website http://www.in.gov/dnr/forestry/5436.htm Why? Last Statewide Forest Resource 1980 s Leverage
Chapter 13: Wildlife and Vegetation
 Chapter 13: Wildlife and Vegetation Introduction and Setting Nevada County contains an extremely wide range of plants, animals and habitat types. With topographic elevations ranging from 300 feet in the
Applegate Adaptive Management Area. Rogue River-Siskiyou National Forest
 Applegate Adaptive Management Area Rogue River-Siskiyou National Forest Josephine County Applegate Watershed Fun Facts 493,000 Acres (770 sq. miles) 262,400 Acres in Jackson County 172,800 Acres in Josephine
The Washington Hardwoods Commission. Presents: A Hardwood Resource Assessment for Western Washington
 The Washington Hardwoods Commission Presents: A Hardwood Resource Assessment for Western Washington June, 2002 Abstract This project used Landsat TM images for mapping current forest distribution across
State Forest Land in North-Central Pennsylvania
 State Forest Land in North-Central Pennsylvania Overview Map The State Forest System in Northcentral PA (shown in green) is home to a diverse assemblage of plant and animal species. As part of its mission,
Final Report of the Riparian Forest Buffer Panel
 Chesapeake Bay Program Final Report of the Riparian Forest Buffer Panel Introduction Findings Land Use-Specific Findings On Agricultural Land On Forested Land On Developed and Developing Lands Recommendations
LAND AND USE. Figure 2. Land cover in Rhode Island, Forest land. Nonforest land and smaller forest patches predominate in the area surrounding
 Mountain laurel Kalmia latifolia Figure 2. Land cover in Rhode Island, 1992. Forest land Developed land Agricultural land Other land Water Source: U.S. Geologic Survey, National Land Cover Data LAND AND
DRAFT FOR CONSIDERATION AT THE APRIL 27, 2006 MEETING OF NATURAL RESOURCES COMMITTEE OF THE HIGHLANDS COUNCIL
 RMP Component: Resource Assessment / Ecosystem Assessment Technical Report: Forest Integrity Council Committee: Natural Resource Committee Memorandum Title: Technical Approach to Define Highlands Forest
Medicine Bow Landscape Vegetation Analysis (LaVA) Cooperating Agency Meeting March 6, :30 a.m. 12:30 p.m.
 Cooperating Agency Meeting March 6, :30 a.m. 12:30 p.m.") Medicine Bow Landscape Vegetation Analysis (LaVA) Cooperating Agency Meeting March 6, 2017 9:30 a.m. 12:30 p.m. Condition-based NEPA A Cutting-edge Analysis Approach What it s Not What it Is How it Works
Medicine Bow Landscape Vegetation Analysis (LaVA) Cooperating Agency Meeting March 6, 2017 9:30 a.m. 12:30 p.m. Condition-based NEPA A Cutting-edge Analysis Approach What it s Not What it Is How it Works
Western Governors Association Policy Resolution Western Agriculture A. BACKGROUND
 Western Governors Association Policy Resolution 2017-09 Western Agriculture A. BACKGROUND 1. Agriculture and forestry in the western states and territories are significantly different than in other regions
Arizona Department of Forestry and Fire Management
 Arizona Department of Forestry and Fire Management The Power of Partnership Agreements Jeff Whitney, Arizona State Forester Arizona Overview Arizona s a land of many ecosystems Land Ownership: 42% federal,
BLM Office: Lakeview District, Klamath Falls Resource Area Phone #:
 Decision Memorandum on Action and for Application of: Categorical Exclusion 516 DM2, Appendix 1, 1.12 Hazardous Fuel Reduction (PLAN CONFORMANCE AND CATEGORICAL EXCLUSION DETERMINATION) CX Log #: CX-04-17
Climate Change. Introduction
 Climate Change This environmental assessment incorporates by reference (as per 40 CFR 1502.21) the Climate Change specialists report and other technical documentation used to support the analysis and conclusions
DECISION RECORD for the Rattlesnake Negotiated Timber Sale (Reference:
 DECISION RECORD for the Rattlesnake Negotiated Timber Sale (Reference: Bly Mtn. / Swan Lake / Rattlesnake Reservoir Forest Health and Woodland Treatments Environmental Assessment #OR014-99-6) Introduction
Riparian Forest Buffer Panel (Bay Area Incentive Programs)
") Program Buffer Incentive Program Virginia Agricultural BMP Cost- Share Program Virginia Agricultural BMP Cost- Share Program Practice Woodland Buffer Filter Area Loafing Lot Management System Incentive,
Program Buffer Incentive Program Virginia Agricultural BMP Cost- Share Program Virginia Agricultural BMP Cost- Share Program Practice Woodland Buffer Filter Area Loafing Lot Management System Incentive,
Issues, Challenges and Opportunities at the Wildland- Urban Interface
 Issues, Challenges and Opportunities at the Wildland- Urban Interface Annie Hermansen USDA Forest Service, Southern Research Station Eliana Kämpf Binelli School of Forest Resources and Conservation, University
Private Woodland Owners - Meeting the Stewardship Challenge
 Private Woodland Owners - Meeting the Stewardship Challenge Authors: Erin Neave (conference presenter), Neave Resource Management, Nepean, Ontario, Canada (neavee@igs.net) Doug Wolthausen (co-author),
SFI Public Summary Report
 SFI 2015-2019 Public Summary Report WEYERHAEUSER COLUMBIA TIMBERLANDS DESCRIPTION OF COMPANY The Washington and Oregon State Weyerhaeuser Columbia Timberlands are located on approximately 635,000 acres
Philmont Scout Ranch
 Philmont Scout Ranch 17 Deer Run Road, Cimarron, NM 87714 SFI 2015-2019 Standards and Rules, Section 2 Surveillance Audit Introduction Philmont Scout Ranch 2017 Public Summary Audit Report The SFI Program
File Code: 1950 Date: December 7, Dear Friend of the Forest:
 United States Department of Agriculture Forest Service Chattahoochee-Oconee National Forests Oconee Ranger District 1199 Madison Road Eatonton, GA 31024 (706) 485-3180 File Code: 1950 Date: December 7,
MEMORANDUM OF UNDERSTANDING BETWEEN U.S. DEPARTMENT OF AGRICULTURE FOREST SERVICE
 MEMORANDUM OF UNDERSTANDING BETWEEN U.S. DEPARTMENT OF AGRICULTURE FOREST SERVICE U.S. DEPARTMENT OF AGRICULTURE NATURAL RESOURCES CONSERVATION SERVICE WASHINGTON STATE CONSERVATION COMMISSION WASHINGTON
Using A Connected Landscape Strategy to Conserve Virginia s Forests
 Using A Connected Landscape Strategy to Conserve Virginia s Forests Karen Firehock, Green Infrastructure Center Tomorrow Woods Workshop June 12, 2012 Session Route Natural Assets Assessment and Mapping
VEGETATIVE, WATER, FISH AND WILDLIFE RESOURCES POLICIES
 VEGETATIVE, WATER, FISH AND WILDLIFE RESOURCES POLICIES The County will: GOALS AND OBJECTIVES 1.1 Conserve, Enhance, Protect, Maintain and Manage Vegetative, Water, Fish and Wildlife Resources Promote
Relationship to E Flows
 Relationship to E Flows Riparian Areas Influences groundwater/surface water relationships Provides filters to improve water quality Provides habitat for diverse flora and fauna Relationship to E Flows
Decision Memo for Pax Ponderosa Pine Planting Project
 Decision Memo for Pax Ponderosa Pine Planting Project USDA Forest Service Pacific Northwest Region Fremont-Winema National Forests Lakeview Ranger District Lake County, Oregon Introduction The Lakeview
private lands partnerships
 A guide to private lands partnerships to conserve Florida wildlife Mark A. Trainor, Rogue Eye Photography David Moynahan Landowner Assistance Program Partnerships with private landowners to conserve Florida
TABLE OF CONTENTS 5.0 FOREST MANAGEMENT PLANNING...
 TABLE OF CONTENTS 5.0 FOREST MANAGEMENT PLANNING... 1 5.1 Planning Framework... 1 5.1.1 Sustainable Forest Management Planning... 1 5.1.2 Five-Year Operating Plan... 1 5.1.3 Annual Operating Plans... 3
EXHIBIT "C" Staff Report
 EXHIBIT "C" Staff Report File Number: Applicant: Account Number: Map Number: Property Owner: Situs Address: Acreage: Zoning: Special Considerations: Gabriel Locatelli 66405 23S133500-02505 PUTIC TRUST
MODULE 5: ECOLOGICAL IMPACTS
 MODULE 5: ECOLOGICAL IMPACTS Purpose This module describes measures for ecological restoration and rehabilitation efforts. The module is primarily focused on fire hazard reduction and its ecological effects.
Notes to the Oregon House, Committee on Agriculture and Forestry SB315A
 April 2, 2001 Notes to the Oregon House, Committee on Agriculture and Forestry SB315A Tim Deboodt OSU Crook County Extension Agent 498 SE Lynn Blvd. Prineville, OR 97754 (541)447-6228 tim.deboodt@orst.edu
Acres 32% 35% Not Suitable. Impervious. Possible UTC. Vegetation. Existing UTC
 Acres A Report on Washington, D.C. s Urban Tree Canopy Why is Tree Canopy Important? Urban tree canopy (UTC) is the layer of leaves, branches, and stems of trees that cover the ground when viewed from
Natural Resource Management of Pipeline Infrastructure
 Natural Resource Management of Pipeline Infrastructure Dan Devlin Director, Bureau of Forestry www.dcnr.state.pa.us Connection between Pipelines & DCNR Commonwealth s forests Fragmentation or reduction
Recommendations for Enhancing the Role of Forests In Climate Change Mitigation and Ecosystem Adaption to Climate Change
 NASF-2015-03 September 15, 2015 www.stateforesters.org Recommendations for Enhancing the Role of Forests In Climate Change Mitigation and Ecosystem Adaption to Climate Change A Policy Statement approved
4. Present Activities and Roles
 4. Present Activities and Roles The present missions, authorities, activities and roles of the various agencies involved with flood protection, floodplain management and flood-damage reduction are identified
A Community Wildfire Protection Plan. Insert signature Block
 A Community Wildfire Protection Plan Insert signature Block A Community Wildfire Protection Plan A Simplified Template Objectives of a Community Wildfire Protection Plan: Comprehensive Forest planning
New Mexico State Forestry Draft Priority Landscapes: Overview of Data and Methods utilized
 New Mexico State Forestry Draft Priority Landscapes: Overview of Data and Methods utilized New Mexico State Forestry has created a draft of priority landscapes to show areas where we would like to focus
NCDA&CS 2012 AGRICULTURAL LANDS ASSESSMENT
 Introduction AGRICULTURAL LANDS ASSESSMENT In the last 10 years, North Carolina has lost 4,600 farms, an 8% decrease. In addition, land in farms has decreased by 6.5%, a total loss of 600,000 acres. Agriculture