AN INVESTIGATION OF THE COMMERCIAL VIABILITY OF PRODUCING PLANTATION-GROWN EUCALYPT FIREWOOD IN THE MOUNT LOFTY RANGES, SA
|
|
|
- Melvin Owens
- 6 years ago
- Views:
Transcription


1 MOUNT LOFTY RANGES FARM FORESTRY GROUP AN INVESTIGATION OF THE COMMERCIAL VIABILITY OF PRODUCING PLANTATION-GROWN EUCALYPT FIREWOOD IN THE MOUNT LOFTY RANGES, SA
2 AN INVESTIGATION OF THE COMMERCIAL VIABILITY OF PRODUCING PLANTATION-GROWN EUCALYPT FIREWOOD IN THE MOUNT LOFTY RANGES, SA Prepared for THE MOUNT LOFTY RANGES FARM FORESTRY GROUP ADELAIDE HILLS REGIONAL DEVELOPMENT BOARD By Mark Poynter Forest & Natural Resource Services PO. Box 2102, East Ivanhoe, VIC Ph. (03) / m.poynter@fnrs.com.au Member: Institute of Foresters of Australia, Association of Consulting Foresters of Australia Ray Borschmann Plantation Development Services Pty. Ltd. 13 Ashwood Ave., Bright, VIC Ph. (03) / borsch@netc.net.au Member: Institute of Foresters of Australia, Association of Consulting Foresters of Australia May 2002 Disclaimer: This report contains information based on a range of projections, forecasts, and assumptions derived from a variety of sources to assist in providing an indication of the commercial viability of particular forestry options. As all forecasts, projections, and assumptions are uncertain, the consultants take no responsibility for the outcome of investment decisions made by groups or individuals on the basis of this report. ii
3 AN INVESTIGATION OF THE COMMERCIAL VIABILITY OF PRODUCING PLANTATION-GROWN EUCALYPT FIREWOOD IN THE MOUNT LOFTY RANGES, SA CONTENTS EXECUTIVE SUMMARY i 1. BACKGROUND 1 2. CURRENT STATE OF FIREWOOD MARKETS ADELAIDE Domestic Firewood Consumption Collection and Sale of Domestic Firewood Purchase Prices Species and Sources of Supply 2.2 REGIONAL SOUTH AUSTRALIA Domestic Firewood Consumption Collection and Sale of Domestic Firewood Purchase Prices Species and Sources of Supply 2.3 MELBOURNE Domestic Firewood Consumption Collection and Sale of Domestic Firewood Purchase Prices Species and Sources of Supply 2.4 REGIONAL VICTORIA WEST OF MELBOURNE Domestic Firewood Consumption Collection and Sale of Domestic Firewood Purchase Prices Species and Sources of Supply 2.5 UNCERTAINTY OF FIREWOOD CONSUMPTION ESTIMATES 2.6 SUMMARY AND CONCLUSIONS 3. MARKET INFLUENCES AND FUTURE TRENDS MARKET INFLUENCES Sustainability of Firewood Supplies Environmental Considerations Marketability of Plantation-grown Firewood Carbon Credits Cost Comparison with Other Heating Options 3.2 FUTURE MARKET TRENDS Firewood Prices Electricity and Gas Prices Overseas Experiences 3.3 CONCLUSIONS 4. POTENTIAL FOR DEVELOPING A FIREWOOD PLANTATION 19 RESOURCE IN THE MOUNT LOFTY RANGES REGION 4.1 REGIONAL LAND CAPABILITY FOR EUCALYPT PLANTATIONS Elevation and Climate Topography Geology and Soil Types iii
4 4.2 AVAILABILITY OF LAND Area Potentially Available for Plantation Development Plantation Area Required for a Sustainable Level of Firewood Production 4.3 ABILITY TO SUPPORT A SUSTAINABLE FIREWOOD PLANTATION RESOURCE Number of Participants Required for Various Levels of Supply Community Attitudes and Landowner Demographics Issues Local Government Planning Issues 4.4 MARKET CONSIDERATIONS 4.5 CONCLUSIONS 5. FIREWOOD PLANTATION RESOURCE MANAGEMENT SELECTION OF SUITABLE SPECIES Firewood Properties and Growth Rates Species with Sawlog Production Capability 5.2 SITE SELECTION AND ESTABLISHMENT 5.3 MANAGEMENT OPTIONS Firewood only Option Firewood and Sawlog Option 5.4 HARVESTING AND PROCESSING OPTIONS AND COSTS Large Scale Production Medium Scale Production Small Scale Production 5.5 COSTS Establishment Management 5.6 RETURNS Wholesale and Retail Prices Methods of Sale 5.7 BASE ECONOMIC PERFORMANCE OF FIREWOOD MANAGEMENT OPTIONS Sugar Gum Firewood Sugar Gum for Firewood and Sawlogs Blue Gum Firewood Blue Gum for Firewood and Sawlogs 5.8 FIREWOOD GROWERS COOPERATIVE 6. COMMERCIAL VIABILITY OF PRODUCING PLANTATION-GROWN. 39 FIREWOOD IN THE MOUNT LOFTY RANGES 6.1 AS A REPLACEMENT LAND USE FOR OUTSIDE INVESTMENT Land Values - Mount Barker District Land Values - Alexandrina District Land Values Yankalilla District Land Suitability Analysis 6.2 AS A REPLACEMENT LAND USE FOR DIRECT LANDOWNER INVESTMENT Comparison with Other Land Uses 6.3 AS AN INTEGRATED COMPLEMENTARY LAND USE 6.4 CONCLUSIONS 7. REFERENCES 51 iv
5 APPENDICES 1. Farm Forestry Technical Note: Harvesting Systems and Marketing Strategies for Firewood Plantations 2. Adelaide Wood Yard Survey April 2002 v
6
7 EXECUTIVE SUMMARY This study considers the potential for growing firewood for domestic consumption in the Mount Lofty Ranges based on its commercial viability under the following circumstances: as a replacement land use suitable for outside investment on a moderate to large scale; as a replacement land use suitable for direct investment by existing landowners; and as an integrated land use undertaken by existing landowners to complement agricultural activities. This was based on an examination of the following factors : the size and location of firewood markets; the factors that currently influence the market or are likely to influence it in the future, and the likely trends in supply and demand that will result from this; the physical and social attributes of the Mount Lofty Ranges that determine its suitability as a potential firewood supply zone; and the costs and returns associated with developing and managing a firewood plantation resource capable of supplying particular markets. Firewood Markets Based on population-based extrapolations from past studies, substantial amounts of firewood are consumed for domestic heating in the immediate vicinity of the Mount Lofty Ranges, including the Adelaide metropolitan area. In addition, there are moderately large firewood markets in other parts of regional South Australia and western Victoria, as well as a very large Melbourne market. Past studies have shown that approximately 50% of all firewood is collected by householders for their own use, with the balance being supplied by commercial producers and retailers. It appears as though the size of commercial firewood markets has remained relatively stable during the past decade. Of the potential markets, only Adelaide and the local regional market offer positive financial returns to firewood growers in the Mount Lofty Ranges. Markets beyond these areas could not be supplied by financially viable plantations unless growers were offered significant subsidies to overcome the very high costs of transport. Even then, market opportunities may be limited by plantation developments currently being encouraged in western Victoria and close to Melbourne. There is some uncertainty as to the size of the Adelaide and local outer Adelaide commercial markets. Some firewood merchants believe it to be substantially less than has been widely supposed during the past decade, but this is contradicted by the number of wood heaters thought to be in the community based on past sales figures. There is currently not enough evidence to overturn the extrapolated estimates outlined in this study. However if seeking to obtain more definitive data about the size of Adelaide s commercial firewood market, conducting interviews with every wood yard proprietor would be preferable to a telephone survey of consumers that captures data from only a very small proportion of the population. Market Influences and Future Trends The study identified the following issues as having an influence on the firewood market: the availability and sustainability of supplies; the marketability of currently non-preferred species including fast-grown plantation wood; environmental factors both positive and negative, including government protection initiatives; cost considerations compared with other forms of heating. It appears that the greatest influences on the firewood market over the next years will be the uncertainty of a continuing supply at reasonable prices, and the nature of government initiatives to regulate the collection and use of firewood in order to protect the environment. As most firewood is thought to come from private land, it is difficult to make reliable predictions about the size and sustainablility of current supply zones. However, it appears as though unless alternative species are used, and/or a plantation resource is developed, current supplies based primarily on red gum will decline substantially in the future. If a sustainable source of supply can be created from a renewable plantation resource, the use of firewood for heating or for electricity generation is an environmentally-superior option to non-renewable energy sources such as conventional coal-fired electricity. i
8 In the USA, the demand for firewood for domestic heating has dropped over the past decade as consumers have recognised the convenience and lower cost of gas heating in particular. A similar trend could be expected in Australian metropolitan areas where high firewood prices have already elevated the cost of wood heating above at least two other options. However, expected increases in the price of electricity and gas, particularly if the Kyoto Protocol Is ratified, should encourage demand for firewood provided a readily available source of supply can be maintained. Environmental concerns surrounding the use of firewood are based on the impacts of its collection on biodiversity, and of its use on air quality. In order to conserve biodiversity, government environmental protection agencies are currently considering a tightening of regulations to restrict firewood collection on public and private land. This will potentially reduce the ability to collect firewood for personal use or commercial sale. At the same time, there is increasing encouragement for plantation development. However, even if substantial plantings are undertaken immediately, it will take at least years before plantation-grown firewood is able to significantly off-set supplies from native forests and woodlands. The impact of firewood collection on biodiversity could also be reduced by broadening firewood production to include waste from other timber production operations, and encouraging the use of a greater range of species to spread the effects of collection more widely. The wood heating industry has gone to significant lengths to address air quality concerns arising from the use of firewood. Considerable effort has been invested in developing advanced technology, low emission heaters to meet the Australian Standard now agreed upon by all states. However despite this, there continues to be strong opposition to the use of wood heaters based on environmental and health concerns in some regions, including inland NSW and northern Tasmania. These areas are typified by very high wood consumption (ie % of householders) and topographic and climatic conditions conducive to the accumulation of wood smoke for lengthy periods. Neither of these factors are applicable to coastal locations such as Adelaide or Melbourne. Moves in both North America and Europe towards cleaner green energy generation from biomass will increase demand for fuelwood in the future. In the USA, the increasing demand for wood energy for electricity generation is more than compensating for a reduction in demand for its use for domestic heating since the mid-1990 s. The development of a sustainable firewood plantation resource is integral to the future of firewood as a source of domestic heating. It would also seem to be worthwhile in anticipation of the transition to more environmentally-friendly, renewable energy sources being encouraged by government policies in Australia and throughout the world. Attributes of the Mount Lofty Ranges The region has physical attributes suitable for the development of a plantation-based firewood industry. In addition there is a relatively large land base, of which up to a quarter is thought to be owned by non-traditional landowners with a more favourable attitude to tree planting and a greater financial ability to participate than is generally the case in other rural regions. An initial realistic and achievable aim would be to target a plantation estate of about 10,000 hectares planted during the next 15 years, or sooner if possible. This would be equivalent to about 2.8% of the 350,000 hectares thought to have potential for commercial tree growing in the region, and should be enough to sustainably meet the commercial firewood requirements of Adelaide and Outer Adelaide where the state s strongest demand exists. Management of a Firewood Plantation Resource Sugar gum is the most promising species for firewood plantation development on sites receiving up to 700 mm. of rainfall per year. In higher rainfall zones, blue gum will grow more quickly but has relatively poor burning qualities. However if it can be successfully marketed, even at a substantial discount to sugar gum, it could be a successful firewood plantation species. Growing sawlogs in conjunction with firewood will not make plantations financially more attractive. The efficient management of a resource capable of supplying the Adelaide and Outer Adelaide commercial markets would require the use of large scale production techniques and would benefit from a growers cooperative able to manage large scale plantation development, management, and marketing to wood yards. In addition, much greater returns are available to landowners who participate in harvesting and marketing through a cooperative, compared to simply selling standing trees to a wood yard. Commercial Viability Assessing the commercial viability of firewood plantations does not necessarily provide an accurate insight into the full extent of firewood plantation development that may occur in the future. This is because many landowners will consider lifestyle and aesthetic issues ahead of economic viability when deciding whether or not to plant trees. Others (either individual landowners or outside investors) who consider economic viability to be important, may take a very optimistic view of growth rates and future prices when making decisions. However, the study indicated that the generally high land values in the region will limit interest in large scale plantation development amongst potential significant investors, and only existing farmers running low profitability sheep and cattle grazing ventures will be attracted to firewood as a replacement land use on a moderate to large scale. ii
9 Even allowing for the significant financial incentives being offered to establish plantations, a land suitability analysis in the Mount Barker, Alexandrina, and Yankalilla Districts showed that only fast-growing blue gum in the high rainfall zones (ie. > 800 mm.) on the Fleurieu Peninsula would produce a Net Present Value (NPV) from firewood production, that strongly exceeded the current value of the land for agriculture. This comparison was based on large-scale plantation development by outside investors leasing land at the accepted market rate of 5% of its value. Other areas that were suitable for outside investment based only on NPV calculated at optimistic low discount rates were the mm. rainfall zone in the Alexandrina and Yankalilla Districts planted to sugar gum, and the same zone planted to blue gum in the Yankalilla District. No areas within the Mount Barker District were suitable due to high land values, and it is assumed that similar high land values in the Adelaide Hills District would make it also unsuitable for investment. Existing farmers considering large scale direct investment in plantations as a replacement land use are likely to compare the economic performance of firewood against their current agricultural enterprises. Using the concept of Gross Margins commonly used to measure agricultural performance, an equivalent Net Present Value was able to be determined to provide a direct comparison with firewood production. This analysis found that for landowners with an optimistic view of future economic conditions (ie. sustained low discount rates), there are opportunities to replace merino wethers or beef cattle with firewood plantations. However, merino ewes and prime lambs will generally be more productive land uses than firewood based on current commodity prices. Essentially the relationship between the economic performances of these differing land uses is a dynamic one which changes frequently with variations in commodity prices and economic conditions. The analysis conducted as part of this study should therefore be considered to be only a snapshot of their relative performance at the present time when high Gross Margins are prevailing as a result of good commodity prices. A similar comparison done three years previously may have shown firewood plantations in a better light. It is now generally accepted that small areas of strategically located, lineal tree plantations as an integrated, complementary land use can significantly enhance the productivity of an existing agricultural primary land use by sheltering crops, pasture or stock in their lee. The accepted general rule is that establishing trees on only 10% of a property s area in windbreaks and shelterbelts can increase agricultural productivity from the property as a whole by 10%. Consequently, landowners considering the merits of establishing firewood plantations in this manner do not necessarily have to consider them in terms of a direct replacement of their existing landuse, in the manner of a plantation investment company. The commercial viability of plantations established as an integrated and complementary land use can only be assessed in conjunction with the agricultural land use on a whole-of-property basis. However, the reality is that establishing windbreaks and shelterbelts on a substantial area of a property will usually reduce its overall commercial productivity for many years before benefits become apparent. This is because tree planting ties up land that previously produced an annual income, it requires a significant initial expenditure, and it takes many years for trees to reach a size sufficient to provide the sheltering benefits that can increase crop or pasture production. However, eventually plantations established in this manner will increase the overall commercial viability of a property, particularly if firewood can be produced and sold periodically from the windbreaks. Conclusions There is a market opportunity to supply firewood to meet the large and lucrative Adelaide and local demand. However it will take years before substantial immediate plantings are able to supply significant quantities to the market. By this time, the demand for firewood may be very different as a result of environmental controls on the collection and use of firewood, or greater consumer preference for more convenient alternatives such as natural gas. On the other hand, firewood is unlikely to disappear as a source of energy, and demand could increase over time if plantations increase the reliability of supply with lower environmental impact, and the prices of conventional energy alternatives gradually rise as is expected. Market uncertainty coupled with the generally high price of land in the Mount Lofty Ranges will limit interest amongst large scale outside investors who do not currently own land in the region. Existing landowners reliant on agriculture would be unlikely to replace their current land use with firewood on a large scale unless commodity prices fall and stabilise at consistently lower levels. The best opportunities for firewood plantation development in the Mount Lofty Ranges are likely to be: as an integrated and complementary land use on moderate to large properties where strategically located, substantial windbreaks and shelterbelts of firewood species can eventually enhance agricultural productivity, thereby providing substantial benefits regardless of the market value of their wood; and as a low maintenance, aesthetic land use on small properties managed by non-traditional owners who are generally not reliant on income from their land. Uptake of incentives to establish trees amongst this group is likely to result in a large number of plantations of only small average size. iii
10
11 1. BACKGROUND The Mount Lofty Ranges Farm Forestry Group (MLRFFG) is promoting private forestry as a potential landuse with important socioeconomic and environmental benefits to the region. The Group is chaired by the CEO of the Adelaide Hills Regional Development Board, and its activities encompass a large elongated region east of Adelaide stretching from Cape Jervis in the south to the Barossa Valley in the north, and to the edge of the Murray River floodplains in the east. In promoting private forestry, the MLRFFG has already commissioned a number of important projects starting in 1997 with a feasibility study and strategy plan which highlighted on-going activities required to advance the Group s vision for the region to eventually contain over 20,000 ha. of private forests. The apparent size of the Adelaide firewood market and the proximity of the Mount Lofty Ranges region to the city, makes growing firewood in plantations a seemingly attractive option that this report examines in detail. In addition, the report considers the potential for producing firewood as part of an integrated eucalypt sawlog / firewood management regime. The basic structure of the report is as follows: Determine the current state of firewood markets in Adelaide, regional South Australia, and western Victoria, including Melbourne. Evaluate the market issues and future trends that will influence the commercial viability of growing firewood in plantations in the Mount Lofty Ranges. Evaluate the potential of the Mount Lofty Ranges region to provide the quantities of suitable land required to service the anticipated market. Evaluate the range of eucalypt species most suitable for growing firewood and/or sawlogs and firewood in the Mount Lofty Ranges. Outline how a large firewood plantation resource in the Mount Lofty Ranges could be managed including appropriate plantation harvesting and product marketing strategies. Conduct an economic analysis of the viability of commercial firewood production in the region, including an indication of its performance in comparison to other existing and potential land uses in the Mount Lofty Ranges. Draw conclusions about the commercial viability of firewood plantations in the region, including where appropriate, the locations where it is most likely to be a viable land use, and the size of resource required to make the region a viable source of future firewood. The study is restricted to an investigation of firewood grown for domestic rather than industrial use. Most industrial firewood is comprised of wood waste generated by wood processing plants and reused on site. In the short term, the demand for industrial firewood is unlikely to increase to the point where it is sourced from native forests or plantations. However if the Kyoto Protocol is ratified there could be an increased demand for fuel wood for power generation in the future. 1

12 2. CURRENT STATE OF FIREWOOD MARKETS Potential markets for firewood grown in plantations in the Mount Lofty Ranges could be: Adelaide South Australian regional areas close to Adelaide and the Mount Lofty Ranges Melbourne Victorian regional areas west of Melbourne A number of past studies were sourced to determine the most up-to-date estimate of current domestic firewood market characteristics, including the recent study by Driscoll et al (2000) which has comprehensively updated the knowledge of firewood usage and market patterns throughout Australia, including South Australia and Victoria. 2.1 ADELAIDE Domestic Firewood Consumption Most past studies have used telephone surveying of householders to estimate Adelaide s level of domestic firewood consumption. These include FTSUT (1989), and more recently Driscoll et al (2000) although their survey was focused on South Australia as a whole rather than Adelaide specifically. To ensure consistency between past estimates, it is important to define the geographic area of Adelaide. This study follows the lead of FTSUT (1989) and others in basing its estimate on the Adelaide Statistical Division (SD) as defined by the Australian Bureau of Statistics. It should be noted that the Adelaide SD includes the most urbanised parts of the Adelaide Hills (see Figure 2.1), whilst the rest of the Mount Lofty Ranges are contained within the Outer Adelaide SD (see Figure 2.2). Figure 2.1 ABS AdelaideStatistical Division Past estimates of Adelaide s annual firewood consumption have been: 1981 Johnston 118,000 tonnes (reported in FTSUT,1989) 1986 Kerby and Beer ,000 tonnes(reported in FTSUT,1989) 1988 FTSUT 141,600 tonnes 1989 Todd and Singline 168,000 tonnes (reported in FTSUT,1989) 1989 Rogers 140,000 tonnes 1999 PIRSA 300,000 tonnes (from Future Directions for Farm Forestry Part 2) 2000 Driscoll et al ,000 tonnes (extrapolation from their state estimate) 2
13 Estimates are based on the Adelaide SD, except for PIRSA (1999) and Driscoll et al (2000) where the extent of Adelaide is not specifically defined. No indication is given in PIRSA (1999) as to how the estimate of 300,000 tonnes was derived, although it is suspected that this may have included both the Adelaide and Outer Adelaide Statistical Divisions (England, pers. comm., 3/02) The estimate attributed to Driscoll et al (2000), was extrapolated from their South Australian state consumption estimate of ,000 tonnes, by multiplying it by 34%, which is the proportion of the state s consumption that Rogers (1989) found to be consumed in Adelaide. This aligns with the nationwide finding by Driscoll et al (2000) that only a third of all firewood consumption is in capital cities despite the fact that they contain more than two thirds of the nation s households. Given that anecdotal evidence suggests that firewood consumption has increased in each of the past 15 years up to the late 1990 s (Geddes Management, 1997), it seems likely that the lower end of the consumption range extrapolated from Driscoll et al (2000) ie. 108,000 tonnes, is lower than actual consumption. As no telephone survey was conducted as part of this study, our estimate of Adelaide s current level of consumption relies on extrapolation from past estimates based on documented population increases and perceived trends in firewood use during the intervening period. The FTSUT (1989) survey produced detailed information about the proportion of Adelaide s households that use wood as either a primary or secondary heating source, and the average consumption per household. This was then used as the basis for extrapolation to the present as follows: The FTSUT survey conducted in 1988 found that 21.1% of households in the Adelaide SD used firewood as either a primary or secondary source of heating, at an average rate of 1.9 tonnes per annum. Using the number of households as per the 1986 ABS Census they were then able to calculate annual firewood consumption. From 1986 to 1996, ABS Census data shows that the number of households in the Adelaide SD increased from approximately 361,000 to 418,000. Assuming a similar rate of growth since 1996, it is assumed there are now approximately 445,000 households in the Adelaide SD. Assuming the same proportion of households use firewood at the same rate per household as in 1988, Adelaide s current annual firewood consumption can be estimated at 180,000 tonnes. However, this is likely to be an upper limit, as it is expected that improved heater technology would have caused average per household usage to fall since In addition to this, the proportion of households using firewood is also likely to have fallen in accordance with increasing prices and the greater availability of alternatives such as natural gas. Unfortunately there is no recent South Australian or Victorian data to quantify these perceived trends. However recent Victorian information suggests that an average Melbourne household could be heated using only 1.7 tonnes of firewood per annum (SAE, 2000), which is 0.2 tonnes /annum less than the average Adelaide household used in 1988 according to FTSUT (1989). Accepting the anecdotal evidence that firewood usage has risen since 1988 it is not unreasonable to assume the lower end of the range of Adelaide s current firewood consumption to be of the order of 150,000 tonnes, which is higher than 1989 consumption estimates. Therefore, using this method with its many assumptions, Adelaide s annual firewood consumption was estimated to be within the range of ,000 tonnes per annum. Although representing only a modest increase in firewood consumption during the past 13 years, it is similar to findings in Melbourne where firewood consumption has remained relatively stable during the same period Collection and Sale of Domestic Firewood Driscoll et al (2000) found that only 34.5% of domestic firewood consumed in South Australia had been purchased, which is significantly less than the national average of approximately 50%. The balance is collected by householders for their own use. City consumers have less opportunity to collect their own wood, and this is reflected in findings by FTSUT (1989) that 43.2% of firewood consumed in Adelaide was purchased from various businesses, compared with the statewide figure of 34.5%. There is a strong possibility that the proportion of householders who purchase firewood has risen since 1989, as the ability of householders to collect their own firewood has fallen. Using the 1989 proportion of Adelaide s firewood-consuming householders who purchase firewood (ie. 43.2%), and assuming Adelaide s total annual consumption to be ,000 tonnes (see 2.1.1), the size of Adelaide s commercial firewood market can be estimated at 65-78,000 tonnes. However, if it is assumed that the proportion of firewood purchased by city consumers has increased to 50% in the 13 years since the FTSUT study (ie. equivalent to the national average), the size of Adelaide s commercial firewood market can be estimated at 75-90,000 tonnes. Combining the results from these two scenarios gives a range of 65-90,000 tonnes as the estimated size of Adelaide s commercial firewood market. 3
14 2.1.3 Purchase Prices It is difficult to determine purchase prices for firewood for the following reasons: they vary according to whether firewood is purchased from wood merchants (retail) or small independent suppliers (wholesale); they vary in accordance with the season of purchase ie. summer or winter; and they vary in accordance with the nature of the purchased product, ie. split or unsplit, and whether it is picked up or delivered. Although survey results based on wood yard price studies often fail to clearly delineate the nature of the product, they are likely to be a relatively good reflection of actual purchase prices in Adelaide where approximately 88% of purchased firewood is from wood merchants (FTSUT, 1989). Neagle (1994) found that the retail price of red gum and mallee firewood sold by Adelaide wood merchants rose from $45-55 per tonne in 1982, to $ per tonne (average $130 per tonne) by Since then, prices have continued to rise, with ANU Forestry (2001) reporting prices of from $ per tonne, although it is acknowledged that prices at that time were influenced by the higher than usual cost of petrol. The Adelaide Wood Yard Survey (2002) reported retail prices of from $ per tonne from six Adelaide wood yards, with an average of $182 per tonne. It is apparent that the current retail price of firewood in Adelaide is considerably higher than the national average of $120 per tonne assumed by Driscoll et al (2000). Determining the wholesale price that wood merchants pay to their suppliers is difficult as most are unwilling to provide this information (Driscoll et al, 2000). A very limited survey by Geddes Management (1997) found that Adelaide wood yards generally paid their suppliers around $100 per dry tonne for cut and split wood delivered to the yard. The Adelaide Wood Yard Survey (2002) updated this, reporting an indicative wholesale price of $125 per tonne delivered to the yard Species and Sources of Supply Driscoll et al (2000) and the Adelaide Wood Yard Survey (2002) found that the major species currently being used for domestic firewood in South Australia and Adelaide is red gum (Eucalyptus camaldulensis). This represents a marked shift from a decade earlier when Rogers (1990) reported that mallee roots and stems comprised about 40% of the commercial market. It is now estimated that mallee comprises only 6% of South Australia s annual firewood harvest, having been substantially replaced by red gum as supplies have declined (Driscoll et al, 2000). Driscoll et al (2000) found that the vast majority of South Australian firewood was sourced from private land, with only about 1600 tonnes obtained from public forest reserves. More may be obtained under permit from other small public land blocks but amounts are thought to be insignificant. A recent survey of five South Australian firewood retailers identified the major sources of supply to be riverine forests and woodlands in the Murray River valley. Three obtained their supplies from areas within 200 km. of Adelaide, whilst two obtained supplies from distances of greater than 300 km. (Driscoll et al, 2000). Despite these findings, significant amounts of red gum also now come from south western NSW (Bulman, pers. comm., 2002). This is confirmed by State Forests NSW who estimate between 20-25,000 tonnes of red gum is trucked to the Adelaide area each year from NSW public and private forests west of Balranald (Murray, pers. comm., 3/02). This was contradicted to a degree by six Adelaide wood yards who claim to be supplied mainly from operations near Deniliquin (about 200 km. east of Balranald), as well as getting some minor supplies from south western Victoria (Adelaide Wood Yard Survey, 2002). Apparently no firewood is obtained from the Mount Lofty Ranges area at present. 2.2 REGIONAL SOUTH AUSTRALIA The South Australian regional areas considered to be potential markets for plantation-grown firewood from the Mount Lofty Ranges were the following Australian Bureau of Statistics Divisions (data from 1996 Census) : Outer Adelaide - Population: 99,300 No. of Households: 38,200 Yorke and Lower North - Population: 41,800 No. of Households: 16,700 Murraylands - Population: 65,500 No. of Households: 26,200 South East - Population: 59,500 No. of Households: 22,900 North Spencer Gulf - Population: Approx. 55,000 No. of Households: 22,000 Note: The Outer Adelaide Statistical Region includes most of the Mount Lofty Ranges Domestic Firewood Consumption Rogers (1989) reported substantial variation in household consumption between city and country areas. Adelaide households were found to consume much smaller amounts, an average of 2.0 tonnes per annum, whilst regional households consumed variable amounts up to an average of 6.3 tonnes per annum in the south east of the State. 4
 reported the proportion of householders using firewood in some of the regions listed above, and the average amount used by these households.")
15 Figure 2.2 ABS South Australian Statistical Divisions Rogers (1989) reported the proportion of householders using firewood in some of the regions listed above, and the average amount used by these households. In the absence of any more recent information, if it is assumed that these figures are still relevant, they can be used to estimate firewood consumption in each region as follows: Outer Adelaide South East North Spencer Gulf Murraylands Yorke & Lower North 50% of households use firewood at an average of 3.2 tonnes per annum Estimated annual consumption : 60-65,000 tonnes Major centre Mount Barker 50% of households use firewood at an average of 6.3 tonnes per annum Estimated annual consumption : 70 75,000 tonnes Major centres Mount Gambier (428 km.), Narracoorte (325 km.) 15% of households use firewood at an average of 3.0 tonnes per annum Estimated annual consumption : 10 15,000 tonnes Major centres Whyalla (454 km.), Port Pirie (264 km.), Port Augusta (378 km.) Average householder usage of 2.7 tonnes per annum, no proportion given Estimated annual consumption : 70 75,000 tonnes Major centres Murray Bridge (45 km.), Renmark (381 km.) Average householder usage of 2.3 tonnes per annum, no proportion given Estimated annual consumption : 15 20,000 tonnes Major centre Clare (200 km.) Notes: Distances in brackets are from Mount Barker which has been used as a nominal central point within the Mount Lofty Ranges from which firewood distribution could occur in the event of supplies being sent to regional markets. The North Spencer Gulf estimate is based on the fact that in the Northern Statistical Division as a whole, only about 15% of householders use firewood at an average rate of 4.1 tonnes per annum. It was assumed that the fact that the North Spencer Gulf region of the Division is more urbanised will cause an estimated decrease in householder consumption. Consumption in Murraylands and Yorke & Lower North are based on an assumption that 50% of households in these regions use wood even though Rogers (1989) gave no indication of proportional usage in these regions. Overall, based on extrapolation from previous studies, it appears as though areas of regional South Australia thought to be close enough to be potential markets for plantation-grown wood from the Mount Lofty Ranges, consume an estimated ,000 tonnes of firewood per annum Collection and Sale of Domestic Firewood 5
16 Driscoll et al (2000) found that only 34.5% of domestic firewood consumed in South Australia had been purchased. This is significantly less than the national average of approximately 50%. The balance is collected by householders for their own use. The proportion of firewood purchased by consumers in regional areas is likely to be lower than in Adelaide because country residents have greater opportunity to collect their own wood. Rogers (1989) estimated that in the South East and Yorke & Lower North Statistical Divisions, only 10% of all firewood consumption was comprised of wood that had been purchased. However in the Northern Statistical Division, including the northern Spencer Gulf area, about 65% of firewood was purchased. No information was given about the reasons for these disparities, or about other regional areas. Assuming that 43.2% of Adelaide firewood is purchased (FTSUT, 1989), calculations can be made which show that about 30% of firewood in regional areas is purchased in order to give a state average of 34.5% (see above). However, assuming that the Outer Adelaide region displays similar purchase and collection characteristics to Adelaide, than the proportion of firewood purchased in the other regional areas must be even lower than 30% to achieve the overall state average mentioned above. Current estimates of the annual commercial firewood market for each region were calculated by assuming that 43% of Outer Adelaide s consumption was purchased (as for Adelaide), and that 25% of firewood consumed in all other regions was purchased. This gave the following estimates: Outer Adelaide ,000 tonnes South East ,000 tonnes North Spencer Gulf - 2 4,000 tonnes Murraylands ,000 tonnes Yorke and Lower North - 4 5,000 tonnes This gives a total commercial market of 66 77,000 tonnes per annum. Within each region, the consumption of purchased firewood is assumed to be concentrated in the major regional centres mentioned in section (see above) Purchase Prices It is difficult to determine purchase prices for firewood in regional areas for the following reasons: most studies are based on surveys of city wood merchants; a much greater proportion of firewood in regional areas is purchased relatively cheaply from small independent suppliers rather than wood merchants who charge a higher retail price. Results from Adelaide wood yard studies are unlikely to be a good reflection of actual purchase prices in regional areas that are closer to the resource, and where a much lower proportion of purchased firewood is obtained from wood merchants. ANU Forestry (2001) reported retail prices from Murray Bridge (in the Murraylands region) of $135 per tonne for red gum and mallee. Anecdotal evidence suggests that firewood can be purchased in regional areas such as the South East for as low as $60-70 per tonne (England, pers. comm. 3/02). It is assumed that this price applies to purchase from small, part time suppliers rather than from wood yards. Based on the above it is difficult to estimate retail and wholesale prices for firewood in regional South Australia. It is expected that they would vary widely in accordance with the type of firewood and the distance from sources of supply. Local species could be sold for quite low prices whereas red gum may sell for prices as high as Adelaide in areas located at great distance from sources of supply Species and Sources of Supply As for Adelaide and South Australia as a whole, the regional firewood market is apparently dominated by red gum, but its proportional use compared to other local eucalypts varies in accordance with proximity to suitable riverine forests and woodlands (Driscoll et al, 2000). Almost all firewood is sourced from private land with only a very small amount coming from public land (see section 2.1.4) It is to be expected that most firewood sold in regional areas is sourced from much closer to the point of sale compared to firewood sold in Adelaide. 2.3 MELBOURNE Melbourne is located 710 km. from Mount Barker which is a nominal central location within the Mount Lofty Ranges Domestic Firewood Consumption Since 1989, there have been two studies that have included estimates of Melbourne s domestic firewood consumption. FTSUT (1989) estimated annual consumption at that time to be 400,000 tonnes, whilst Reed Sturgess and Associates (1995) estimated a usage range of ,000 tonnes per annum. 6
17 Driscoll et al (2000), referring to these studies, estimated current domestic firewood consumption in Victoria to be within a range of from 0.96 to 1.48 million tonnes per annum. This is similar to the range of state consumption estimated by Economists at Large (2000) of 0.72 to 1.5 million tonnes per annum. Melbourne was found to consume 40% of the state s firewood (FTSUT, 1989). When this percentage is applied to Driscoll s estimated Victorian consumption (as above), Melbourne s domestic firewood consumption can be estimated at ,000 tonnes per annum. However, in view of the earlier studies, and anecdotal evidence that firewood consumption has been relatively stable in Melbourne during the past decade, a more realistic estimate of the city s firewood consumption is probably 340, ,000 tonnes per annum Collection and Sale of Domestic Firewood Driscoll et al (2000) found that 44.1% of domestic firewood consumed in Victoria had been purchased which is less than the national average of approximately 50%. The balance is collected by householders for their own use. Melbourne s consumers have less opportunity to collect their own wood and it is to be expected that the percentage of firewood purchased would be higher there than for the state as a whole. Reed Sturgess and Associates (1995) found that only approximately 23% of Victoria s rural firewood consumers purchase firewood. Therefore, based on the assumption that approximately two-thirds of the state s firewood is consumed in country areas (see above), it appears as though about 85% of firewood consumed in Melbourne is purchased. However this contrasts sharply with the findings of FTSUT (1989) who reported that only approximately 40% of Melbourne s firewood was purchased. Averaging these results, gives an estimate of 62% of Melbourne s firewood that is thought to be purchased which equates to a commercial firewood market of approximately ,000 tonnes per annum Purchase Prices Economists at Large (2000) reported that Melbourne firewood merchants pay their suppliers $85-95 per tonne, and in turn sell the split, dry, and delivered product to consumers for $ per tonne. This is based on red gum which dominates Melbourne s commercial firewood market. However, anecdotal evidence suggests that consumers can pay as much as 20-50% more for Red Gum when conditions in supply zones limit its availability, as occurred during a recent very wet winter (Corangamite Farm Forestry Network, reported in Economists at Large, 2000). Hamilton (2002) reported that firewood merchants in Melbourne are selling split, dry Sugar Gum for as much as $140 per m 3 (ie. $180 per tonne), and are paying their suppliers $ per tonne. It is likely that many consumers are able to purchase firewood for lower prices than stated above, particularly where they can deal with small independent suppliers and are willing to pick up wood that has not been split Species and Sources of Supply Driscoll et al (2000) found that the major species currently being used as domestic firewood in Melbourne is red gum (Eucalyptus camaldulensis), which makes up about a third of firewood consumed, and the majority (~80%) of what is sold. A further third of Melbourne s firewood is comprised of mixed local eucalypts, comprised of stringybarks, peppermints, and gum. It is assumed that only a small proportion of this is sold, with most being collected by consumers for their own use. Box and ironbark species comprise about 15% of annual firewood consumption. Box species comprise about 12% of what was sold by retailers who were surveyed by Driscoll et al (2000). The balance of annual consumption is comprised of a variety of species including mallee stems and roots (~3%), pine waste, recycled timber, and Jarrah from Western Australia which surprisingly comprises about 1.3% of annual consumption (Driscoll et al, 2000). No data was presented on the use of Sugar Gum which may reflect the fact that this species is not readily identifiable by most wood merchants and consumers, as it is known that significant quantities are now being sold in Melbourne by at least five wood yards. (Hamilton, 2002). Driscoll et al (2000) found that the majority of Victoria s firewood was sourced from private land, with minor but significant collection from roadsides and public land. Reed Sturgess and Associates (1995) found that firewood harvested under permit from public land in Victoria during the period from 1973/74 to 1993/94 varied from about ,000 tonnes per annum. The most recent harvest figure is 82,000 tonnes from 1997/98 (Driscoll et al, 2000). These figures are likely to under estimate the true amount taken from public land as it is common for permit holders to remove more than has been paid for. Most timber sold in city wood yards is sourced from riverine forests and woodlands on private land in northern Victoria and southern NSW (Driscoll et al, 2000). A limited survey of retailers found that firewood is transported from between 50 and 450 km. from where it was harvested, with a mean maximum distance of 330 km.. Eleven of 14 retailers surveyed obtained firewood from maximum distances exceeding 300 km., including four exceeding 400 km., and one 500 km. (Driscoll et al, 2000). 7
18 2.4 REGIONAL VICTORIA WEST OF MELBOURNE The Victorian regional areas that are potential markets for plantation-grown firewood from the Mount Lofty Ranges are the following Australian Bureau of Statistics Divisions : Mallee - Population: 83,300 No. of Households: 32,000 Wimmera - Population: 50,100 No. of Households: 20,000 Western District - Population: 96,700 No. of Households: 37,200 Barwon - Population: 228,200 No. of Households: 87,800 Central Highlands - Population: 129,600 No. of Households: 49,800 Loddon - Population: 150,500 No. of Households: 87,800 Note: Data from the Australian Bureau of Statistics 1996 Census Domestic Firewood Consumption In estimating firewood usage in regional areas it is important to delineate between farm and non-farm (or town) usage. Drawing on past survey results, as well as the results of their own surveys, Reed Sturgess and Associates (1995) were able to make the following assumptions that are relevant to estimating domestic firewood consumption in regional Victoria: farm households generally comprise about 7% of all households within a region; 75% of farm households use firewood; 33% of non-farm or town households use firewood; average consumption of firewood by farm households is 4.6 tonnes per annum; average consumption of firewood by non-farm households is 3.3 tonnes per annum; Applying these assumptions to the regional population and household figures listed above, gave the following estimates of domestic firewood consumption in regional Victoria: Mallee - Total annual consumption 40,000 tonnes - Major population centre Mildura (455 km. from Mount Barker) Wimmera - Total annual consumption 25,000 tonnes - Major population centre Horsham (412 km. from Mount Barker) - Western District - Total annual consumption 46,000 tonnes - Major population centres Portland (543 km.), Hamilton (498 km.) Barwon - Total annual consumption 110,000 tonnes - Major population centres Geelong (689 km.), Warrnambool (598 km.) Central Highlands - Total annual consumption 63,000 tonnes - Major population centres Ballarat (599 km.), Ararat (507 km.) Loddon - Total annual consumption 72,000 tonnes - Major centre Bendigo (649 km.) Note: Distances in brackets are from Mount Barker which has been used as a nominal central point within the Mount Lofty Ranges from which firewood distribution could occur in the event of supplies being sent to Victorian markets Collection and Sale of Domestic Firewood From surveys conducted in regional Victoria, Reed Sturgess and Associates (1995) found that : only 15% of firewood-using farm households purchase firewood; and about 40% of firewood-using non-farm households purchase firewood. Consequently, compared to the state as a whole, and particularly compared to Melbourne, a much higher proportion of regional consumers collect firewood for their own use, rather than purchase it from merchants and suppliers. 8

19 Figure 2.3 ABS Victorian Statistical Divisions Applying these findings to the overall estimates of regional consumption outlined in above, the size of the western Victorian regional commercial firewood market was estimated at approximately 125,000 tonnes per annum, spread across the regions as follows: Mallee Wimmera Western District Barwon Central Highlands Loddon - 14,000 t./annum - 9,000 t./annum - 16,000 t./annum - 38,000 t./annum - 22,000 t./annum - 26,000 t./annum Purchase Prices Regional consumers are able to purchase firewood for lower prices than are paid by Melbourne consumers (see section 2.3.3), particularly where they can deal with small independent suppliers and are willing to pick up wood that has not been split. A recent market survey found that sugar gum, box, and red gum was retailing in the Ballarat Geelong area for $ per tonne. In smaller regional centres however, prices were lower ie. $100 per tonne for red gum, mallee, and box at Mildura, and $ for stringybark and peppermint in the Latrobe Valley (ANU Forestry, 2001). In western Victorian centres such as Colac, Ballarat, and Geelong, sugar gum is sold for $ per tonne (Hamilton, 2002). Most of these prices were obtained from a survey of firewood merchants whose prices would be expected to be significantly higher than if wood was purchased from small itinerant and occasional sellers who are more prevalent in regional areas (ANU Forestry, 2001). Determining the wholesale price that wood merchants pay to their suppliers is difficult as most are unwilling to provide this information (Driscoll et al, 2000). However, information from Adelaide would suggest that the wholesale price is from $20-30 per tonne less than retail prices Species and Sources of Supply As most firewood consumed in regional areas is collected rather than purchased, it is likely that the species used is strongly correlated to the species composition of local forests. In regions such as the northern Mallee, the Wimmera, and the Western District where red gum is present, it is likely to be a preferred species, whilst in all other regions, box species seem to be preferred, with local stringybark used where box is scarce. Sugar gum is a significant component of the commercial firewood market in south western Victoria (Hamilton, 2002). 9
20 Driscoll et al (2000) found that the majority of Victoria s firewood was sourced from private land, with minor but significant collection from roadsides and public land. The proportion of firewood sourced from public land is likely to be higher in regional areas (see section 2.3.4). Firewood burnt in regional areas is likely to have been sourced from much closer than that sold to city consumers. 2.5 UNCERTAINTY OF FIREWOOD CONSUMPTION ESTIMATES The reliance of the above firewood consumption estimates on extrapolations from past consumer surveys, carries with it the uncertainties associated with assuming consumption levels over very large populations from the results obtained from very the small proportional samples from which the results of these past surveys were derived. It is not inconceivable that small overestimates of firewood usage derived from a small sample of telephone survey respondents, could greatly overestimate consumption when extrapolated across the population of a major city. For example: For a city of approximately 450,000 households (ie. Adelaide), a telephone survey of 1000 households could find that 20% used firewood eg. 200 households at 2 tonne / annum each. An average over-estimation of usage of only half a trailer load per annum per household (ie tonne) amongst this sample group, would result in an overestimation of the city s firewood consumption of 22,500 tonnes per annum. Whilst, an over-estimation of a trailer load, would result in a 45,000 tonne overestimation of city consumption. There is anecdotal evidence that the size of Adelaide s commercial market may be substantially less than our extrapolations from past surveys show. Two of six Adelaide wood yards surveyed as part of this project believe the size of Adelaide s commercial firewood market to be only 20-25,000 tonnes per annum (Adelaide Wood Yard Survey, 2002 see Appendix 2). This is loosely supported by comments made by NSW State Forests personnel who expressed grave doubt at the notion that the huge estimates of firewood consumption for Melbourne and Adelaide are largely supplied from south western NSW (see section 3.1.1). Contradicting this to some extent, the Australian Home Heating Association makes the point that if total consumption for Adelaide (ie. commercial market plus privately collected firewood) is only of the order of 50,000 tonnes per annum, and average per household use is 2 tonnes per annum (Rogers, 1990), than there must only about 25,000 wood heaters in Adelaide. AHHA sales figures suggest this grossly underestimates the actual number of wood heaters operated in Adelaide (Mogg, pers. comm). 2.6 SUMMARY AND CONCLUSIONS Based on extrapolations from past studies, the current size of the commercial firewood market in regions considered to have some potential for supply from a significant plantation development in the Mount Lofty Ranges is large and wide-spread across an extensive area. Considering these estimates in association with the findings of Driscoll et al (2000), firewood consumption since 1988 appears to have increased only slightly in South Australia, whilst dropping slightly in Victoria. This is supported anecdotally by fuel merchant members of the Australian Home Heating Association who report a stable level of demand for firewood over the past decade (Mogg, pers. comm.). Table 2.1 Summary of Firewood Market Estimates Factor Adelaide MARKET LOCALITY Regional South Australia Melbourne Western Victoria Firewood Consumption (tonnes / annum) Commercial Market (tonnes / annum) Retail Price (wood yard) ($ / tonne) Wholesale Price ($ / tonne) , , , , , , , ,000 $ $ $ $ $ $ $85-95 $ There is currently not enough evidence to overturn the extrapolated estimates outlined above. However If seeking to obtain more definitive data about the size of Adelaide s commercial firewood market in the future, it would appear that conducting interviews with every wood yard proprietor would be preferable to a telephone survey of consumers that captures data from only a very small proportion of users. 10
21 3. MARKET INFLUENCES AND FUTURE TRENDS 3.1 MARKET INFLUENCES The next 15 to 20 years will be critical in determining the on-going viability of firewood as a domestic energy option. This is the time it will take for any plantation developments undertaken immediately to start supplying significant quantities of wood to the market. Until this occurs, the market will have to rely on native forest timber which may not be available in sufficient quantities to fully satisfy demand. Failure to meet demand could result in large numbers of people deserting the market in favour of other heating options, some of which are already more cost-effective than firewood in many situations. The market during this period will be influenced by a number of factors such as: sustainability of supply; environmental factors both positive and negative; and cost considerations compared with other forms of heating. In addition to these, other factors such as the marketability of plantation-grown firewood, and the potential to obtain carbon credits for growing firewood will be important in determining whether purpose-grown plantations are indeed able to fulfill the role required for firewood to remain as a viable home heating alternative Sustainability of Firewood Supplies At the present time it is difficult to predict with any certainty the sustainability of current firewood supplies at the estimated levels of demand. This is because almost all firewood used in South Australia, and most used in Victoria, is thought to be sourced from private lands for which there is no knowledge of the area or state of the resource. However in view of the annual amounts of firewood being consumed and the over-reliance on distant riverine red gum forests, it seems unlikely that supplies can be maintained in their current form for too much longer (Driscoll et al, 2000). The CSIRO Sustainable Ecosystems unit are currently working on a project designed to assess the sustainability of firewood resources in the Murray Darling basin which is thought to be meeting most of the current demand from Adelaide, Melbourne, Sydney and Canberra. The results of this study should give a clearer picture of the ability of the resource to meet future demand. They are expected to be available in early 2003 (Freudenburger, pers. comm. 3/02). The over-reliance on red gum firewood is thought to be due to wood heater manufacturers creating a preferential demand by using it as a test species, and then subsequently recommending it to consumers as a requirement for optimal appliance operation (Sonogan,1998). Wood yards have been forced to respond to this demand rather than sourcing firewood of perceived inferior quality from closer areas. Driscoll et al (2000) reported that demand for red gum firewood in Melbourne is strong enough to drive wood yards to obtain supplies from km. away. Similarly in Sydney, supplies are being obtained from distant sources, in some instances the same sources that supply the Melbourne market. In Canberra, wood merchants are sourcing firewood from the NSW wheat and cotton belt, up to 500 km. away (Environment Australia, 2001). Red gum also comprises about 50% of the firewood consumed in Adelaide with significant quantities also being obtained from the NSW riverina (Murray, pers. comm. 3/02). An estimated 20-25,000 tonnes of Red Gum is currently supplied to the Adelaide market from southern NSW, of which approximately 11,000 tonnes is sustainably produced from public forests. The balance is sourced from private land in the area, mostly clearing up a backlog of residues from timber production operations conducted over the past years. This part of the annual supply is not sustainable, but it is difficult to know how long it will last (Murray, pers. comm., 3/02). It seems likely that the ability to maintain an on-going and sustainable supply of firewood will depend on diversifying the sources of supply. Sonogan (1998) believes that consumers need to be made aware of the firewood qualities of a range of species to ensure that supply pressures are more evenly spread across a range of forest and woodland communities, as well as creating a demand for species that can be readily grown in plantations, or are by-products of other timber production activities. Currently most red gum firewood sourced from southern NSW is from residues from sawlog operations, and there is some potential to produce firewood in the future from silvicultural thinnings from public forests (Murray pers. comm.,3/02). Some firewood is also produced in Victoria as a by-product from sawlog harvesting in public forests, and there is potential for this to be expanded, including production from silvicultural thinnings. In Victoria, where the demand for firewood remains steady, resource depletion, and environmental constraints and the rationalisation of forest operations resulting from recent changes to government policy, are beginning to restrict supplies from traditional sources (Hamilton, 2000). 11
22 In South Australia, firewood production from public land is very minor, and so government decisions are less likely to affect supplies. However as most of the state s firewood is thought to come from NSW and Victoria, changes to land management policy relating to both private and public land in those states has great potential to affect its supply of firewood. An example of this is the recent government decision (arising from a CSIRO study), to clear and develop 35,000 hectares of mallee near Wentworth in south western NSW in exchange for committing currently leased areas into conservation reserves. As the mallee is cleared significant volumes of wood are being produced with potential to supply the Adelaide firewood market. Currently firewood suppliers have shown no interest in utilising this resource, although some is now being sold for charcoal production. The NSW government is now under pressure to overturn its decision to allow the clearing, but if it is allowed to continue it has potential to be a significant source of supply for South Australian markets for a number of years (Murray pers. comm.,3/02; and Freudenburger pers. comm., 3/02). Most firewood researchers consider the development of plantations to be essential to ensure the sustainability of future supplies. Although governments have been encouraging hardwood plantation development in recent years, there should be concern at the current low rate of firewood plantings on private land. The recent extensive hardwood plantation development in Green Triangle area of south western Victoria and south eastern South Australia has been almost exclusively blue gum (E.globulus) planted for export woodchips. Despite this, there is some potential for part of this resource to be utilised for firewood where export sales are unable to be negotiated, or where the species has been inappropriately established on poor sites and is unable to meet the productivity required for economic pulpwood harvesting. Major pulpwood plantation programs now underway in south east Asia also make it more likely that a proportion of the wood being grown in the Green Triangle will ultimately be sold for firewood. However even if substantial areas of firewood plantation were to be established immediately, it will probably take years before they are able to substantially supplement or replace supplies from traditional sources. If firewood becomes scarce during this period, rising prices could effectively remove any advantage that firewood may have over other forms of heating. Although the evidence suggests that firewood supplies are currently not on a sustainable footing, it appears that long term sustainable supply is possible if the industry shifts its focus to a broader range of native forest species, as well as plantations (Driscoll et al, 2000) Environmental Considerations The use of firewood for domestic home heating has both positive and negative impacts on the environment. The ability to produce and use firewood in a manner that reduces environmental impacts compared to other alternatives will be an important determinant of its future demand. Greenhouse Effect Apart from solar energy, every fuel burnt for heating emits gases that contribute to the Greenhouse Effect. Emissions from the burning of firewood account for less than 1% of Australia s greenhouse gas emissions, and comprises about 10% of the emissions produced from the heating or cooling of residential dwellings (PIRSA, 1999). A comparison between annual Carbon Dioxide emissions (as a measure of greenhouse gas emission) for various home heating options found that firewood burnt in a slow combustion wood heater produced 1.7 tonnes of Carbon Dioxide per year. This compares very favourably with reverse cycle air conditioning (2.6 tonnes / year) and electric fan heaters (6.0 tonnes / year), although not quite as good as natural gas space heating which emits only tonnes per year (SEA, 2000). These comparisons were based on heating a 60 m 2 space for a certain period each year. In reality the amount of carbon dioxide emitted from any slow combustion wood heater will vary with the amount of wood burnt, the quality of the wood (ie. how dry it is), and the efficiency of the particular heater being used. Nevertheless, the comparison indicates that firewood can be a relatively good heating option in terms of minimising greenhouse impacts, although it is not clear whether its emission level includes the use of fossil fuels required to harvest and transport it to the consumer. Renewability Although it appears as though firewood supplies are not currently being managed sustainably, wood is nevertheless a renewable resource unlike natural gas and coal-burned electricity which are its main competitors for home heating. If firewood supplies can be made sustainable by broadening the harvest to include a wider range of species, utilising waste material from other timber production operations, and eventually sourcing substantial supplies from purpose-grown plantations, then it will have a distinct advantage over the use of other heating options that rely on finite resources. Native Fauna Current firewood production from remnant private forests and woodlands is having an adverse environmental impact by removing standing and fallen dead timber that provides important habitat for a range of birds, reptiles, and small ground-dwelling mammals. Continued unsustainable removal of firewood from woodlands is likely to have long term detrimental effects on biodiversity (Environment Australia, 2001). The South Australian National Parks and Wildlife Service is currently drafting an Action Plan for Firewood Collection and Use that will make recommendations to strengthen existing legislation to protect biodiversity that may be under threat from firewood collection in some areas. The draft Plan acknowledges the potential environmental benefits to be gained from encouraging the development of a sustainable firewood plantation resource that shifts firewood production away native forests and woodlands (Dillon, pers. comm., 4/02). 12
23 Air quality In areas of high firewood consumption, community health issues related to wood smoke from slow combustion heaters is an important consideration. In the USA, wood smoke pollution associated with the use of residential wood heaters is a major issue, particularly in mountainous inland areas that experience very cold winters typified by still nights with air inversion layers. Many states and cities have introduced restrictions on the use of wood heaters to minimise air pollution under certain climatic conditions (CAR, 2001). These include time restrictions on use (ie. no overnight burning), and financial assistance to replace old heaters with more efficient modern models that can reduce particulate emissions by more than 85% (PSCAA, 2001). In Australia, air quality issues are not as prevalent as many consumers live in coastal locations where climatic conditions are not as conducive to smoke accumulation. However some Australian inland locations where wood smoke pollution problems occur are Launceston in northern Tasmania, Armidale in northern New South Wales, and Canberra. At Armidale, local council data shows that wood heater usage is very high, with 47% of town households using them, and a further 8% using open fires. The Armidale Air Quality Research Group (1997) found that wood heaters were almost certainly the source of all major air pollutants in winter, which are otherwise undetectable during summer months when heaters are not in use. Similarly in Launceston, which also has a very high proportion of wood-consuming households, health problems associated with the burning of firewood have also been reported. Wood smoke pollution at Launceston is thought to be largely due to the topography of the city which is centred within a basin of surrounding hills which can restrict air movement for periods of days at a time, allowing a build-up of air pollutants to occur. It is thought that wood smoke problems could be substantially improved by educating the public to burn only dry wood (Minister for Environment and Heritage, 2001), or by insisting that only advanced technology wood heaters be used (NRC, 1996). The Australian Home Heating Association is also a strong advocate of the proper use of wood heaters for efficient burning to minimise polluting emissions. It seems less likely that wood smoke pollution could cause significantly high levels of health problems in Adelaide or Melbourne where the proportional use of wood heaters is relatively low, and the topography and coastal influence associated with these cities permits significantly greater air movement. Nevertheless localised incidents of high air pollution are likely in more sheltered inland areas with the right combination of topography, climate, and high wood heater usage. There are already voluntary local programs in Canberra and other parts of regional NSW that are aimed at encouraging householders to limit their burning of firewood under certain climatic conditions that would otherwise be conducive to the build up of wood smoke pollution (EPA, 2002). Also, in recognition of air pollution problems in some parts of inland NSW and northern Tasmania, joint local and state government programs have been initiated to financially assist householders to replace old inefficient, polluting wood heaters (Environment Australia, 2001). Although these programs purport to encourage householders to shift to more efficient, advanced technology wood heaters that significantly reduce particulate emissions, differential levels of financial assistance is at this stage aimed strongly at encouraging householders to turn to gas or electricity. During the first year of the Woodheater Replacement Program in Launceston, only 2 householders applied for the $250 grant available to convert to a modern wood heater, whilst 148 applications were received for the larger $500 grant available to those converting to gas or electricity (AHHA, 2001). In addition, the standard of modern wood heater that must be met to meet the requirements of these heater replacement programs is much higher than the Australian Standard, and in fact rules out 80% of the complying wood heaters that are currently on the market. The AHHA is currently negotiating to correct these anomolies so that modern wood heaters are given greater prominance in these programs (Mogg, pers. comm.). In South Australia, clean air legislation currently being drafted will include measures to ensure that only wood heaters of the required Australian Standard are sold, and that they are properly installed and operated, however compliance is only being encouraged at present (Caire, pers. comm., 4/02) Marketability of Plantation grown Firewood Given the importance of developing firewood plantation resources to minimise environmental impacts and create sustainable sources of supply; the relative marketability of fast-grown, lower density plantation timber compared to the traditionally-used, slow-grown, dense native forest wood will be an important influence on the future viability of the firewood market. Developing a firewood plantation resource has the potential to provide many environmental and socio-economic benefits including: providing landowners with a secondary income source; providing benefits for agricultural productivity if sited in a manner that enhances shelter and shade for stock and crops; reducing pressures on the biodiversity of native vegetation communities by removing the need to harvest fallen and standing dead timber from these areas; providing a means of rehabilitating degraded lands by reducing the impacts of salinity and rising water tables; contributing to a reduction in greenhouse gas emissions by sequestering carbon, particularly in the roots of species suitable for management under a coppicing regime; 13
24 contributing to a reduction in greenhouse gas emissions by providing an alternative to the burning of fossil fuels; improving farm aesthetics and associated land values; boosting local economies by increasing the level of diversification of farming activities and associated support industries ie. nurseries, establishment and harvesting contractors, etc. Whether these benefits can be marketed successfully to overcome the perceived preference of firewood consumers for dense native timbers such as red gum, mallee, or box is currently untested. However informal surveys of hundreds of firewood consumers conducted in both western and north eastern Victoria revealed that up to 94% would be likely to purchase plantation-grown firewood due to its perceived environmental benefits (Hamilton, 2000). An additional survey of forty one Melbourne firewood consumers conducted in 2001, found that 85% were aware of the environmental benefits of burning plantation-grown firewood compared to wood from native forests or woodlands. If plantation-grown wood were available at the same or a higher price compared to native forest wood, 83% indicated that they would purchase it. The increased price that they would be willing to pay for its environmental advantages varied from 5-30%, with an average of 10% (Waring, 2001). In the north east Victoria survey, respondents were made aware of the expected lower firewood quality of fast-grown, low density plantation timber. It is not known whether this was the case with the other surveys. The density of 14 year old sugar gum was recently measured to be 0.79 tonnes/m 3 (Lang pers. comm., 3/02), which is significantly greater than radiata pine (0.51 t./m 3 ), and is better than some mature native timbers such as messmate, mountain ash and wattle ( t./m 3 ) (Sonogan, 1998). This indicates that the burning quality of this species at least, is still quite high even at such a young age. In addition, the density of young plantation blue gum has been found to be 0.68 tonnes/m 3, which is also comparable with many mature native timbers. In Victoria, one firewood merchant is already selling considerable quantities of mountain ash in Melbourne s eastern suburbs. This timber is collected as a by-product of sawlog harvesting operations in public forests, and is popular with consumers despite its low density and poor reputation as a firewood. The fact that a greater volume of wood is required to make up a tonne is seen by some consumers as a marketing advantage it appears as though they are getting more for their money (Hamilton, pers. comm., 3/02). In northern Tasmania, a timber cooperative is marketing its produce as Farm Wood to alert consumers to its perceived environmental benefits compared to timber from public native forests (Hamilton, 2002). A similar strategy could be employed to assist the market acceptability of plantation-grown firewood, and to overcome any negative perceptions about its quality. Overseas experience suggests Australian firewood consumers have been spoilt by a relative abundance of dense species with excellent burning qualities. In the western and northern areas of Canada, there is virtually no hardwood timber, so consumers make do with softwood. Apart from requiring greater volumes to produce the required level of heat, softwood is successfully used for domestic heating in some of the world s coldest climates (NRC, 1996). Based on this there seems to be no reason why consumers wouldn t use plantationgrown wood of lower quality, particularly if its environmental benefits can be highlighted, and if better quality wood (ie. red gum) becomes scarce and accordingly more highly priced Carbon Credits Carbon credits awarded for the sequestration of carbon in plantations have the potential to greatly improve the economic viability of growing some forest products. However, carbon trading is part of the Kyoto Protocol (1997) which can only come into force if it is ratified by the developed countries (including Australia and the USA) which have so far failed to recognise it. If the Kyoto Protocol was to be ratified, forests or plantations which have been planted on formerly cleared land after 1990 would be eligible for carbon credits. However in developed countries, trees planted now will have their carbon absorption counted only during the period from (Outlook, 2000). A decision is pending about the post 2012 period. (ANU Forestry, 2000). A grower would have to incur considerable costs in order to become eligible for carbon trading. These are associated with the requirement for independent measurement and verification of the amount of carbon present in the plantation, and its registration as a tradable commodity with an authorised market clearing house for sale and the exchange of monies. In addition, it is anticipated that a condition of carbon trading will be that plantations are insured against loss from fire, wind, snow or disease. These costs will generally be prohibitive for small independent growers, and it is expected that carbon trading will only work for small growers where they are able to form themselves into co-operatives. Another very important implication for plantations being grown on short rotations for firewood will be that any carbon credits gained for growing the plantation will be lost once the plantation is harvested at which time it will incur a carbon debit required to be paid by the owner. The quantity of the debit will be at least equal to the quantity of carbon credits sold. (ANU Forestry, 2000). Plantation species such as sugar gum, or blue gum which are able to be managed for firewood on a coppice regime will effectively store carbon in their root systems for long periods, and this may reduce the carbon debit compared to the carbon credits received. Whether or not this will be the case is yet to be determined. A number of recent studies have found that carbon credit trade is unlikely to be rewarding for small-scale growers due to the high cost of technical, financial, and institutional risks and uncertainties (ANU Forestry, 2000). Also, the potential returns from firewood plantations would not be greatly enhanced by the inclusion of carbon credits (see section 5.7.1). 14
25 3.1.5 Cost Comparison with Other Heating Options It is very difficult to compare the costs of different home heating options for every situation due to variability within: heater design and use efficiency within each option; house design and energy saving efficiency ie. presence of roof insulation, air tight windows and doors, etc. - largely a function of house age and building style; costs of fuel or energy required by various heating systems - largely a function of location; costs of appliance installation and set-up. Accordingly, any of the popular heating options can be cheapest depending on the situation in which it is used. Firewood has been traditionally favoured in country areas because it can be obtained relatively cheaply, whereas the cost or availability of connection to gas or electrical systems may have been prohibitive in many cases in the past. The Victorian Sustainable Energy Authority has attempted to compare set-up and running costs of various heating alternatives for Melbourne households (SEA, 2001). Assuming a 60 m 2 space to be heated, slow combustion wood heaters were shown to have competitive running costs compared to other options. The analysis assumed that the heater would burn 1.7 tonnes of firewood per annum at a cost of $175 per tonne. Set-up and running costs for various options are shown below. Table 3.1 Comparison of Heating Options (taken from SEA, 2001) Heating Option Minimum Set-Up Cost Running Costs ($ / pa.) Five Year Annual Operating Cost (inc. Set Up) Natural Gas Space Heater $ 600 $ $ pa. Electric Storage Fan Heater $ 400 $ $ pa. Reverse Cycle Air Conditioning $ 800 $ $ pa. Slow Combustion Wood Heater $ 800 $ 300 $ 460 pa. Electric Space Heater $ 200 $ $ pa. LPG Space Heater $ 600 $ $ pa. Over a 5 year period, the firewood option ranks fourth behind natural gas space heating, electric storage fan heating, and reverse cycle air conditioning in order from cheapest to most expensive. This assumes the costs of buying energy and firewood remain the same relative to each other during the 5 year period. It should be noted that the firewood price used in this study is similar to what is currently being paid in Adelaide, but is higher than the Melbourne price. Therefore, although the ranking determined above is applicable to Adelaide, in Melbourne firewood currently ranks third behind gas space heating and electric storage fans. In country areas, where firewood is generally cheaper, the firewood option is more competitive if it is assumed that other energy costs remain similar or are higher than city prices. Wherever firewood can be obtained for $90 per tonne or less, it is in fact the most cost-competitive heating option over a five year period. If the study is assumed to be a fair representation of actual running costs, than for most country and some city householders the use of firewood is currently their most cost-effective heating option. However, for householders in city or regional areas paying high retail prices for firewood, there are already probably two or three cheaper heating options. 3.2 FUTURE MARKET TRENDS It is difficult to predict trends that may occur in the firewood consumption market during the next years as they will in turn be based on factors that are also relatively unpredictable. These include: Firewood demand and price Conventional energy prices An examination of overseas trends can also provide an indicative guide to the future of firewood usage Firewood Demand and Prices 15
26 Dickson et al (2001) reported that residential energy comprises 13% of Australia s total final energy consumption. Currently firewood is the third largest source of household energy behind electricity and natural gas, and in 1990, solid fuel and wood heating appliances provided more than 20% of the nation s domestic heating energy (Environment Australia, 2001). However, Dickson et al (2001) forecast that demand for energy from electricity, gas, and solar power will grow at an average rate of 2.3% per annum during the 20 year period from 1998/99 to 2019/20, whilst both firewood and heating oil will lose market share. The growth in demand for firewood is expected to remain at less than 1% per annum during this period. From this it seems that provided firewood supplies can be maintained, there will continue to be a stable and slightly increasing growth in demand for it. The Australian Home Heating Association (AHHA) has concerns about the impact of bad and often ill-informed publicity about the use of firewood on future demand. The declining sales of wood heaters over the past few years is thought to be at least partially due to the impact of such publicity (AHHA, 2001) which is generally focussed on two fronts the effect on air quality, and the effect on biodiversity. This concern has manifested itself in the heater replacement programs currently underway in Tasmania and NSW, where householders are in effect being offered a financial incentive to convert to gas or electrical heating, despite the fact that the wood heating industry has spent vast sums in developing more efficient, low emission heaters to meet the tight Australian Standard (AHHA, 2001). This is different to heater replacement programs in USA and Canada that effectively aim to replace old wood heaters with efficient advanced models. The AHHA believes that one of the major determinants of the future of wood heating will be the extent to which government regulatory bodies consider and enforce industry standards and regulations (AHHA, 2001). The wood heater programs example cited above demonstrate that the nature of the standards set by government regulatory bodies will also be a determining factor in future firewood demand. Despite this concern, South Australian government bodies currently developing clean air and biodiversity protection legislation, have indicated that they are not seeking to unreasonably restrict the wood heating industry. Although encouragement for firewood plantation development is currently strong in western Victoria and southern NSW (around Deniliquin), firewood supplies for at least the next years will be reliant on reserves in traditional sources of supply. Therefore future firewood prices will largely depend on the rate of current firewood resource depletion and the ability to find alternative sources of supply during this period. With regard to Adelaide and Melbourne, there is no way of knowing the rate at which the current resource will decline as it is thought to be largely located on private land (Driscoll et al, 2000), although steadily rising prices in recent years tend to suggest that available supplies of red gum are already scarce. Future supplies to Adelaide in particular are reliant to a large extent on NSW land management policies that may ultimately restrict the ability to collect firewood in the areas from where most of its supply is thought to be derived. This is not necessarily an indication that overall firewood supplies are under threat as if other species are used, supply could be maintained, maybe even at lower prices. The ability to find alternative firewood supplies would appear to be lower in Adelaide than in Melbourne which is located close to extensive areas of state forest where other timber production operations are undertaken. However, there is a strong possibility that blue gum plantations in the state s south east could eventually supply significant quantities of firewood to Adelaide. At the current high retail price being paid for firewood in Adelaide, home heating with slow combustion wood heaters ranks behind three other options in terms of cost competitiveness. If firewood prices rise in accordance with progressive resource depletion, its costcompetitiveness could be expected to drop further behind these other options. However where landowners are able to collect their own firewood, or purchase it for less than $90 per tonne it is still the most costcompetitive heating option (see section 3.1.5). The majority of wood-using householders in regional South Australia, as well as a significant number in Adelaide are able to meet these requirements, and so firewood should remain as a very cost-competitive alternative as long as a stable supply can be maintained, and restrictions on its use do not become prohibitive Conventional Energy Prices Electricity and gas prices will depend on availability of supply, and environmental and political factors such as the requirement to reduce greenhouse gas emissions. In South Australia and Victoria, electricity is mostly generated using coal and gas resources, whilst renewables account for less than 1% of the total capacity. However the combustion of these fossil fuels produces greenhouses gases that are now thought to contribute to global warming. The Commonwealth s 2% Mandatory Renewable Energy Target (CMRE) derived from the Renewable Energy (Electricity) Act (2000) has encouraged state governments to consider how to move from conventional electricity and gas energy systems based on the use of finite fossil fuels, to systems based largely on renewable technologies. It is anticipated that there will be a long transition period as the economy phases in the use of renewable technologies, cleaner fossil fuel technologies, and energy efficiency measures. In the short term the main transition features are expected to be decreasing demand growth resulting from increased energy efficiency and higher uptake of embedded gas and renewable energy generation. Eventually price increases in fossil fuels and decreases in renewable energy technology costs are hoped to encourage more renewable generation (Energy SA, 2001). 16
27 However, ultimately the level of renewable and sustainable technologies employed during the transition period will be greatly affected by whether the Kyoto Protocol limiting the greenhouse gas emissions of developed countries, is ratified. Odlum and Wilson (2001) speculated that without ratification of the Kyoto Protocol, it is likely that energy usage over the next 20 years will follow a business-as-usual path, with only minor increases in the development of renewable technologies in accordance with government target requirements, community demand, and pilot projects. Under this scenario, electricity prices are likely to rise by between 1.4 and 3.3%, as a result of compliance to the CMRE target, but a major influence on electricity retail prices will be competition between distribution companies on which it is difficult to speculate. It is assumed that natural gas will become a more prominent energy option during the next 20 years as pressure from large consumers, including electricity generators, has caused the government to commit to a Victorian-South Australian gas pipeline project. Presumably, the greater availability of natural gas as a competitor will affect electricity pricing. If the Kyoto Protocol is ratified, it is expected that an increase in the cost of electricity will occur as a result of a carbon dioxide emission tax designed to encourage the development of renewable alternatives such as solar, wind, or biomass power generation. Large increases in the price of electricity from conventional coal-fired generation will occur, and a significant increase in demand for the use of natural gas which it is assumed will increase its price by approximately 15 % (Odlum and Wilson, 2001). As at December 2000 there were renewable energy proposals capable of supplying 13% of the State s forecast 2020 capacity requirements. The most likely biomass projects are a wood waste-fired plant in the lower South East, and increased biowaste utilisation in the industrialised region north of Adelaide. Projects using dispersed agricultural waste are at this stage seen to be prohibitive due to high transport costs, but this could change in the future (Odlum and Wilson, 2001). Presumably the same comments could be applied to an energy generation project relying on purpose-grown plantation fuel wood. The expected gradual or rapid increase in the price of conventional energy (depending on ratification of the Kyoto Protocol) will have an effect on the demand for firewood, but only if a reliable and sustainable supply can be maintained, and it can be collected and used with minimal environmental impact Overseas Experience Firewood was used for domestic heating in more than 90% of households in Canada and the USA prior to the twentieth century. However, by 1970, its use had fallen to very low levels (about 1% of households in the US). About this time, concerns about the future of fossil fuel supplies led to a resurgence of demand for firewood which has grown steadily since (EREN, 2001). In Canada, approximately 20% of households now use firewood as either a primary or secondary source of heating (NRC, 1996). Wood burning for domestic heating is regarded as being an integral part of the Canadian energy scene for the foreseeable future, provided advanced wood heating technology that minimises air pollution becomes the norm (NRC,1996). An important part of the confidence in the future of firewood in Canada is the abundance of fuel wood resources, and the view that firewood is a renewable resource that can be used to reduce environmental impacts compared to fossil fuels (NRC, 1996). This abundance of resource would appear to be a major difference between the Canadian and Australian wood heating scene. Future trends which are likely in Canada are the tightening of emission standards leading to the mandatory use of advanced wood heater technology; the increased use of pelletised biomass fuels for domestic burning as the need to dispose of wastes increases; and the rising cost of electricity that will continue to make firewood an attractive heating option (NRC, 1996). In the USA, the use of what is termed wood energy rose by about 5.5% during the period (EIA, 1999). However, whilst firewood remains a major source of energy for home heating, it is increasingly being viewed as an alternative power generation fuel using boiler technologies that are being developed and refined at the present time. This has seemingly underpinned a transition in its use away from burning in residential wood heaters (which dropped by approximately a third during the period), to its use as a source of industrial and commercial energy (EIA, 1999). During the 8 years from , the number of wood heaters sold in the USA increased by 11%, whilst the number of gas appliances increased by 600% indicating that gas has become a major player in the home heating market place in only a short time. In the shorter term, during 1999 and 2000 wood heater sales declined by 23%, whilst pellet burning heaters increased by 48% from a much lower base (HPBA, 2000). These burn pellets of sawdust waste with virtually no gas emissions and are very environmentally friendly. This apparent recent US. trend away from the use of firewood for domestic heating is due to a combination of the convenience of using gas, a lower level of new home starts, and the Y2K phenomena which artificially stimulated demand prior to (HPBA, 2000). No mention is made of environmental concern about wood smoke pollution or biodiversity conservation as factors in forcing consumers away from the use of firewood. There is also a move towards the use of fuelwood for biomass-fuelled electricity generation in Europe (Hamilton, 1999), particularly Sweden and Germany (Raison, 2002). 3.3 CONCLUSIONS 17
28 It would appear that the greatest influences on the firewood market over the next years will be the uncertainty of a continuing supply at reasonable prices, and the nature of government initiatives to regulate the collection and use of firewood in order to protect the environment. At the present time it is difficult to make reliable predictions about firewood supplies during the next years, but a CSIRO study to be completed in early 2003 should give a clearer picture of the sustainability of the resource which currently supplies much of the South Australian and Victorian firewood market. However it appears as though unless alternative species are used, and/or a plantation resource is developed, firewood supplies based primarily on red gum will decline to the much lower levels that can be sustained from sawlog residues from public forests. There is a danger that this will push up prices to levels that may force consumers to turn to other forms of heating. In South Australia, the ability to use other native forest species is limited compared to Victoria which has relatively large areas of public forests. The development of a plantation resource will be of greater importance, particularly for the large Adelaide market, in order to ensure that firewood remains as a viable domestic heating alternative. However, firewood plantations will take at least years to develop into significant sources of supply. If a sustainable source of supply can be developed, the use of firewood for heating or for electricity generation is an environmentallysuperior option to non-renewable energy sources such as conventional coal-fired electricity. The expected increases in the price of electricity and gas, particular if the Kyoto Protocol Is ratified, should encourage demand for firewood provided a readily available source of supply can be maintained. Environmental concerns surrounding the use of firewood are based largely on the impacts of its collection on biodiversity, and of its use on air quality. However, the fact that two wood heater replacement programs now operating in southern Australia have been structured to provide incentives for householders to turn to other forms of heating despite the ready availability of modern, low emission wood heaters; indicates that concern about the use of firewood is being driven more by the desire to protect biodiversity. The impact of firewood collection on biodiversity can be reduced by broadening firewood production to include waste from other timber production operations, and encouraging the establishment of plantations to shift production away from native forests and woodlands. Although government environmental agencies are intent on encouraging the development of a plantation firewood resource by imposing stricter rules on the collection of firewood on both public and private land, they must be mindful of the fact that plantation developments initiated now will take years to become significant sources of wood. Until that time the firewood market will have to be sustained largely from its traditional sources, and a balance must be struck between environmental protection and firewood production if there is to be a demand for plantation-grown firewood when it becomes available. The greater emphasis of biodiversity conservation associated with firewood collection in Australia compared to North America is probably related to lower availability of reliable supplies here compared to Canada and the USA, where the environmental concern is centred more on air quality issues. All Australian states have adopted standards that deal with the energy efficiency and installation of advanced technology wood heaters that operate with vastly reduced pollutant emissions. Legislative policy is currently being finalised in Victoria to ensure that these standards are met (EPA Victoria, 2002), but compliance is only being encouraged in South Australia at present. Clean air legislation currently being drafted in South Australia contains no provisions to ban or restrict the use of firewood (Caire, pers. comm). It is likely that air quality issues will be less important in Australian coastal locations such as Adelaide and Melbourne, compared to colder inland areas. It appears that in both North America and Europe the move towards cleaner green energy generation from biomass will increase demand for fuelwood in the future. In the USA, the increasing demand for wood energy for electricity generation is more than compensating for a reduction in demand for its use for domestic heating since the mid-1990 s. The development of a sustainable firewood plantation resource would seem to be worthwhile in anticipation of the transition to more environmentally-friendly, renewable energy sources being encouraged by government policies in Australia and throughout the world. 18
29 4. POTENTIAL FOR DEVELOPING A FIREWOOD PLANTATION RESOURCE IN THE MOUNT LOFTY RANGES REGION 4.1 REGIONAL LAND CAPABILITY FOR EUCALYPT PLANTATIONS Elevation and Climate Elevation and climate vary throughout the Mount Lofty Ranges, but considerable areas are well suited to eucalypt plantation development. Elevation ranges from close to sea level at Cape Jervis and along the coast of the Fleurieu Peninsula, to about 700 m. above sea level at Mount Lofty. Much of the area receives over 600 mm of rainfall per annum which is generally considered a minimum for most plantation species, although a small number of species such as Sugar Gum and Ironbark are capable of relatively good growth in areas receiving as little as mm. Some areas in the vicinity of Mount Lofty and Stirling, and areas of the southern peninsula near Cape Jervis receive upwards of 900 mm. /annum. Whilst a considerable area of the region receives between 700 and 900 mm. annually (Mt. Lofty Ranges FFG., 2000). Rainfall displays a marked winter bias in most areas. The area has a Mediterranean climate and experiences cool winters and warm to hot, and very dry summers. Mean minimum temperatures are C, and mean maximum temperatures are C. The region is noted for a very high bushfire risk during the summer and autumn fire danger period (Geddes Management, 1997). Frosts occur on days per year but are likely to be less severe on sloping ground. Local areas most likely to suffer from heavy frosts should be identified so that frost sensitive species are not planted there Topography Slopes vary from flat to very steep along the western escarpment, but the Ranges are mostly comprised of gentle to moderately undulating topography dominated by broad ridges of variable elevation orientated in a north-south direction. Suitability for plantation development needs to be assessed on a site by site basis, but in general south and east slopes will be more productive than exposed drier northern and western facing slopes (Geddes Management, 1997) Geology and Soil Types Soils in the region are highly variable depending on site, topography and elevation. Over 400 different landscape classes have been defined largely as a result of variable soil types (England, pers. comm., 2002). However, in general two main soil types were identified by Geddes Management (1997) : podsolised sands and grey, brown and yellow podsols and lateritic soils; and red brown terra rossa s Providing soils are at least two metres deep, are well drained and have sufficient water holding capacity, and are within an appropriate rainfall zone, they should be suitable for eucalypt plantation development. 4.2 AVAILABILITY OF LAND Area Potentially Available for Plantation Development Geddes Management (1997) estimated that an area of 270,000 ha in the greater than 600 mm./annum rainfall zone was suitable for timber production in the Mount Lofty Ranges. In addition it is assumed that at least a further 80,000 ha. contained within the mm. rainfall zone, has some potential for farm forestry. The area which could become available for timber plantations will depend on the financial benefits of growing trees, the value of alternative land uses, and the lifestyle considerations of the landowners. The affect of these factors on the likely landowner uptake of tree growing is discussed in more detail in section Plantation Area Required for a Sustainable Level of Firewood Production 19
30 The land area required to produce a sustainable level of firewood production will be dependent on the size of the markets targeted by growers, and the growth rates of plantations established to supply those markets. In reality plantations established across a region as large and diverse as the Mount Lofty Ranges will exhibit wide variations in growth rate, making it difficult to estimate the area required to supply a particular market. However, assuming average growth rates across the region, Table 4.1 provides an indication of the area of plantation required to meet the commercial markets examined in section 2. Table 4.1 Areas of plantation (hectares) required to provide sustainable levels of supply to various firewood markets COMMERCIAL FIREWOOD MARKETS Average plantation growth rate (m 3 /ha/annum) Location Mid-range Size (dry tonnes/annum) Adelaide SD. 77, Adelaide and Outer Adelaide SD 105, Adelaide + Regional SA 149, Adelaide, SA + Western Victoria 274, Adelaide, SA, Western Victoria and Melbourne 520, Notes: Calculations are based on 15 year plantation rotations. Conversion factors : 1 green m3 = 1.1 green tonnes, 1 green tonne = 0.75 dry tonnes of young plantation-grown timber. Outer Adelaide Statistical Division (SD) includes all of the Mount Lofty Ranges. Assuming the most likely scenario to be a plantation estate based on average growth rates of m 3 /ha/annum, it seems reasonable to assume that an area of about 10,000 hectares would be sufficient to sustainably supply the Adelaide and Outer Adelaide commercial firewood markets. An area of about 15,000 hectares would meet all of South Australia s requirements. 4.3 ABLILITY TO SUPPORT A SUSTAINABLE FIREWOOD PLANTATION RESOURCE The ability of the Mount Lofty Ranges region to support a sustainable firewood plantation resource will depend on the size of the markets that are to be supplied, as well as the willingness of landowners and investors to participate in the development of the resource. This in turn will rely on the financial attractiveness of firewood plantations, as well as lifestyle and community considerations Number of Participants Required For Various Levels of Supply If plantation-grown firewood is to largely replace supplies obtained from distant native forests and woodlands during the next years, the plantation resource would need to be developed during this period. A plantation estate of 10,000 ha comprised of small blocks averaging 10 ha. in size, would require 1,000 landowners to establish plantations during this period. If average plantation size increased to 30 ha., the number of participants would reduce to 333 (Table 4.2). Many more participants would be required if bigger markets were to be targeted. Table 4.2 Numbers of landowners needed to meet plantation area targets. Commercial Firewood Markets Area of Plantation Average size of plantations (ha) Estate (ha) Adelaide and Outer Adelaide 10, Adelaide and SA. 15, Adelaide, SA + Western Victoria 30, , Adelaide, SA, West Victoria, Melbourne 50, In order to establish a plantation resource during the next years, the annual planting program should at least equal the target area divided by the rotation length. For example, for a 10,000 hectare plantation estate to be managed on a 15 year rotation, at least 666 hectares would need to be established annually during the next 15 years. Higher annual planting rates would enable the target area to be met sooner. 20
31 The number of participants required to be recruited annually in order to establish a plantation resource during the next 15 years will vary in accordance with the proposed size of the estate, and the average size of plantation. Table 4.3 shows the variation in required annual participant recruitment based on different sized plantation estates and average plantation size. Table 4.3. Annual recruitment of landowners required to meet plantation area targets in next 15 years. Area of Average size of plantations (ha) Plantation (ha) , , , , , Community Attitudes and Landowner Demographics The difficulty of recruiting large numbers of landowners to participate in farm forestry has been highlighted on many occasions throughout southern Australia. The provision of the lucrative incentive being offered by MLRFFG should encourage strong interest, but will not necessarily guarantee that this can all be transformed into planted area. However, probably no previously proposed plantation development in Australia has specifically targeted landowners living in such close proximity to a major capital city. Past surveys of landowners in the Mount Lofty Ranges, and in Victoria s similar Port Phillip region (surrounding Melbourne) have identified a number of characteristics that may favour an increased level of participation compared with more traditional rural areas. Geddes (1997) reported the findings from two South Australian surveys conducted by the Department of Primary Industries (PISA) during late 1996 and early A similar survey has been conducted in Victoria and is reported in Kevin (2000), whilst Richards (1996) also has some interesting insights. Geddes (1997) hypothesised that landowners in the Mount Lofty Ranges with land suitable for farm forestry (ie excluding land already being used for high value agriculture such as horticulture or dairying), could be divided into four groups: 1. those who are already members of a Landcare Group, or have a high concern with the aesthetics of the farm and are less interested in economic production (this group is likely to include many hobby farmers ) - estimated to be 15% of the land base; 2. those broad acre farmers who are dynamic, willing to listen to new ideas, and wish to improve farm profitability - 10% of the land base; 3. those broad acre farmers who wish to improve farm profitability, but are more likely to follow the examples of others - 45% of the land base; 4. those broad acre farmers who are unwilling to change their farming practices - 30% of the land base. Richards (1996) study of 120 small property owners (average 20 ha.) in the Port Phillip region who relied on off-farm incomes can be assumed to be representative of a portion of the first group outlined by Geddes. The study confirmed that most had selected their property primarily on the basis of its proximity to their suburban workplaces, and its aesthetic values. The actual capability of the land to support agriculture was of little importance to these people. These small property owners were found to be a diverse group that exhibited a correspondingly great variation in their levels of awareness of land management issues. Generally they were found to have a more favourable and positive attitude to environmental conservation than landowners in other rural regions. They also exhibited a high level of interest in planting trees, which ranked second only to weed control as a type of land management work that they would like to undertake. Probably the most interesting finding from the PISA surveys was that only 20% of group 1 and 2 landowners were motivated to plant trees by the prospect of making a profit. This fits with the findings of Kevin (2000) who reported that out of a sample of 300 Victorian landowners, only 19% of those who had yet to plant trees said that they would require information about returns and long term market prospects before deciding whether to undertake significant tree planting on their property. Extrapolating from the Geddes hypothesis, it appears that approximately 25% of the land base (ie. 67,000 ha.) in the greater than >600 mm. rainfall zone is owned by landowners with a favourable attitude to tree planting, who generally place less importance on its economic 21
32 viability. Attitudes to tree planting in the rest of the land base are likely to be more traditional, with the majority of landowners needing to be convinced of its economic merit before deciding to participate. Although displaying a greater willingness to participate, plantation development amongst group 1 landowners is likely to be limited to mostly small to very small plantation sizes in keeping with their small average property size Local Government Planning Issues Geddes (1997) found that councils generally require a permit for change of land use from agricultural land to forestry, except in those areas close to existing plantations where forestry may already be a permitted land use. Presumably these permits will take account of common community concerns such as: Landscape protection; Road and bridge weight and usage restrictions; Potential impacts on neighbours. The establishment of small scattered plantations of native species as for firewood, is generally more likely to be supported by the community than large, industrial scale exotic tree (ie. radiata pine) plantations. 4.4 MARKET CONSIDERATIONS Of the firewood markets discussed in section 2, the potentially most attractive returns would result from supplying the Adelaide and Outer Adelaide markets. At an average plantation growth rate of 12 m 3 /ha./annum, an area of about 9,000 ha would be required to fully service these markets. The internal rate of return (IRR) for firewood production to supply these markets could be up to 10.7%, plus inflation, with better returns for any planting incentives provided by government or semi-government agencies. The lower price received for firewood, and the longer haulage distance to other markets in regional South Australia and Victoria make them unattractive to investment. For example, a wholesale price of $95 /dry t in Melbourne generates an IRR of zero when haulage costs reach $41 /t. This is equivalent to a haulage cost of $0.06 / t/km, which is about half the expected cost. Therefore, even if the cost of railway freight was half that of road haulage (ie. $0.05 per tonne / km), the IRR returned from supplying firewood to the Melbourne market, the IRR would only be 2.1%. Table 4.4. Potential markets for Mt Lofty firewood plantations. Adelaide Regional SA Melbourne Western Victoria Commercial market (dry t. / annum) 75-90, , , ,000 Plantation area required (ha.) 7,900 9,500 6,950 8,100 22,150 29,550 12,150 14,250 Wholesale price ($ / dry tonne) $ $ $85-95 $ Distance to market (km) Return to grower for base case with Sugar Gum* (IRR %) Return to grower for base case plus $400/ha credit % negative 10.2 % negative negative % negative 1.9 % negative negative 1.1 % Notes: Plantation area required is based on an average plantation growth rate of 12 m 3 /ha/yr (green), or 9.5 dry tonnes/ha./year The base case IRR has been calculated for sugar gum, assuming a growth rate of 10m 3 /ha./year, a rotation of 15 years, a wood density of 0.79 m 3 /tonne, no carbon or other credits, a cooperative management fee of $400 /ha. in year 0, $35 /ha. in years 1-14 and 16-29, and $300 /ha. in years 15 and 30. It takes no account of inflation or tax. 4.5 CONCLUSIONS 22
33 The Mount Lofty Ranges region has physical attributes suitable for the development of a plantation-based firewood industry. In addition there is a relatively large land base, of which up to a quarter is thought to be owned by non-traditional landowners with a more favourable attitude to tree planting and a greater financial ability to participate than is generally the case in other rural regions. In both logistical and economic terms, an initial realistic and achievable aim would be to target a plantation estate of about 10,000 hectares planted during the next 15 years, or sooner if possible. This would be equivalent to about 2.8% of the 350,000 hectares thought to have potential for commercial tree growing in the region, and should be enough to sustainably meet the commercial firewood requirements of Adelaide and Outer Adelaide where the state s strongest demand exists. If no large scale corporate investment can be attracted to the area, and assuming an average plantation size established by existing property owners of 10 hectares, such an estate would require the participation of 1000 landowners at an annual recruitment rate of 67 over the next 15 years. This will be a difficult goal, which would be significantly more attainable if a proportion of the area is able to be contained in larger plantations. Attempting to produce firewood for sale to other regional South Australian and Victorian markets would require significantly greater areas of plantation and unrealistically high levels of annual landowner participation. In addition there would be no guarantee of sale at commercially viable prices in view of the high cost of transport, and the fact that plantation development for firewood production is also being strongly encouraged in western Victoria. 23
34 5. FIREWOOD PLANTATION MANAGEMENT 5.1 SELECTION OF SUITABLE SPECIES Firewood Properties and Growth Rates The key factors to be considered when determining the suitability of species to be grown for firewood are: Growth rate - the ultimate measure of their ability to produce merchantable quantities of firewood from a range of sites in a reasonable timeframe. Calorific value - the amount of heat obtained per unit volume of wood. Other burning properties such as ease of ignition, presence of sparks, production of coals and ease of splitting. Where plantations are to be grown to produce a combination of firewood and sawlogs, sawing and drying ability, and other timber qualities must also be considered in species selection. A summary of firewood properties is provided in Table 5.1. Table 5.1 Properties of potential firewood species (DCNR 1994). Species Relative calorific value Density, air dry (kg/m 3 ) Splitting Ignition Sparks (spitting) Mallee roots Eucalyptus spp Belah, Buloke Casuarina spp Grey Box E. microcarpa Red Ironbark E. sideroxylon Age 8 831*** Yellow Box E. melliodora Sugar Gum E. cladocalyx Age ** Red Box E. polyanthemos Yellow Gum E. leucoxylon Long-leaved Box E. goniocalyx Blue Gum E. globulus Age *** River Red Gum E. camaldulensis Red Stringybark E. macrorhyncha Manna Gum E. viminalis Wattle Acacia spp Radiata Pine Pinus radiata Coaling 100 NA Difficult Poor Few Excellent NA Good Poor Few Excellent No Difficult Poor Few Excellent Yes Difficult Poor Few Excellent Yes Difficult Poor Few Excellent Yes Difficult Poor Few Excellent Yes Difficult Poor Few Excellent Yes Difficult Poor Few Excellent Yes Difficult Poor Few Good Yes Fair Fair Few Good Yes Difficult Poor Moderate Excellent Yes Coppice ability* Good Good Few Good Yes(?) Good Good Few Good Yes Excellent Excellent Few Fair No Fair Excellent Many Poor No 24
35 * Bird et al (1996) ** Hamilton (2002) *** Sonogan (2000) Interestingly mature blue gum and sugar gum both have a higher wood density and calorific value than river red gum. However, young (age 14 yr) plantation blue gum is only 75% as dense as mature red gum, while the wood of young sugar gum of the same age is 86% that of mature red gum. At the lowest end of the scale radiata pine has only 56% of the density of red gum. The most common firewood used in South Australia and Victoria is red gum (Driscoll et al, 2000a). Other durable species such as red box, yellow box and mallee roots are also preferred. Where these species are unavailable, easier to obtain local species such as messmate, manna gum, brown stringybark, and red ironbark are commonly used (Driscoll et al, 2000b). As red gum and box species are generally slow growing, they are unlikely to form the basis of a plantation firewood industry. Plantation species such as blue gum or sugar gum have the advantage of fast growth, but have lower burning qualities. Their acceptance amongst consumers will depend on marketing strategies that highlight the environmental advantages of shifting commercial firewood production away from native forests and woodlands where it is threatening conservation biodiversity (see section 3.1.3). One strategy to gain market acceptance for wood of lesser burning quality is to mix good and poor quality firewood within each load sold to consumers. Canberra s Woodstock Firewood mixes poorer quality coastal eucalypts with top quality box species, whilst Forge Firewood mixes radiata pine with red gum. Both mixes have been accepted by the market, with Woodstock Firewood s mix accounting for 35% of their sales (Australia and New Zealand Environment and Conservation Council, 2001). The Corangamite Farm Forestry Project has marketed sugar gum in Melbourne to the extent that demand is outstripping supply at similar prices to that paid for premium species such as yellow box and grey box (Hamilton 2002). However, this sugar gum is from mature trees being harvested from old windbreak plantings, and so has much better burning qualities than young plantation-grown wood. There is already evidence to show many consumers will have a preference for plantation grown firewood when it becomes available [Hamilton (2002), Waring (2000)]. This could be expected to increase as the community become more conscious of where their firewood comes from, but high levels of acceptance in the market may not be automatic (see 3.1.3). Thus, while the growth and firewood properties of the species cannot be ignored, it seems that there will be opportunities to market fast growing plantation species. The high growth rates of blue gum would enable it to be sold at a substantial discount compared to slower growing species or mature wood. Discounts of 25-30% would be realistic whilst still maintaining an acceptable rate of return to the grower. In lower rainfall areas less than 650 mm./annum where blue gum growth and survival is uncertain, sugar gum is likely to be the preferred plantation species as it is clearly superior in both growth and firewood properties to other species capable of survival under these conditions Species with Sawlog Production Capability Geddes Management (1997) listed blue gum, shining gum (E. nitens), spotted gum (Corymbia maculata), Sydney blue gum (E. saligna), and flooded gum (E. grandis) as having potential for plantation-grown sawlog production. Messmate (E. obliqua) was also listed, but older trial plantings in Tasmania indicate that it is unlikely to be capable of fast plantation growth (Naughton. pers. comm., 3/02) Also, the high rate of drought induced mortality amongst shining gum in north east Victorian trials, where rainfall is 1000 mm/yr, indicates that this species may not be suitable for the Mt Lofty Ranges. Therefore the plantation sawlog species suitable for the higher rainfall areas of the Ranges are likely to be limited to blue gum, spotted gum, Sydney blue gum and flooded gum. Of these, sawing and drying trials of plantation-grown Sydney blue gum, spotted gum and flooded gum have shown that they are capable of yielding good quality sawn timber. Blue gum from plantations has been shown to be of a lower quality when quartersawn, but has the advantage of being able to produce appearance grade timber when backsawn with high recovery (Hurley, 2001). 25
36 Rainfall distribution of selected sites. % of annual rainfall Benalla (NE Vic) Yallourn (S Vic) Albany (WA) Mount Barker (SA) 0.0 Jan Feb Mar Apr May Jun Jul Aug Sep Oct Nov Dec Month. Figure 5.1. Comparison of rainfall distribution between states. Site selection for very high water-using species such as blue gum will need to consider summer water availability (see Figure 5.1). Although the summer deficit in terms of percentage of total rainfall, is similar to Albany, WA where plantations grow well, the Mount Barker area recieves about 170 mm. less rainfall per annum. At the lower end of the blue gum rainfall range (ie mm./annum) the depth of usable soil required to drought-proof plantations of this species may be at least 3 to 4 metres. In low to moderate rainfall zones (ie. less than 650 mm.) sugar gum is likely to be the outstanding plantation species. The Central Victoria Farm Plantation s marketing study found that sugar gum was considered the new furniture timber with the most exciting potential (Lang, 2001). If growers pay contract rates to have their sawlogs harvested, sawn and dried, and sell the product as rough sawn kiln dried sugar gum, Lang estimates a return of about $390 /m 3. However, for growers to be able to do this in the Mt Lofty Ranges an investment of $ ,000 for drying kilns would be required (Geddes Management 2001). Sugar gum is therefore an excellent species for integrated plantation management for sawlogs and firewood as it grows well in climatic conditions where few other species excel, and it has excellent sawing and burning properties. It can be confidently planted in areas receiving up to 700 mm. rainfall per annum, but has largely been untried in higher rainfall areas. It is likely however that its growth rate would be significantly lower than blue gum if planted in areas of greater than 700 mm. rainfall. Its only significant weakness is a higher than normal sensitivity to frost, although this is not as pronounced as for some other species such as spotted gum. 5.2 SITE SELECTION AND ESTABLISHMENT The key factors in selecting a commercial eucalypt plantation site are: Slope: Slopes less than 15 o are preferred - management and harvesting costs increase significantly on steeper slopes. Access: Easy access is preferable for establishment, management and harvesting purposes. If bridges or extensive roading is required, investment costs increase significantly. Even the need to gravel a landing and several hundred metres of road can add $ /ha for roading. Soil depth: Plantation growth and the ability to survive drought improves with soil depth. Blue gum and other high rainfall species require soils at least 2 metres deep, whilst sugar gum requires at least 1.3 m. Within this depth there must be no water or root impeding layer. Soil texture: The most favoured soils are loams and light or medium clays. Sandy soils with good water holding capacity are suitable. Heavy clays should be avoided. Rainfall: Sugar gum will grow in rainfalls of mm/yr, whilst higher rainfall species generally need at least 700 mm/yr. Spotted gum requires at least 600 mm/yr. for good growth. Frosts: Spotted gum and sugar gum are sensitive to frosts and known very frosty areas should be avoided. Other species such as blue gum have frost sensitivity, but are less affected. 26
37 Water logging: Areas subject to extended water logging should be avoided. Mounding will help to overcome effects of short term surface water. Obstacles: Obstacles such as boulders and sheet rock make operations less efficient and reduce the effective planting area. Areas with fewer obstacles are preferred. The key steps in plantation establishment are: Removal of unwanted competing vegetation: This could include trees, shrubs, woody weeds or pasture. Methods of removal vary with the type of vegetation and could include grazing, slashing, herbicide application, or burning. Soil preparation: Eucalypt seedling growth usually responds to deep ripping and mounding. Ripping with a winged ripper to 650 mm is usually prescribed, but there is little scientific evidence to support ripping deeper than 40 cm. in most soil types. Mounding is usually completed in the same operation as ripping. Mounds should be about 1.4 m wide and 30 cm high. Rip lines are usually 3-4 m apart. The wider 4 m. spacing is slightly less costly and allows machine access between the rows. Pre plant weed control: At least four weeks prior to planting, herbicide should be applied to knock down any weed regrowth and provide a residual control over germinating weeds. The type of herbicide and application rates vary depending on the weed spectrum. Weed control may be limited to a m strip along the planting line, or it may consist of a broadacre coverage over the whole area. Planting of seedlings is usually completed during winter, but may be delayed until later if frost sensitive species are being planted. Seedling and planting quality should satisfy forestry standards. Stocking: Plantation stocking may vary depending on site quality, species and rotation length. Generally about 1000 trees/ha are planted, but this may be varied to achieve a targeted tree size. An average tree size of m 3 would suit firewood production. Diameters over 30 cm. may not suit mechanised cross cutting equipment. On lower quality sites stocking at 800 trees/ha would be more appropriate to ensure economically viable piece sizes can be grown in a reasonable time frame. Fertiliser: A starter fertiliser containing nitrogen and phosphorus is usually applied within four weeks of planting as a spot application near each seedling. Follow up weed control: If weeds regenerate during the spring after planting, additional weed control may be necessary. If site preparation and pre-plant weed control are thorough, follow up weed control should not be necessary until the following year. Second year weed control: Weed control in the second year of growth usually benefits tree growth. If the trees have already reached a height of two metres within a year of planting, the benefits of second year weed control may be marginal. Follow up fertiliser: Additional fertiliser should be applied on the basis of foliar analysis. Foliar analysis is the best way of determining which nutrients to apply and in what quantities. The correct procedure and timing of foliage collection must be followed. Replanting: If survival is poor after 10 months, replanting failed sections and gaps is recommended. The trigger point for replanting is usually an overall survival of less than 80%, or sections of more than 0.2 hectares with less than 50% stocking. Some growers may use a 70-75% stocking level standard. Browsing control: Seedlings need to be protected from browsing by hares, rabbits, white cockatoos and wallabies. Individual guarding of trees for large scale planting is expensive and not recommended. Other means of control will vary with the browsing agent but could involve shooting or poisoning if permitted. 5.3 MANAGEMENT OPTIONS There are two plantation management options capable of producing firewood: grow firewood only on a short year rotation. thin for firewood at about years (depending on growth rate) and leave a proportion of trees to grow on for a much longer period to produce sawlogs and firewood at final felling Firewood - only Option A firewood-only plantation is essentially grown on successive short rotations, being clear felled at the end of each, and then regenerated from managed coppice to produce a new crop. For this report a rotation of 15 years was assumed. At this age many plantations are at peak volume production, with trees of a size suitable for commercial handling, and merchantable per hectare volumes available. In addition wood in these plantations is denser than that available from younger plantations. Rotation length may be varied depending on growth rates, species, markets and grower needs. 27
38 Plantation management mainly involves maintaining adequate soil nutrition, and protection from fire, disease and insects. No thinning or pruning is required, although a limited form pruning at an early age to remove multiple leaders may assist with harvesting where tree processors are employed, but is not essential. After harvesting, coppice regrowth from the stumps becomes the basis of the next crop. Once established the coppice must be thinned to one or two shoots per stump, depending on the number of coppicing stumps. If coppice regrowth is not required, stumps would need to be poisoned at harvest to prevent it, and new seedlings could be replanted between the stumps along the original planting rows Firewood and Sawlog Option To produce sawlogs, the plantation could be thinned for firewood at age 15 years (or a few years earlier) leaving trees/ha with the space to grow on to the final harvest of sawlogs and firewood at age years. The number of trees retained for sawlogs and the length of the rotation would vary in accordance with the site quality and growth rates being achieved. Retaining a higher stocking of sawlog trees will reduce the production of firewood from the thinning. In the absence of any limiting site factors, the optimum number of retained sawlog trees would be dependant on the relative prices being achieved for firewood and sawlogs. This could vary between plantations depending on the distance from markets Trees to be retained for sawlog production should be identified at about age 3-4 years and pruned to about 6.5 metres in two or three stages from about age 3-6 years (later in slower growing plantations). Pruning increases sawlog quality by limiting the development of branch knots. 5.4 HARVESTING AND PROCESSING OPTIONS AND COSTS The systems employed for harvesting firewood will vary according to the scale of production. For the delivery of small loads of wood an operator may only require a chainsaw and trailer which may be adequate for the production of several hundred tonnes of firewood per year. At the other end of the scale where a large grower or cooperative is supplying a significant quantity of firewood to the Adelaide market, a production level of green tonnes per week may be required. Such an operation would require mechanical harvesters and forwarders capable of producing tonnes per day. The key steps in firewood harvesting are: Falling the tree. Removal of bark. Forwarding the wood to the plantation edge. Crosscutting into firewood billets, usually about 30 cm. Drying the wood. Delivery of the wood to a storage or sale area. The order of these steps may vary according to the harvesting system. There are no documented Australian studies of the production of plantation - grown firewood. Cost estimates must therefore be based on other plantation harvesting operations and anecdotal evidence. A summary of the costs associated with different scales of production is contained in Table 5.2 Table 5.2 Summary of production costs for varying scales of firewood production. Production Costs Scale of Firewood Production Large Medium Small Annual volume (m 3 green). 100,000 (79,000) 10,000 (7900) 1,000 (790) Daily production (m 3 green). 400 (316) 40 (32) 4 (3) Cost of harvest ($/ green tonne). $19 (26) $20 (28) Cost of crosscutting and splitting ($ /green tonne). $10 (13) $11 (14) $65-75 (82-95) Cost of delivery ($/dry tonne). $11 $14 $25 Total cost ($/dry tonne) $50 / dry tonne $56 / dry tonne $ / dry tonne 28
, and forwarding to the plantation")
39 Notes: Figures in brackets are based on dry tonnes, assuming a density of 0.79 tonnes/m 3 (ie. the density of 14 year old sugar gum) Large Scale Production Harvesting. The most appropriate method of large scale harvesting involves mechanised falling, debarking and delimbing, cutting to length at the stump (possibly tree length), and forwarding to the plantation edge. Lengths would then be either cut into firewood billets and dried on site, or transported to a central depot for processing. Large scale firewood harvesting would be similar to Blue Gum plantation harvesting for pulpwood. Machines have been designed to harvest, debark and bunch young eucalypt trees prior to forwarding. (National Forest and Timber, October 2001). Harvesting rates vary from green tonne per hour per machine, depending on tree sizes of 0.1 to 0.25 tonne each. Wood down to 50 mm. small end diameter can be processed. Harvesting costs for Timbercorp s blue gum plantation harvesting in Western Australia were estimated to be $17.70 per green tonne including on-siite chipping and loading into a truck-mounted container. This was based on a piece size of 0.2 tonne per tree, which could be achievable in a 15 year old firewood plantation by manipulating stocking rates. However, Western Australian plantation harvesting costs generally average about $19 per tonne for piece sizes of tonne (Wettenhall, pers. comm). This is lower than some Tasmanian operations where harvesting costs, not including chipping range from $17-22 per tonne. The lower costs apply to plantations on flat ground yielding 300 tonne per hectare, whilst higher costs are for moderate slopes yielding t/ha. (Naughton, pers. comm.) For large scale firewood production in the Mount Lofty Ranges, it is assumed that harvesting volumes are likely to be tonne per hectare where growth rates are m 3 /ha/yr on a 15 year rotation. Where topography is gentle to moderate, harvesting costs are expected to average $19 per tonne. If harvesting volumes are small (less than 1250 tonne) and relocating distances are up to 50 km., the cost could increase by $1.00 per tonne (McCormack et al, 2000). Figure 5.3 Harvesting machine capable of harvesting, debarking, and cutting to length. Photo: With permission from National Forests & Timber. Cross cutting, Splitting and Storage and Delivery A large proportion of firewood currently used is cut from mature trees with a large diameter (ie. more than 30 cm). Common ways of cross cutting into firewood billets include chainsaws, swing saws and saw benches with circular blades. For smaller diameter wood from firewood plantations (mainly less than 25 cm.), more efficient methods of cross cutting are required. Scandanavian firewood mills which can cross cut to selected lengths, split and pile up to five m 3 /hr are already available in Australia (Alarautalahti, pers. comm.). Depending on cutting capacity and additional equipment, these machines can be purchased for $10-16,000. They can run independently or from a power take off. A small tractor with HP is sufficient to power them, and tractors are also 29
40 needed to shift the machines. Although several machines are currently in use there are no detailed studies to describe their production capacity under Australian conditions with variations in billet length and wood diameter (Sonogan, pers. comm). Trials are currently being planned. The actual production rates currently being achieved in Australia are considerably less than the manufacturer s rating of 7-8 m 3 /hr for 33 cm billets of cm diameter (Alarautalahti, pers. comm.). Over a two week period one operator achieved 30 m 3 /day, or 4-5m 3 /hr of dry wood. The limiting factor is the speed with which logs can be fed through the machine and therefore production rates could increase significantly with consistently larger diameter wood. Assuming a production rate of five m 3 /hrcan be achieved, it is estimated that it would cost $50/hr to run a 45 HP tractor and firewood machine, with an operator. That equates to a cross cutting and splitting cost of $10 per m 3. Firewood could be stored at the point of production until dry and then transported to a wholesale fire wood yard, or it could be stored in a central depot. A large area will be needed for storage. The loose stack of firewood from a 20 hectare harvest yielding 240 tonnes/ha would be 6,000 m 3. Such a stack could be 10 metres wide, 4 metres high and 150 metres in length. A large storage depot containing 25,000 tonnes, would need to cover at least 0.7 hectare in area if the wood was stacked 5 metres high, or larger if the wood cannot be stacked that high. Delivery of firewood from a harvested plantation to a woodyard is estimated to be $11 / dry tonne based on a 50 km cartage distance. This cost includes $3.50 / dry tonne to load, and $0.15 /dry tonne / km. haulage. Budgeting on 750 tonnes per harvesting machine per week, and 50 weeks of operation per year, annual firewood production would be 37,500 tonnes. To produce the 100,000 tonnes of firewood required by the Adelaide market each year, three full time harvesting machines and three forwarders would need to be employed Medium Scale Production Harvesting Harvesting machines would not be used in a medium scale operation as their production rate requirements are too high. Trees would be directionally felled by a chainsaw operator to facilitate later extraction. Branches would be manually trimmed and the tree docked at the merchantable length. Assuming a cost of $30/hour for a faller equipped with a chainsaw and an average tree size of 0.18 tonne, costs will vary from $6-14 per tonne as time per tree increases. Sonogan (pers. comm.) estimates a time of 4.7 minutes per tree to fall, delimb, cut to length and rough stack. Thus a time of about 3.5 minutes to fall, delimb and cut to merchantable length (without stacking) at a cost of $10 per tonne seems a reasonable estimate. Without a mechanical system, bark removal could be a time consuming and costly exercise. One easy method would be to fall the trees several months in advance of cross cutting. As the wood and bark dry they separate without the need of mechanical assistance. This system has been employed successfully by firewood cutters in north eastern Victoria (Sonogan, pers. comm.). Attachments for farm tractors are available that can enable them to extract felled trees to the plantation edge for cross cutting. One example is the Hydraulic Forestry Tong produced by Fransgård. These grapple tongs, fitted to a 70 HP tractor, can enable it to efficiently skid trees from most plantations. Care would need to be taken during skidding to ensure that the wood was not soiled to the extent where cross cutting was slowed due to saw damage. Figure 5.4. Cost of manually falling, delimbing and docking 30
41 Falling, trimminig & docking costs Cost ($/tonne) Production rate (minutes/tree) Figure 5.5. Costs of skidding with farm machinery. Skidding costs. 7 6 Loads per hour Cost of skidding ($/tonne) Production rates for skidding tree lengths from firewood plantations are not available. However, assuming a hire rate of $55 /hr, including operator, and an average tree size of 0.18 tonne, and eight trees per load; the skidding cost varies from $6-19 per tonne as the number of loads per hour varies from 6 to 2. In easy terrain with short skidding distances (<200 metres) it was assumed 4 loads/hour were achievable at a cost of $10 /tonne. The total cost assumed for medium scale harvesting was $20 /tonne, which was only $1 higher than for large scale production. However a higher degree of uncertainty applies to this estimate. Cross cutting, Splitting and Delivery. Cross cutting would be most appropriately carried out by the firewood mills described for high scale production. Costs of production are likely to be marginally higher as wood may not be presented as well as that produced by a mechanical harvesting system. There may be more bark and uncut limbs. A cost for cross cutting and splitting of $11 per m 3 was assumed. Delivery costs are likely to higher than for large scale production as the degree of mechanisation is likely to be lower. An additional $3 per dry tonne was assumed, making the delivery cost $14 / dry tonne. 31

42 Figure 5.6 Fransgard Hydraulic Forestry Tong Small scale production Small scale production would involve firewood being produced at the stump and loaded directly into a trailer or truck. Cross cutting would carried out with a chainsaw. In a harvesting trial at Dookie College in central Victoria, one man using a chainsaw and a front end loader produced 300 mm. firewood blocks, loaded onto a truck for $26.54 /green tonne (Sonogan, pers. comm.). Using a green to dry wood conversion factor of 0.79, this equates to a harvesting cost $34 per dry tonne. Trees used in this trial averaged over 30 cm. in diameter. If smaller diameters of cm. (as from a plantation) were prevalent, the cost of production would increase substantially. Labour and chainsaw use was costed at only $20/hr for this trial on the basis of a tendered quotation, but the operator felt that future similar work should be worth $30/hr. Currently, a Geelong firewood contractor advertises a rate of $45 /m 3 to produce heaped firewood from standing mature trees (over 30 years). This equates to harvesting cost of $57 /dry tonne. For younger and smaller plantation trees the cost is likely to be significantly higher. On this basis, a production cost of $65-$75 /dry tonne is assumed for small scale harvesting. The removal of bark will be a key consideration for a small scale operator. As for the medium scale operation it would be best to fall trees several months prior to cross cutting so that bark separated form the wood as the trees dry on the ground. A small scale producer is more likely to home deliver rather than sell to a wholesaler. Handling costs would be high due to manual loading and small delivery volumes, and a delivery cost of $25/ dry tonne is assumed. 5.5 COSTS Establishment Costs of establishment will vary with topography, size of plantations established, roading requirements, browsing and weed control requirements, and availability of and competition between contractors. Indicative costs are illustrated in Table 5.3. Table 5.2. Indicative costs for plantation establishment. Operation Indicative cost ($/hectare) Ripping/mounding 180 Weed control 140 Browsing control 30 Planting stock 240 Planting 140 Fertiliser 85 32
43 Fertiliser application 60 Sub Total $875 Roading 100 Cooperative fee 400 Total $ Management Management costs will depend on how the plantation business is structured and whether sawlogs are being grown with firewood. Early age fertiliser may be necessary to correct nutrient deficiencies. Pruning would only be required where sawlogs are being grown. Roading costs would vary between properties. The cooperative fee is based on a self-funded organisation undertaking a large planting program of about 1000 hectares per year. Individual growers choosing not to join the cooperative would have to organise their own marketing, technical advice, harvesting and other services that could be provided to them by the cooperative. Insurance has not been included in the costing but some growers may opt to insure. Further detail about firewood cooperatives is contained within section 5.8. Table 5.3. Indicative costs for plantation management over two 15 year rotations. Year Activity Indicative Cost ($/hectare) 1-14 Cooperative fee 35 2 Early age fertiliser Pruning Roading Cooperative fee Coppice Management Cooperative fee Roading Cooperative Fee Coppice Management 400 Notes: Insurance not included - low risk as fire unlikely to kill trees. Fire protection - assumed livestock will keep fuel loads down once trees are established. Land rates and charges - not included. Forestry advice - available from growers co-operative. Initial establishment and harvesting costs are not included as plantation management costs. 5.6 RETURNS Returns to firewood growers will vary with the species grown, growth rates, wholesale and/or retail prices, distance to market, any credits or incentives received for tree growing, the method of sale, and the costs incurred in harvesting and production. Section 4.4 showed that potential returns are very low for regional South Australia, western Victoria and Melbourne where wholesale prices are relatively low whilst transport costs are high. However there appears to be potentially good returns for firewood grown for the Adelaide and local Outer Adelaide markets where wholesale prices are relatively high and transport distances are low Wholesale and Retail Prices The wholesale price what a grower could be paid by selling firewood to a retailer (ie. wood yard) rather than directly to a consumer. The retail price is the price paid by consumers. In the Adelaide and Outer Adelaide markets, the retail price is thought to be about $20-50 per tonne more than the wholesale price that the growers/suppliers are paid. This margin covers the retailer s requirement to store the firewood in a wood yard, and the effort entailed in selling and delivering it to the consumer. Small growers or suppliers may be able to sell their product direct to consumers, thereby avoiding the lower wholesale price that they would get by supplying a wood yard. Whereas, for larger growers or suppliers without the time or desire to sell to large numbers of small consumers, it may be more convenient to sell to only one entity ie. a wood yard, for the wholesale price. The wholesale price may vary for different species of firewood, but it should always be sufficient to cover all the costs of establishment, growing, harvesting and processing, and transport. Due to the higher costs of transport, the wholesale price is generally significantly higher for wood sold in city woodyards, compared with rural areas. The wholesale price of wood in the Adelaide and Outer Adelaide markets is estimated to be $ per dry tonne, whilst in regional South Australia it is thought to vary widely in accordance with the local availablity of suitable species from $ per dry tonne. 33
44 5.6.2 Methods of Sale Firewood can be sold by two key methods: On the stump The plantation owner negotiates a sale price for the standing trees and has no involvement with the harvesting, drying or sale to retailers. This method is appropriate for growers who are too busy to organise harvesting and marketing, or for those who do not feel capable of undertaking the task. The financial success of this method depends heavily on the price able to be negotiated by the owner. To achieve an IRR of 10.7% (the base case for selling dried wood within a cooperative in Adelaide) the sale price would need to be $58 per green m 3, or $73 /dry tonne. Such prices are most unlikely to be achieved. For an independent grower operating without cooperative overheads the required price drops to $43 /green m 3 ($39 /dry tonne). If an independent grower also received an incentive of $300 /ha at establishment the price required to achieve an IRR of 10.7% would further reduce to $23 /green m 3 or $29 /dry tonne. This may be achievable in the long term, but is well above the $6-15/ green m 3 currently being paid to landowners in Victoria (Hamilton 2002). Cut, dried and delivered to a woodyard. Under this method, trees are harvested, cut to length and dried before being sold to a woodyard or retailed by the grower. Depending on the scale of operation, this may be undertaken by contractors or by the plantation owner (see 5.4, Harvesting and Processing Options). This method adds value to the standing trees and so is more profitable for the plantation owner. By engaging contractors to complete the harvesting and transport the owner can achieve the equivalent of $65 /green m 3 on the stump, or $83 /dry tonne. 5.7 BASE CASE ECONOMIC PERFORMANCE OF FIREWOOD MANAGEMENT OPTIONS The base case economic performance of growing firewood under various management options relies on the following assumptions: Growth rates - 10 m 3 /ha./annum (sugar gum); 20 m 3 /ha./annum (blue gum) No incentives or credits No consideration of taxation implications, or inflation. Cooperative Fees included Establishment costs of $875 per hectare Wood density of plantation sugar gum 0.79 kg./m 3 ; blue gum 0.68 kg./m Sugar Gum Firewood Plantation - grown sugar gum firewood has the potential to produce an internal rate of return (IRR) of up to 10.7% within a cooperative grower arrangement to supply the Adelaide and Outer Adelaide markets (see Table 4.4). However, the IRR could be significantly higher for an independent grower operating without cooperative fees, or achieving higher rates, or with the benefits of other credits or incentives paid for tree growing. However independent growers may have to pay additional costs for marketing, harvesting and technical advice that would negate the effect of not having to pay cooperative fees. Internal rate of return is sensitive to key input variables such as plantation growth rates, price and incentives are important variables in determining IRR, but carbon credits do not have a significant impact (Figure 5.7). Figure 5.7 Sensitivity of IRR to growth rate, carbon credits, firewood price and other credits. Growth rate vs IRR for Sugar Gum plantations. Effect of Carbon Credits on IRR IRR (%) Growth rate (green m3/ha/yr) IRR (%) Carbon Credit Value ($/tonne carbon) 34
45 Growth rate is a key input. As it increases from 8 to 16 m3/ha/yr the IRR increases from 9.2 to 14% Carbon credits are not a major input. As credits increase from 0 to 10 $/tonne, IRR increases from 10.7 to 11.2%. Effect of other credits on IRR Effect of Wholesale price on IRR IRR (%) Value of other credits ($/hectare) IRR (%) Wholesale Price ($/dry tonne) The value of a $500/ha incentive or credit Wholesale price is a key input. As paid at establishment increases IRR from price increases from$90 to 130 per 10.7 to 13.0%. dry tonne, IRR increases from 6.7 to 11.7% Sugar Gum for Firewood and Sawlogs The financial returns from a combined firewood and sawlog regime are less than those of firewood - only regimes. This assumes that sawlogs will be harvested, sawn and dried under contract with an equivalent return of $300/m 3 for a pruned log, and $150/m 3 for an unpruned log. With such high sawlog returns the IRR may have been expected to be at least equal to or higher than a firewood - only regime. However, factors which reduce the IRR under the combined firewood / sawlog regime are the: relatively high price of firewood returned to the grower. lower volume of firewood from thinningat age 15 years (120m 3 /ha compared to 150m 3 /ha). consequently lower $/ha return at age 15 years. relatively low volume of sugar gum sawlog grown on low productivity sites over 30 years (about 98m 3 or 3.3 m 3 /ha/yr). If sawlog returns were $90/m 3 for a pruned log, and $45/m 3 for an unpruned log, the IRR would reduce to 7.1%. Table 5.4 Comparison between firewood only and combined firewood/sawlog regimes for Sugar Gum. Firewood + sawlog Firewood only Sawlogs sold in round. Sawlogs sawn, dried + sold as boards. IRR (%) 10.7 % 7.1 % 9.7 % Due to the lower overall return from sawlogs and the longer period before the major return it is unlikely that growers would opt for the sawlog and firewood regime over the firewood-only regime Blue Gum Firewood Blue gum has a faster growth rate than sugar gum, but its basic density is lower and it is not expected to achieve as high a price as firewood. However, even allowing for a 20% discount compared to sugar gum, the financial returns for blue gum firewood are attractive with potential IRR s in the mid-teens (Table 5.6). Table 5.5 Potential returns (IRR %) for Blue Gum firewood plantations. 35
46 Factor Adelaide and Outer Regional SA Adelaide Distance to market (km) Wholesale price* ($ / dry tonne) $ $ Return to grower (IRR %) % negative % Return to grower for base case, but no % negative 16.8 % cooperative (IRR %) Return to grower for base case plus $400/ha credit % negative % Note: A discount of up to 20% compared with sugar gum prices was assumed Blue Gum for Firewood and Sawlog Firewood - only regimes are more attractive than combined firewood and sawlog regimes (Table 5.6). The sawlog prices used in the analyses were $40-120/m 3 which are much higher than currently achievable. Prices of $40/tonne ($36.4/m 3 ) are not achievable at present (Geddes Management, 1997). Due to the lower overall return from sawlogs, the uncertainty of achieving the high price for sawlogs and the longer period before the major return it is unlikely that growers would opt for the sawlog and firewood regime over the firewood only regime. Table 5.6. Comparison between firewood only and combined firewood/sawlog regimes for Blue Gum. Firewood only Sawlogs sold in round. High royalty. Firewood + sawlog Sawlogs sold in round. Very high royalty. IRR (%) 10.5 % 9.1 % 9.9 % Notes: A discount of up to 20% from sugar gum firewood prices was assumed. High royalty: Pruned logs $80/m 3 ; unpruned logs $40/m 3.Very high royalty: Pruned logs $120/m 3 ; unpruned logs $60/m FIREWOOD GROWERS CO-OPERATIVE High prices for wood products are usually achieved by being able to meet demand with a consistent supply of quality product. Selling on the basis of an intermittent supply exposes growers to spot market prices which are usually lower than a longer term contract price. Although, in times of very high demand the spot price may exceed the longer term contract price. A plantation development designed to supply a large quantity firewood is likely to involve many landowners (see Table 4.1). The marketing of the wood would be a major component of such a project. A growers cooperative would enable marketing to be undertaken in an efficient and more rewarding manner. Cooperatives already dominate the dairy, rice, fishing, grain, wool, cotton and sugar industries, with many having grown into multi-million dollar businesses exporting a diverse range of products (Gill 1997). A firewood cooperative could set quality standards for harvesting and production, and assist individual growers throughout the establishment and growing phases. Gill (1997) describes a cooperative as an incorporated enterprise that is owned and controlled by its members. Membership is voluntary and can include individuals and/or corporate bodies. In forming a cooperative, members agree to make use of its services and contribute capital to fund the enterprise, usually by purchasing shares. Funds are contributed not for capital gain but for service or trading benefits. Dividends may be paid but they are secondary to trading benefits derived. Members exercise their control of the cooperative by electing a board of directors charged with its management, through approval of the rules by which a cooperative operates, and by the passing of resolutions at general meetings. Every member has one vote, irrespective of the capital contributed or the volume of business transacted. Hughes (1997) outlined the following functions that a tree growers cooperative could manage: Marketing: The primary function of a treegrowers cooperative is securing sales and negotiating contracts. Market development: The cooperative can explore alternative markets and various techniques of marketing. Forest Management Plans: Market development will be integrated with the preparation of forest management plans which cover all aspects of growing. An inventory of members resources may also be maintained. Arrangements with contractors: The cooperative may enter legal arrangements with contractors and hired labour, assuming responsibility for legal, insurance, workers compensation and related matters on behalf of its members. Harvesting and transport: Harvesting and transport may be coordinated and supervised by the cooperative. 36
47 Financial transactions: Financial transactions may be centralised. Equipment purchases: The cooperative may purchase forestry equipment, technology and office requirements on behalf its members. Bulk purchases may attract discounts. Advice and information: In the early stages of development of the private forest industry, government agencies have undertaken to provide extensive management advice and marketing information. As the industry develops this provision is likely to be withdrawn, leaving the industry to function in a more self reliant manner. The advisory and information providing role of treegrowers cooperatives will acquire greater significance as this process of government withdrawal occurs. A voice for its members in control of their business: Members of a treegrowers cooperative exercise control over the policy of their enterprise, and possess a voice in its operation. Treegrowers who deal independently with major companies or government agencies are not so enfranchised. Gill lists the essential requirements for a successful treegrowers cooperative as, inter alia: A committed group of enthusiastic treegrowers. A well researched and constructed business plan. An inventory of members forest resources to enable planning and to develop an understanding of potential marketing opportunities. Adequate communication to growers, processors and contractors of the cooperatives policies and procedures. Having administrative procedures that ensure both timber and cash are properly accounted for. Having an informed and dedicated board of directors. Having sufficient funds and working capital to finance the cooperative. Having suitably qualified staff, including industrial forest, marketing and administrative skills. Having skilled and motivated contract harvesters. To ensure a firewood cooperative is well financed and serviced with appropriate management, forestry, marketing and administrative skills; members would pay on a per hectare basis at establishment, a continuing lower fee during plantation growth, and a small proportion of sales. For this project, based on establishing about 1000 hectares per year, the cooperative fee at establishment was assumed to be $400/ha, with an annual fee of $35/ha/year while the plantation grew, and $300/ha for harvesting and marketing. These fees are based on employing a project manager, office manager, two foresters, legal and accounting fees, office accommodation and services, vehicles, equipment and contingencies to a total of $400,000 per annum. During the growing phase an additional forester and office staff would be required to service the expading plantation area and grower base at a cost of around $10,000 per annum. The harvesting phase would see the need for a marketing manager, field supervisor, additional accounting and other services, as well as an extensive wood storage and drying yard at a cost of around $300,000 per annum. If a smaller annual planting program was undertaken the resources required to manage the project would be lower, but it is doubtful if the per hectare cooperative fee would be significantly different as the benefits from economy of scale would be reduced. Initially it could be expected that the government, through the Mt. Lofty Ranges Farm Forestry Group would supply some of the skills and therefore effectively provide a subsidy for the cooperative members whilst they became established. 37


48 Figure 5.8: Sugar Gum plantation at the You Yangs, in western Victoria ( mm. rainfall). Age: 33 years. Average height: 19 metres, Basal Area: 26 m 2 /ha/annum Standing volume : ~ 150 m 3 /ha. Mean Annual Increment: 4.5 m 3 /ha./annum Figure 5.9: Sugar Gum coppice after firewood harvesting at the You Yangs, in western Victoria ( mm. rainfall). Age: ~15 years. Average height: 11 metres, Basal Area: 11 m 2 /ha/annum Standing volume : ~ 35 m 3 /ha. Increment: 2.3 m 3 /ha./annum Mean Annual 38


49 Figure 5.10: Brown Mallett (E.astringens) plantation at the You Yangs, in western Victoria ( mm. rainfall). Age: 42 years. Average height: 18 metres, Basal Area: 24 m 2 /ha/annum Standing volume : ~ 130 m 3 /ha. Mean Annual Increment: 3.1 m 3 /ha./annum Figure 5.11: Swamp Yate (E.occidentalis) plantation at the You Yangs, in western Victoria ( mm. rainfall). Age: 41 years. Average height: 17 metres, Basal Area: 22 m 2 /ha/annum Standing volume : ~ 120 m 3 /ha. Increment: 2.9 m 3 /ha./annum Mean Annual 39
50 6. COMMERCIAL VIABILITY OF PRODUCING PLANTATION-GROWN EUCALYPT FIREWOOD IN THE MOUNT LOFTY RANGES Three factors should be considered when assessing the commercial viability of establishing a plantation firewood resource in the Mount Lofty Ranges. These are as follows: the value of growing firewood as a replacement land use suitable for outside investment on a moderate to large scale; the value of growing firewood as a replacement land use suitable for direct investment by existing landowners; and the economic, environmental, and social value of growing firewood as an integrated land use which complements existing agricultural activities. 6.1 AS A REPLACEMENT LAND USE SUITABLE FOR OUTSIDE INVESTMENT This refers to the suitability of the Mount Lofty Ranges for large scale investment by companies or individuals seeking to purchase or lease land to develop a firewood plantation resource, thereby replacing the current land use. The likelihood of this occurring will be based solely on a comparison of the economic value of growing firewood and the value of land under current land-uses. Land suitability analysis is a method of showing variations to the commercial viability of plantations across a broad geographic region. It assumes recent past land sale prices are indicative of the current value of land for particular uses, and compares these to the Net Present Value of growing firewood on land of similar quality. It therefore integrates land capability with plantation costs and returns in order to measure economic suitability (Baker et al, 1999). Land suitability analysis has been used in a number of other areas such as Victoria s north eastern and Port Phillip regions, and the Eden region of southern NSW. Most recently it was used to determine the regional potential for plantations and farm forestry in all Australian regions thought to have potential for large scale forestry development. This included a consideration of the Mount Lofty Ranges region under radiata pine (ABARE, 1999). Three of the five Municipal Districts that comprise the Mount Lofty Ranges were chosen for close examination as they represent one area of very high to moderate land values close to Adelaide, as well as areas of low to moderate land value more distant from Adelaide (see Figure 6.1). Land values were determined by examining past property sales data from 2001 obtained from the Land Services Group of the Department of Administrative and Information Services. In order to concentrate on land that may have potential for at least moderate scale plantation development, only properties of more than 15 hectares were considered. To remove the influence of housing and other improvements on land value, only vacant land was considered. This is mostly used for cattle or sheep grazing, and is suitable for immediate plantation development if it were to be made available. Land being used for high value uses such as horticulture was not considered Land Values - Mount Barker District The Mount Barker District is comprised of about 60,000 hectares of land. It has a population of about 23,000 people (as at June 2000), the majority of whom live in what is classified as an urban situation in townships including Mount Barker/ Littlehampton (approx. pop. - 9,000), Hahndorf (approx. 1700), and Nairne (approx. 3,000). About 7,000 people live in rural situations on properties of various sizes. (Mount Barker DCM, 2002). Land in the Mount Barker District falls within two major landscape character units Central Ranges, and Western Ranges. The Western Ranges unit is characterised by high rainfall, and many ridges and valleys with high relief. It possesses significant areas of vegetation reserved for conservation and water catchment, and areas of high value agriculture such as dairying and horticulture. The township of Hahndorf is located within this unit (Mount Barker DCM, 2002). The Central Ranges unit is characterised by moderate rainfall, rolling uplands and open valleys. Its major land uses are agriculture (grazing, cropping, and dairying), and areas of urban development including the townships of Mount Barker, Littlehampton, and Nairne (Mount Barker DCM, 2002). Although a variety of land uses are employed in the region, the two most dominant uses up to 1993 were grazing (approx. 69% of land) and dairy (approx. 11%) (Mount Barker DCM, 2002). A total of 560 ha. of vacant land spread across 18 properties was sold in the Mount Barker district during Property sizes varied from 13 to 96 ha., with an average of 31 hectares. Sale prices varied from about $15,000 per hectare at Echunga and Kuitpo, to about $2,000 per hectare at Kanmantoo. High prices in the western part of the district reflect the area s proximity to Adelaide and its outer suburbs. Note that the locations of some properties could not be verified so they were excluded from Table 6.1. Figure 6.1 Mount Lofty Ranges Local Government Districts (taken from Mount Lofty Catchment Program web-site) 40
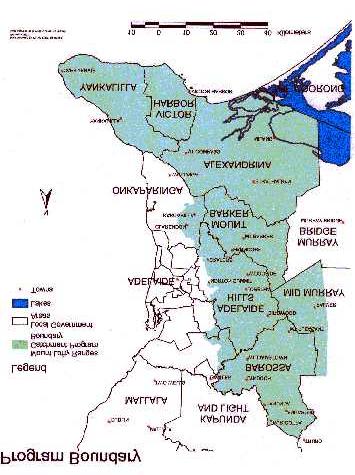
51 41
52 Table 6.1 Current Land Values in the Mount Barker District District Zone Rainfall Zone (mm./ annum) Location Area Sold in 2001 Average Land Value ($ / ha.) Range of Land Values ($ / ha.) Central Nairne/Dawesley 81 ha. $ 7,620 $ 6,050-10, Echunga 27 ha. $ 14,800 - East 550 Kanmantoo / Callington 344 ha. $ 2,570 $ 1,550 6,270 South West Kangarilla / Kuitpo 59 ha. $ 9,620 $ 7,700 14,800 In the Kanmantoo / Callington area, 344 ha. on eight properties was sold at an average price of $2,570 /ha. Prices on these properties varied from $3,200 6,300 /ha. for beef cattle country, down to $1,550 2,100 for sheep grazing country. This represents the cheapest land available in the Mount Barker District Land Values - Alexandrina District The Alexandrina District is comprised of 167,000 hectares of land with a population of about 17,500 people (as at June 2001). Major towns in the district are Strathalbayne, Goolwa, and Port Elliot (Annual Report, 2000/01). Land in the Alexandrina District varies from areas of moderate rainfall with rolling uplands and open valleys in the northern and north western parts; to flat or gently undulating plains with low rainfall (ie mm./annum) in the central, eastern and south eastern parts of the district. Approximately two thirds of the district receives less than 600 mm. of rainfall per annum. Major land uses are grazing, dairying, fruit growing, and viticulture (Annual Report, 2000/01). A total of 4,550 ha. of vacant land spread across 55 properties was sold in the Alexandrina district during However, not all property sales data could be used as in some cases listed prices applied to more than one property, and locations were not always stated. Nevertheless, Table 6.2 shows average land values where they were able to be determined. Table 6.2 Current Land Values in the Alexandrina District District Zone Rainfall Zone (mm./ annum) Location Area Sold in 2001 Average Land Value ($ / ha.) Range of Land Values ($ / ha.) North East Woodchester / Callington 63 ha. $ 3,800 $ 2,900 5,480 East Langhorne Creek 84 ha. $ 5,765 $ 5,025 6,425 Bletchley (east of) 914 ha. $ 615 $ 475 2,180 South Milang / Sandergrove / Finnis 563 ha. $ 1,895 $ 1,035 4,055 Currency Creek 65 ha. $ 4,885 $ 4,700 5,500 Hindmarsh Island 65 ha. $ 2,755 $ 2,695 2,770 Central Strathalbayne 292 ha. $ 2,300 $ 1,410 3,140 South West Mount Observation 27 ha. $ 3,625-42
53 West Mount Compass / Kuitpo / Willunga Hill 90 ha. $ 8,130 $ 6,710 10,000 As expected the most expensive land is in the higher rainfall areas in the western part of the district closest to Adelaide, declining eastwards to land values as low as $500 per hectare on the plains east of the Bremer River Land Values - Yankalilla District The Yankaklilla District is comprised of most of the Fleurieu Peninsula, extending from almost the edge of the southern-most outlying Adelaide suburbs to Cape Jervis. It is almost entirely comprised of rural lands with few towns, of which Yankalilla, Cape Jervis and Myponga are the only ones of any significance. Almost all land in the Yankalilla District recieves at least 600 mm. rainfall, and there is a steep rainfall gradient from the coastal fringes to the higher rainfall areas (> 900 mm./annum) along the central range of the Peninsula. Major land uses are sheep and cattle grazing, dairying, and viticulture. A total of 1,885 ha. of vacant land spread across 27 properties was sold in the Yankalilla district during Only unimproved vacant land of more than 15 hectares was considered in order to remove the influence of housing and other improvements on land value. This is mostly used for cattle or sheep grazing, and is suitable for immediate plantation development if it were to be made available. Land being used for high value uses such as dairying was not considered. Table 6.3 Current Land Values in the Yankalilla District District Zone Rainfall Zone (mm./ annum) Location Area Sold in 2001 (ha.) Average Land Value ($ / ha.) Range of Land Values ($ / ha.) South West Cape Jervis / Rapid Bay 659 ha. $ 1,415 $ 850 4,815 West Yankalilla / Carrickalinga / Wattle Flat 547 ha. $ 2,980 $ 1,730 4,635 North West Myponga Mt.Compass 458 ha. $ 2, 085 $ 1,705 6,945 Central InmanValley/ Torrens Vale / Back Valley/ Hay Flat 114 ha. $ 3,745 $ 3,345 4,100 South West 800 Delamere 28 ha. $ 5,124 - South Central 900 Parawa / Deep Creek 79 ha. $ 3, 085 $ 2,425 3, Land Suitability Analysis In analysing the suitability of land for industrial scale firewood plantation development in the Mount Barker, Yankalilla and Alexandrina districts, the Net Present Value (NPV) of firewood plantations in various rainfall zones was compared with that land s market value as determined from recent rural property sales data. The determination of an NPV for large scale firewood plantation development in a range of rainfall zones was based on the following assumptions: that a company invests in growing, harvesting, and retailing firewood to consumers from their own woodyards; the use of sugar gum (Eucalyptus cladocalyx), based on the belief that this species is best suited to survival and fast growth in the less than 650 mm./annum rainfall zone; the use of either sugar gum or blue gum (Eucalyptus globulus) in the mm. zone; and the use of blue gum in the higher rainfall zone greater than 700 mm.; expected sugar gum growth rates over a 15 year rotation in various rainfall zones are as follows: m 3 /ha/annum in the mm. annual rainfall zone; 10 m 3 /ha/annum in the mm. zone; 43
54 8 m 3 /ha/annum in the mm. zone; 6 m 3 /ha/annum in the mm. zone. expected blue gum growth rates over a 15 year rotation in various rainfall zones are as follows: 15 m 3 /ha/annum in the mm. annual rainfall zone; 20 m 3 /ha/annum in the mm. zone; 25 m 3 /ha/annum in the 850+ mm. zone. the plantation is established on flat or gently undulating ground that minimises the costs of plantation establishment and harvesting; that plantation establishment in year 0 costs $1275 per hectare, including $400 planning and supervision cost; and $150 in year 1 including a $75 planning and supervision cost. no roading is required in the less than 600 mm. rainfall zone due to the topography and on the basis that all harvesting and cartage of product from the site will be undertaken during the drier months of the year; however some assumed roading costs are included for plantations growing in higher rainfall zones; that the company leases land from farmers at the rates of 5% of the land s value per annum (as per Bulman 2002D); that industrial scale developments will involve fully mechanised harvesting systems ie. the use of feller/bunchers and forwarders, to harvest trees and deliver them to processing points for mechanised cross-cutting and splitting; that the following costs will apply for plantations that yield at least 150 m 3 /ha. (ie. growth rate of at least 10 m 3 /ha/annum): harvesting and delivery to processing point: $19 per green tonne processing (cut into blocks): $10 per green m 3 In less productive plantations, these costs will rise due to smaller average piece sizes and the need to use alternative nonmechanical harvesting and delivery methods. that the following conversion factor applies: 0.79 dry tonnes = 1.0 green m 3 for young sugar gum; 0.68 dry tonnes = 1.0 green m 3 for young blue gum. after harvesting and processing, the firewood is left to dry for a year on site before being loaded and transported to the company s wood yard; that cut firewood is transported 50 km. to a storage and sale depot at a cost of $0.12 per dry tonne per km., and that this plus the cost of loading and unloading amounts to $11 per dry tonne; that sugar gum firewood is sold to consumers for a retail price of $140 per dry tonne based on the high price of red $180 per dry tonne, discounted by the difference in density between red gum and young sugar gum, and further discounted in order to attract consumers away from the traditionally preferred red gum or mallee; that blue gum firewood is sold to consumers for a retail price of $125 per dry tonne based on the high price of red $180 per dry tonne, discounted by the difference in density between red gum and young blue gum, and further discounted in order to attract consumers away from the traditionally preferred red gum or mallee; that the company is able to get government salinity and biodiversity credits totalling $200 for each hectare established; that the company is able to get an incentive of $500 per hectare for planting in the mm. rainfall zone, and $375 per hectare for planting in the greater than 600 mm./annum zone as per the MLRFFG 2002 Farm Forestry Incentive Scheme; a minimum plantation size of 20 hectares was assumed; that plantations are not insured against damage by natural agencies such as fire; that no carbon credits apply; that the NPV analysis does not consider the tax implications that apply to either or both costs and returns; the discount rates used were 5, 8 and 10%; and the plantation regenerates after harvesting by coppicing, with a cost of $400 per hectare to thin the coppice after one year. The analysis was conducted over two rotations (30 years) to ensure that the full value of land for firewood plantations was captured. Under the very favourable conditions of establishment incentives and credits, and high product price assumed above, the Net Present Value of firewood under a range of discount rates and growth rates is outlined in Table
55 Table 6.4 Net Present Values of Sugar Gum firewood plantations in the Alexandrina, Yankalilla, and Mount Barker Districts. Rainfall Zone (mm.) District Average Land Value Average Land Rental Average Plantation Growth Rate Alexandrina $ 1,655 / ha. $ 85 / ha./ year 6 m 3 /ha./year Mount Barker $ 2,570 / ha. $ 130 / ha./ yr 9 m 3 /ha./year Alexandrina $ 3,800 / ha. $ 190 / ha./ yr 9 m 3 /ha./year Mount Barker $ 7,620 / ha. $ 380 / ha./ yr 14 m 3 /ha./year Alexandrina $ 3,625 / ha. $ 180 / ha./ yr 14 m 3 /ha./year Yankalilla $ 2,124 / ha. $ 105 / ha./ yr 14 m 3 /ha./year Discount Rate Net Present Value 5% $ 775 / ha. 8% -$ % -$ 500 5% $ 1865 / ha. 8% $ % -$ 260 5% $ 918 / ha. 8% -$ % -$ 833 5% $ 1885 / ha. 8% $ % -$ % $ 5045 / ha. 8% $ % $ 690 5% $ 6230 / ha. 8% $ % $1405 Notes: Annual Land rental is assumed to be 5% of the value of the land The costs of harvesting and processing a low productivity 15 year old plantation are assumed to be higher than in plantations growing at growth rates of at least 10 m 3 /ha./annum. Average costs of harvesting and processing in the mm. rainfall zone are assumed to be 25% higher than those outlined in the assumptions on the previous page. Table 6.5 Net Present Values of Blue Gum firewood plantations in the Alexandrina and Mount Barker Districts. Rainfall Zone (mm.) District Average Land Value Average Land Rental Average Plantation Growth Rate Mount Barker $ 7,620 / ha. $ 380 / ha./ yr 15 m 3 /ha./year Alexandrina $ 3,625 / ha. $ 180 / ha./ yr 15 m 3 /ha./year Yankalilla $ 2,124 / ha. $ 105 / ha./ yr 15 m 3 /ha./year ~ 800 Yankalilla $ 2,260 / ha. $ 115 / ha./ yr 20 m 3 /ha./year Mount Barker $ 8,100 / ha. $ 405 / ha./ yr 25 m 3 /ha./year Alexandrina $ 8,130 / ha. $ 405 / ha./ yr 25 m 3 /ha./year Yankalilla $ 3,085 / ha. $ 155 / ha./ yr 25 m 3 /ha./year Discount Rate Net Present Value 5% -$ 985 / ha. 8% -$ % -$ % $ 2175 / ha. 8% $ % -$ 400 5% $ 3360 / ha. 8% $ % $ 310 5% $ 5270 / ha. 8% $ % $ 976 5% $ 2895 / ha. 8% -$ 10 10% -$ 970 5% $ 2895 / ha. 8% -$ 10 10% -$ 970 5% $ 6850 / ha. 8% $ % $ 1415 Notes: The same assumptions used for Table 6.4 for sugar gum also apply to this table, except for differences in wood density which affects plantation yield and retail price. These are detailed in the assumptions outlined above. 45
56 Comparing the Net Present Value of a land use, such as firewood plantations, in various rainfall zones with the current value of land within those zones, is an accepted means of assessing the land s suitability for that use. Calculating NPV under a range of discount rates provides an indication of the sensitivity of the economic performance of growing firewood under a variety of market conditions. The results from Tables 6.4 and 6.5 can be compared with land values to give an indication of the land suitablity within the Alexandrina, Yankalilla and Mount Barker districts for industrial scale investment of firewood plantations. The results of this comparison are contained within Table 6.6. Table 6.6 Land suitability for firewood plantations in the Alexandrina, Yankalilla and Mount Barker Districts. Rainfall Zone (mm./ year) Species District Discount Rate Suitability Rating 450 mm. Sugar Gum Alexandrina mm. Sugar Gum mm. Sugar Gum mm. Blue Gum Alexandrina Mount Barker Alexandrina Mount Barker Yankalilla Alexandrina Mount Barker Yankalilla ~ 800 mm. Blue Gum Yankalilla mm. Blue Gum Alexandrina Mount Barker Yankalilla 5 % Unsuitable 8 % Unsuitable 10 % Unsuitable 5 % Unsuitable 8 % Unsuitable 10 % Unsuitable 5 % Unsuitable 8 % Unsuitable 10 % Unsuitable 5 % Suitable 8 % Unsuitable 10 % Unsuitable 5 % Unsuitable 8 % Unsuitable 10 % Unsuitable 5 % Suitable 8 % Suitable 10 % Unsuitable 5 % Unsuitable 8 % Unsuitable 10 % Unsuitable 5 % Unsuitable 8 % Unsuitable 10 % Unsuitable 5 % Suitable 8 % Unsuitable 10 % Unsuitable 5 % Strongly Suitable 8 % Break - Even 10 % Unsuitable 5 % Unsuitable 8 % Unsuitable 10 % Unsuitable 5 % Unsuitable 8 % Unsuitable 10 % Unsuitable 5 % Strongly Suitable 8 % Break - Even 10 % Unsuitable Based on average land values derived from 2001 property sales data, the land suitability analysis shows that the Yankalilla District has the greatest potential for large scale firewood plantation development financed by outside investors. The relatively high land values in the Mount Barker District make it unsuitable under all scenarios, whilst the Alexandrina district is only suitable at low discount rates in the mm. rainfall zone. The relatively low land values that are still found in the Yankalilla District make it strongly suitable for large scale blue gum firewood plantation development at optimistic low discount rates in the above 800 mm./annum rainfall zone. In addition, firewood is a break-even land use at moderate discount rates within this rainfall zone. At lower rainfalls, plantations of either sugar gum or blue gum firewood are suitable down to 650 mm./annum. 46
57 In the mm. rainfall zone sugar gum plantations would be recommended as they are a suitable land use at both low and moderate discount rates. The difference in performance between this species and blue gum in this zone is attributed to the greater density of young sugar gum timber, and its correspondingly higher retail price, despite the liklihood that it would grow slower. It is important to note, that firewood plantations would be an unsuitable investment in all parts of these districts if high discounts rates prevail. Further sensitivity analysis could be undertaken by altering variables such as product price, growth rate, or land rental costs, but has not been attempted here. Instead, the Net Present Value results show above in Tables 6.4 and 6.5, are based on what are thought to be average or baseline scenarios of growth and land rental within each rainfall zone, as well as baseline product values derived by comparing the different the density of young plantation-grown wood against that of red gum with its known current consumer price. It is also important to emphasise the considerable subsidies inherent to the establishment of the proposed plantations, including grower incentives of up to $500 per hectare, and anticipated government credits of $200 per hectare associated with the amelioration of potential salinity problems, or the enhancement of regional biodiversity. These subsidies have provided a significant boost to the NPV of firewood growing in the above analysis. It is assumed that the land suitability results obtained for the Mount Barker Districts will be indicative of the situation to be found in the Adelaide Hills District where high land values prevail, whilst the inland parts of the Victor Harbour District will probably have similar suitablity to the Yankalilla district in corresponding rainfall zones. The general unsuitability of most parts of the Mount Lofty Ranges for outside investment in firewood plantations has been enhanced in recent years by strong agricultural commodity prices which have boosted property values by an average of 15% since late 2000 in many parts of South Australia. The market has been driven by demand for cropping, vineyard, dairying, and grazing country, whilst demand for hobby farms has also been strong (The Advertiser, 2001). These results are also similar to the findings of ABARE (1999) who with respect to a proposed expansion of radiata pine in the Mount Lofty Ranges, found that the value of the land for other competing uses made it difficult for plantations to compete as a viable land-use. 6.2 AS A REPLACEMENT LAND USE SUITABLE FOR DIRECT LANDOWNER INVESTMENT This refers to the suitability of growing firewood as an alternative land use which existing landowners in the Mount Lofty Ranges may look to as a replacement for at least part of their current agricultural activity. It assumes that this decision is based on an economic comparison at a property level of the projected returns from growing firewood with the returns being obtained from competing agricultural land uses Comparison with Other Land Uses From the limited surveying reported in section 4.3.2, it seems that only about 20% of existing landowners consider the economics of growing and producing wood when making decisions about whether to plant trees in rural regions located close to major cities such as the Mount Lofty Ranges. However as these surveys were based largely on landowners who have already demonstrated a strong interest in tree growing, they are likely to have underestimated the requirement for economic data amongst the broader landowning community, and particularly amongst those landowners who are particularly interested in larger scale replacement plantings as compared to smaller integrated and complementary plantings (see section 6.3). The economic consideration by existing landowners of establishing moderate large scale firewood plantations will involve a comparison of its performance compared to other potential or current agricultural uses. However as this will not need to include the cost of purchasing or leasing land, it is likely to give a different result to that gained from comparing land values at a regional level ie. land suitability analysis (section 6.1). The concept of Gross Margin (GM) is often used as a measure of the current value of agricultural land uses. Gross Margin is defined as the difference between the annual gross income for that enterprise and the direct variable costs. Fixed or overhead costs are ignored, since it is assumed they will be incurred regardless of the type of activity carried out. Landowner labour costs are also not included, but external contractors, such as shearers, or weed control contractors are included. The economic performance of forestry ventures is usually assessed in terms of Net Present Value (NPV) or Internal Rate of Return (IRR). In order to compare forestry with agricultural land uses, Net Present Value is preferable as, like Gross Margins, it gives a $ per hectare figure to which landowners can more readily relate. However comparing Net Present Value with Gross Margin is biased by their different methods of determination. Whereas Gross Margin is based on the difference between returns and some costs over a single year, Net Present Value is based on a consideration of all costs and returns over a pre-determined rotation length. 47
58 Recognising these difficulties, Geddes Management (1997A) in conjunction with Primary Industries SA staff, devised a method for converting agricultural Gross Margin to a Net Present Value that could then be used as the basis for a valid comparison. This involved the inclusion of the infrastructure depreciation and other costs usually ignored when calculating Gross Margins, in order to produce an annual enterprise profit figure suitable for inclusion in an NPV calculation over the same length of time as that of the relevant forestry venture (ie. its rotation length). It is difficult to obtain indicative Gross Margins for the Mount Lofty Ranges. They will vary across the region in accordance with land productivity, and between properties depending on the quality of land management being employed. In addition, they vary seasonally with climatic conditions and commodity prices, which are currently high. However, Primary Industries and Resources, SA produce an annual Farm Gross Margin Guide for the state, from which it is possible to extrapolate indicative Gross Margins for a range of agricultural land uses in broad rainfall zones (PIRSA Rural Solutions, 2002). Table 6.7 Indicative Gross Margins for the Mount Lofty Ranges (April, 2002) Rainfall Zone (mm./year) Average Stocking Rate (dry Current Average Agricultural Gross Margins ($ / ha.) sheep equivalent per hectare) Prime Lambs Merino Ewes Beef Cattle dse./ha. $275 $245 $ dse./ha. $345 $305 $300 > dse./ha. $415 $365 $350 Notes: Extrapolations from Farm Gross Margins Guide 2002 (PIRSA Rural Solutions) With advice from Tim Prance, Pastures and Grazing Management Consultant, PIRSA Rural Solutions (4/02). The Geddes method of comparing agricultural Gross Margin with forestry Net Present Value is based on the following relationship: Agricultural Enterprise Profit per Year ($/ha.) = Gross Margin ($/ha.) - Additional Costs ($/ha.) The Agricultural Enterprise Profit is effectively the annual cash flow amount that can then be discounted over the relevant time period (ie. same as that used for forestry venture) to calculate an NPV that can be compared with the results of a similar calculation for firewood plantations. Geddes delineated the following additional costs required to produce an annual enterprise profit that can be used in calculating NPV: Stockyards worth $5000 depreciate at a rate of $250 per year; Fencing depreciated at a rate of $5 7 per hectare per year (depending on the area enclosed); Pasture renovation is required once every 20 years at a cost of $50 per hectare; Cost of chemicals required for annual pasture maintenance is $5 per hectare; Fertiliser spreading is required every 10 years at a cost of $25 per hectare; Annual cost of landowner labour for sheep ventures is $3125 (ie. 12.5% of time at $25,000 per year); and for beef cattle is $6250 (ie. 25% of time at $25,000 per year); For sheep, shearing shed worth $25,000 depreciate at a rate of $625 per year. Note: As the use of such low landowner labour costs has been contentious, a higher cost of $150 per ha./annum was used for all ventures in this analysis. To assist landowners to compare the relative economic performance of their current agricultural ventures against that of a firewood plantation, the following steps were used to calculate the Gross Margins that would be required to match the economic performance of firewood plantations of different rates of growth in a range of rainfall zones: Calculate the Net Present Value of firewood plantation at a particular discount rate (ie. 5, 8, or 10%), and growth rate, over two rotations (ie. 30 years). Determine the annual enterprise profit required from an agricultural venture in order to match the firewood Net Present Value. This is done by trialling a range of positive annual cash flow figures discounted over a 30 year period until the one that gives the required NPV is found. Add the additional costs calculated as per the Geddes method (above) to the annual enterprise profit to give the Gross Margin that the agricultural venture would require to at least match the economic performance of the firewood plantation. Note that 10% was added to these additional costs to account for inflation since the model was developed in For the purpose of comparison, the calculation of Net Present Value of firewood plantations, was based on two rotations over a 30 year period, with the following assumptions: 48
59 the use of sugar gum (Eucalyptus cladocalyx) in the less than 700 mm./annum rainfall zone; expected blue gum growth rates over a 15 year rotation in the more than 700 mm./annum rainfall zone are as follows: 6-10 m 3 /ha/annum in the mm. annual rainfall zone (Sugar Gum); m 3 /ha/annum in the mm. zone (Sugar Gum and Blue Gum); m 3 /ha/annum in the mm. zone (Blue Gum). the plantation is established on flat or gently undulating ground that minimises the costs of plantation establishment and harvesting; that plantation establishment in year 0 costs $1275 per hectare, including $400 planning and supervision cost; and $150 in year 1 including a $35 planning and supervision cost; that planning and supervision are conducted by a forester employed by a firewood cooperative which has the following annual fees: $400 /ha. in year 0; $35 /ha. in years 1 14, and 16 29; and $300 /ha. in years 15 and 30. no roading is required in the less than 600 mm. rainfall zone due to the topography and on the basis that all harvesting and cartage of product from the site will be undertaken during the drier months of the year; however some assumed roading costs are included for plantations growing in higher rainfall zones; that plantations are small (generally 5-15 hectares); harvesting will be by a motor -manual system more appropriate to the lower production capability of small farm plantations ie. manual falling and the use of modified farm machinery to deliver trees to processing points for mechanised cross-cutting and splitting; that the following costs will apply for plantations that yield at least 120 m 3 /ha. (ie. growth rate of at least 8 m 3 /ha/annum): harvesting and delivery to processing point: $20.00 per green tonne processing (cut into blocks): $11 per green tonne In less productive plantations, these costs will rise due to smaller average piece sizes and the need to use alternative nonmechanical harvesting and delivery methods. A 25% increase in costs has been used in determining costs in plantations growing at less than 8 m 3 /ha./annum. that the following conversion factor applies: 0.79 dry tonnes = 1.0 green m 3 for young sugar gum (see 3.1.3); 0.68 dry tonnes = 1.0 green m 3 for young blue gum. after harvesting and processing, the firewood is left to dry for a year on site before being loaded and transported to the company s wood yard; that cut firewood is delivered (including the cost of loading and unloading) to a woodyard at a cost of $14 per dry tonne; that the cooperative is able to sell sugar gum firewood to a woodyard for a wholesale price of $125 per dry tonne; that the cooperative is able to sell blue gum firewood to a woodyard for a wholesale price of $110 per dry tonne; that the cooperative is able to get an incentive of $500 per hectare for planting in the mm. rainfall zone, and $375 per hectare for planting in the greater than 600 mm./annum zone as per the MLRFFG 2002 Farm Forestry Incentive Scheme; that the cooperative is able to get government salinity and biodiversity credits totalling $200 for each hectare established; that no carbon credits apply; that tax implications that apply to either or both costs and returns are not considered in the analysis; the discount rates used were 5, 8,and 10%; and the plantation regenerates after harvesting by coppicing, with a cost of $400 per hectare to thin the coppice after one year. The results contained in Table 6.8 show that the economic performance of firewood plantations is superior to agricultural ventures when calculated at optimistic low discount rates (ie. 5%). At the more likely moderate discount rate (ie. 8%), the economic performance of firewood plantations generally matches or just exceeds the agricultural ventures used for this analysis. At the high discount rate of 10%, agricultural land uses are superior to firewood under all situations. It must be remembered that this analysis can only ever be indicative as it is based on large numbers of assumptions about productivity, cost and returns that are incorporated into calculations of Net Present Value and additional costs used to determine agricultural Gross 49
60 Margins. For example, the landowner labour cost of $150 /ha./annum amounts to $15,000 per year for a 100 ha. property. If a higher cost was used for landowner labour, the long term value of firewood plantations would match or exceed agriculture under almost all situations. Also, it must be acknowledged that Gross Margins are currently high as a result of good commodity prices, and a similar comparison done three years previously would have shown firewood plantations in a better light. Essentially the relationship between the economic performances of these differing land uses is a dynamic one which changes frequently with variations in commodity prices and economic conditions. The analysis should therefore be considered to be only a snapshot of their indicative relative performance at the present time. Table 6.8 Indicative Comparison of Firewood and Agricultural Land Uses Rainfall Zone (mm/yr) Range of Firewood Growth Rates (m 3 /ha/ann) Dcount Rate Range of Firewood Net Present Values ($/ha.) Range of Gross Margins required to match Firewood NPV s ($/ha.) Current Average Agricultural Gross Margins ($/ha.) Prime Lambs Merino Ewes Beef Cattle (Sugar Gum) 5% $ $ % $ $ $ 275 $ 245 $ % $ negative $ (Sugar Gum Blue Gum) 5% $ $ % $ $ $ 345 $ 305 $ % $ $ (Blue Gum) 5% $ $ % $ $ % $ $ $ 415 $ 365 $ 350 Notes: The range of Net Present Values and Gross Margins shown above correspond to the upper and lower limits of the range of firewood growth rates expected in each rainfall zone. Using the Geddes model described on p. 47, the average additional costs used to calculate Gross Margins from Annual Enterprise Profits was $120 / ha. regardless of type of venture and productivity zone. This is because an average landowner labour cost of $150/ha. was used for all ventures, and its influence far outweighs minor differences caused by variations between the other costs under different productivity zones, or between ventures. The very small range of firewood performance in the mm. rainfall zone is due to the differences in wood density and product price between Sugar Gum which is recommended for growth in the lower half of the zone, and Blue Gum which is more appropriately used in the upper half of the zone. Whilst the above analysis provides a useful comparison of economic performance between firewood and agriculture over a long period into the future, it does not consider the loss of annual income that would result from putting land under trees. For a landowner struggling to make a property commercially viable, this is likely to be the greatest disincentive to planting trees on a moderate to large scale, regardless of how they perform economically in the long term. 6.3 AS AN INTEGRATED AND COMPLEMENTARY LAND USE There is now a large body of research information espousing the value of even small areas of strategically located tree plantations as an integrated, complementary land use that can significantly enhance the productivity of an existing agricultural primary land use. The accepted general rule is that establishing trees on only 10% of a property s area in windbreaks and shelterbelts can increase agricultural productivity from the property as a whole by 10%. Consequently, landowners considering the merits of establishing firewood plantations in this manner do not necessarily have to consider them in terms of a direct replacement of their existing landuse, in the way that a plantation investment company does. The commercial viability of plantations established as an integrated and complementary land use can only be assessed in conjunction with the agricultural land use on a whole-of-property basis. However, the reality is that establishing windbreaks and shelterbelts on a substantial area of a property will usually reduce its overall commercial productivity for many years before benefits become apparent. This is because tree planting will tie up land that previously produced an annual income, it requires a significant initial expenditure, and it takes many years for trees to reach a size sufficient to provide the sheltering benefits that can increase crop or pasture production in their lee. The provision of the substantial incentive being offered by the MLRFFG should substantially soften the initial economic impact of establishing windbreaks, and it is apparent that landowners able to withstand the initial loss of returns, will ultimately reap impressive benefits in terms of better overall productivity particularly if the wood can be sold on the Adelaide firewood market. 50
61 In order to use firewood plantations as an integrated and complementary land use, moderately large properties are required (ie. at least ha.). Establishing trees on 10% of such properties would give plantation areas of 5 10 ha. which are probably the minimum areas required for economic firewood harvesting. Geddes Management (1997) found that there are 890 grazing properties averaging 125 ha. in size in the 600+ mm. rainfall zone of the Mount Lofty Ranges. If 10% of these landowners decided to put 10% of their land under trees in shelterbelts and windbreaks this would translate to about 1125 ha. of plantation. Clearly a greater uptake than this would be required amongst this group in order to establish a plantation resource capable of meeting the firewood requirements of Adelaide and Outer Adelaide. The advantages of establishing plantations in this manner is that their commercially viability is not totally reliant on future wood sales. They will continue to provide valuable economic and environmental benefits to the landowner even if no market for their wood can be found. 6.4 CONCLUSIONS Assessing the commercial viability of firewood plantations does not necessarily provide an accurate insight into the full extent of firewood plantation development that may occur in the future. This is because many landowners will consider lifestyle and aesthetic issues ahead of economic viability when deciding whether or not to plant trees. Also those (either individual landowners or investors) who do consider economic viability to be important, may take a very optimistic view of productivity and prices when making their decision. However, the study indicated that the generally high land values in the region will limit interest in large scale plantation development amongst potential significant investors, and only existing farmers running low profitability sheep and cattle grazing ventures will be attracted to firewood as a replacement land use on a moderate to large scale. Even allowing for the significant financial incentives being offered to establish plantations, a land suitability analysis in the Mount Barker, Alexandrina, and Yankalilla Districts showed that only fast-growing blue gum in the high rainfall zones (ie. > 800 mm.) on the Fleurieu Peninsula would produce a Net Present Value (NPV) from firewood production, that strongly exceeded the current value of the land for agriculture. This comparison was based on large-scale plantation development by outside investors leasing land at the accepted market rate of 5% of its value. Other areas that were suitable for outside investment based only on NPV calculated at optimistic low discount rates were the mm. rainfall zone in the Alexandrina and Yankalilla Districts planted to sugar gum, and the same zone planted to blue gum in the Yankalilla District. No areas within the Mount Barker District were suitable due to high land values, and it is assumed that similar high land values in the Adelaide Hills District would make it also unsuitable for investment. Existing farmers considering large scale direct investment in plantations as a replacement land use are likely to compare the economic performance of firewood against their current agricultural enterprises. Using the concept of Gross Margins commonly used to measure agricultural performance, an equivalent Net Present Value was able to be determined to provide a direct comparison with firewood production. This analysis found that for landowners with an optimistic view of future economic conditions (ie. sustained low discount rates), there are opportunities to replace agricultural ventures with firewood plantations. However, the loss of annual income associated with replacing an agricultural venture with trees is likely to be a major disincentive to most existing farmers considering trees on a moderate to large scale. Essentially the relationship between the economic performances of differing land uses is a dynamic one which changes frequently with variations in commodity prices and economic conditions. The analysis conducted as part of this study should therefore be considered to be only a snapshot of their relative performance at the present time when high Gross Margins are prevailing as a result of good commodity prices. A similar comparison done three years previously may have shown firewood plantations in an even better light. It is now generally accepted that small areas of strategically located, lineal tree plantations as an integrated, complementary land use can significantly enhance the productivity of an existing agricultural primary land use by sheltering crops, pasture or stock in their lee. The accepted general rule is that establishing trees on only 10% of a property s area in windbreaks and shelterbelts can increase agricultural productivity from the property as a whole by 10%. Consequently, landowners considering the merits of establishing firewood plantations in this manner do not necessarily have to consider them in terms of a direct replacement of their existing landuse, in the manner of a plantation investment company. The commercial viability of plantations established as an integrated and complementary land use can only be assessed in conjunction with the agricultural land use on a whole-of-property basis. However, the reality is that establishing windbreaks and shelterbelts on a substantial area of a property will usually reduce its overall commercial productivity for many years before benefits become apparent. This is because tree planting ties up land that previously produced an annual income, it requires a significant initial expenditure, and it takes many years for trees to reach a size sufficient to provide the sheltering benefits that can increase crop or pasture production. However, eventually plantations established in this manner will increase the overall commercial viability of a property, particularly if firewood can be produced and sold periodically from the windbreaks. There should be a high level of interest and hopefully uptake amongst farmers with a progressive attitude to environmental, crop and pasture protection who are aware of the potential for strategically located lineal plantations to enhance agricultural production whilst at the same time providing potential for income diversification. 51
62 In addition, it is estimated that about 25% of the land base in the Mount Lofty Ranges is owned by non-traditional farmers, including hobby farmers and others who have a strong interest in conservation and tree growing. Uptake of the MLRFFG incentives to establish firewood plantations amongst this group is likely to result in a large number of plantations of only small average size. 7. REFERENCES AHHA (2001) Alarautalahti, J. (2002). Annual Report (2000/01) Fireside News, Vol. 41 & 42, Newsletter of the Australian Home Heating Association Inc. Owner and operator of a Hakki Pilke firewood mill. Pers. com. Canberra. Annual Report of the Alexandrina District Council, 2000/01 Financial Year. Armidale Air Quality Research Group (1996) Comparison of Air Pollution Caused by Cars and Woodheaters. Web-site: ABARE (1999) Forest Plantations on Cleared Agricultural Land in Australia A Regional EconomicAnalysis. ABARE Research Report No. 15. Prepared by Burns, Walker and Hansard. Australia and New Zealand Environment and Conservation Council, (2001). A National Approach to Firewood Australia. Case study The ACT Firewood Strategy. Collection and Use in Australian Bureau of Statistics 1996 Population and Housing Census data taken from ABS web-site Baker et al (1999) Bulman (2002) Bulman (2002D) Feasibility Study of Farm Forestry Development in the Port Phillip and Westernport Region. Prepared for the Department of Natural Resources and Environment by Baker, Poynter, and Wareing. Personal comments by Peter Bulman, Farm Tree Systems, formerly of the Department of Primary Industries and Resources, South Australia. Draft Report: The Feasibility of Attracting Significant Private Investors (SPI) into non-prospectus forestry investment in the Mount Lofty Ranges. March Caire (pers.comm.) Personal comments by Jason Caire, Environment Protection Agency, April, CAR (2001) Dickson et al (2001) Clean Air Revival. Burning Issues web-site. Australian Energy Projections to 2019/20. Australian Bureau of Agricultural and Resource Economics (ABARE). Dillon (pers. comm.) Personal comments by Benita Dillon, SA National Parks & Wildlife Service, April, Driscoll et al (2000) Impact and Use of Firewood in Australia. CSIRO Sustainable Ecosystems. Prepared by Driscoll, Freudenberger, and Milkovits. Driscoll et al (2000a) Impact and Use of Firewood in Australia. Chapter 3a. Driscoll et al (2000b) Impact and Use of Firewood in Australia. Chapter 2b. Economists at Large (2000) Firewood Business. The Business of Growing Firewood for Profit in Victoria. A Report to the Victorian National Parks Association. EIA (1999) US Department of Energy. Energy Information Administration, Annual Energy Review, Energy SA (2001) England (pers. comm.) Environment Australia (2001) EPA (2002) Transition Study Summary. On Energy SA website. Personal comments by Martyn England. Consultant, PIRSA Rural Solutions, and committee member of the Mount Lofty Ranges Farm Forestry Group, March Impact of Firewood Collection and Use Firewood Facts; and Reducing Smoke from Wood Heaters. Environment Protection Agency, NSW. 52
63 EPA Victoria (2002) Is Your Wood Heater Smoky? Notice of Draft Policy Impact Assessment. Herald Sun, March 27 th, EREN (2000) Energy Efficiency and Renewable Energy Network. US Department of Energy Freudenberger (pers. comm., 3/02) Personal comments by David Freudenberger, CSIRO Sustainable Ecosystems Unit. FTSUT (1989) Geddes Management (1997) Geddes Management (1997A) Gill, Tony. (1997). Hamilton (2000) Hamilton (2002) Hamilton (pers. comm., 3/02) Hamilton, CJ (1999) HPBA (2000) Fuelwood Use and Supply in Australia. Consultancy Report No. 28. Commonwealth Department of Primary Industries and Energy. Mount Lofty Ranges Farm Forestry Development Group. Farm Forestry Industry Plan. Comparisons of Agricultural Returns with Forestry Returns A Preliminary Investigation. Prepared for the Mount Lofty Ranges Forest Industries Development Group. Treegrowers Co-operatives The Key To The Future Of Farm Forestry. In: Money, marketing and management, Farm Forestry Conference, Ballarat. Presented by the Corangamite Farm Forestry Project. Plantation Firewood and Sawlog Growing Options for Lower Rainfall Areas in Victoria. Corangamite Farm Forestry Network, Colac, Victoria. In Australian Forest Grower. Vol. 23 No. 2. The Sugar Gum Story The Marketing Success of a Humble Shelter Tree. Presented to the AHHA Conference. February, Personal comments by Liz Hamilton. Co-manager, Corangamite Farm Forestry Project, Colac, Victoria. Developments in Power Generation from Biomass in Europe. Australian Institute of Energy National Conference. University of Melbourne Hearth Industry Statistics Hearth, Patio & Barbeque Association of America Hughes, V. (1997). Co-operative Opportunities in Farm Forestry, Co-operative Federation of Victoria. In: Gill (2002). Hurley (2001) Kevin (2000) Vince Hurley (Neville Smith Timber Industries). Appearance Grade Timber from Plantation Logs. Presentation to the Gippsland Plantation Hardwood Sawlog Forum. November What do People Think About Private Forestry in Victoria? Agroforestry News. Summer Prepared by Trish Kevin, Farm Forestry Industry Development Officer, Creswick Landcare Centre, Victoria. Lang, Andrew (2001). Ramping up $ugar Gum returns to growers. Australian Forest Grower, Winter Lang (pers. comm., 3/02) McCormacket al (2000). Personal comments by Andrew Lang. Project Officer, Corangamite Farm Forestry Project, Colac, Victoria. Citing results from recent joint CSIRO/ CFFP project. Harvesting Trees on Farms. A report for the RIRDC/LWRRDC/FWPRDC Joint Venture Agroforestry Program. RIRDC Publication No. 00/ pp. Minister of Environment and Heritage (2001) Firewood Conference Burns the Good Oil in Armidale. Media Release by the Hon. Dr. Sharman Stone (25 th May, 2001) Mogg (pers. comm.) Mount Barker DCM (2002) Personal comments by Bruce Mogg, Deputy National Chairman, Australian Home Heating Association, Sydney. April 2002 Mount Barker District Demographics and Statistics, from Murray (pers. comm.) Peter Murray, District Forester, State Forests NSW, Mildura, March Naughton (pers. comm.) Peter Naughton, Area Forester, Gunns Ltd., Longreach, Tasmania, February Neagle (1994) NRC (1996) Odlum and Wilson (2001) Outlook (2000) The Environmental Impact and Ecological Sustainability of Woodcutting in South Australia. Department of Environment and Natural Heritage. A Guide to Residential Wood Heating. Office of Energy Efficiency. Natural Resources Canada. South Australian Electricity Futures With and Without Kyoto. Paper presented to the International Solar Energy Society World Solar Congress. November Energy SA. Proceedings of the National Outlook Conference. Forest Products: Outlook to for industry investment and growth. ABARE. Canberra. 53
64 PIRSA (1999) South Australia: Residential Energy Related Greenhouse Gas Emission. Energy SA Advisory Centre. Primary Industries and Resources, South Australia (1999) Future Directions for Farm Forestry Part 2 / Aiming for the Sky. Available on PSCAA (2001) Puget Sound Clean Air Agency. Washington State, USA.. Available on Raison (2001) Wood Waste as a Greenhouse-friendly Fuel. Sydney Morning Herald, 20 th September Reed Sturgess and Associates (1995) Supply and Demand Issues in the Firewood Market in Victoria. Department of Conservation and Natural Resources. Richards (1996) Rogers (1989) SAE (2000) Sonogan, (2000). Sonogan (1998) Achieving Sustainable Land Management on Small Rural Properties in the Port Phillip Landcare Region, Victoria. Department of Natural Resources and Environment / National Landcare Program. Domestic Heating and Firewood Usage in South Australia. Australian Bureau of Statistics, Catalogue No Adelaide. Choosing a Heating System. Victorian Sustainable Energy Authority. Some observations which may affect consumer preference for plantation grown firewood. In: A Burning Issue, VNPA, Bendigo, Plantation-grown Firewood for Home Heating What are the Obstacles? North East Victorian Branch of Australian Forest Growers. In Agroforestry News. Vol. 7, Issue 4. The Advertiser (2001) Real Estate Commentary. Rural Land Prices Jump ( ). On the Infarmation website - Wettenhall (pers. comm.) David Wettenhall, Consultant, Plantall Forestry Consultants, Albany, WA., February
65 APPENDICES Appendix 1 Farm Forestry Technical Note: Harvesting Systems and Marketing Strategies for Firewood Plantations Appendix 2 Adelaide Wood Yard Survey April 2002 Prepared for the study by Peter Bulman
66
67 Appendix 1 APPENDIX 1 Farm Forestry Technical Note: Harvesting Systems and Marketing for Firewood Plantations This document is available from the Mount Lofty Ranges Farm Forestry Group 1
68
 6. Landscape and Rural Supplies 7. Stirling Fuel Supply Questions 1. What species of firewood do you sell?")
69 Appendix 2 APPENDIX 2 Adelaide Wood Yard Survey Woodyards visited 1. Adelaide Discount Firewood 2. Adelaide Hills Firewood (Home Timber & Hardware) 3. Adelaide Wholesale Landscape Supplies 4. Blackwood Landscape and Firewood 5. Firewood Merchants (closed or shifted) 6. Landscape and Rural Supplies 7. Stirling Fuel Supply Questions 1. What species of firewood do you sell? All yards sold predominantly red gum. Only one yard had some mallee roots (see photo). Two yards had a variety of other species including SA blue gum (E leucoxylon) in the foreground of the photo below, yellow box, possibly grey box and a little she oak. Yards that had a variety of species did not differentiate price-wise. No yards were selling sugar gum, but one sells it when available. He was very keen to access supplies. Retail prices were $170, $180, $180, $185, $187 and $192 (in increasing order and included GST) when collected at the woodyard. Delivery was extra $7/t on one case. Premium price was sometimes justified on the basis of hand loading ie no rubbish. 2. What are the main areas of supply for these species (where do you obtain it)? Most of the wood was supplied from two operations out of New South Wales near Deniliquin. One wholesaler stated that he supplied about one third of the Adelaide, but he and another key operator both obtained their supplies from interstate. Minor supplies came from western Victoria across the border from the Southeast and Upper Southeast. Nothing much came from the Mount Lofty Ranges. 3. Is it becoming more difficult to obtain supplies? Apart from temporary shortfalls in supplies during cold wet winters, the wood is available at a price, but the local scarcity necessitates supplies being obtained from interstate. 4. Would you be interested in selling young (10-15 years) plantation grown wood? Most woodyard owners were not familiar with the burning properties of young plantation grown wood. Samples of each of the woods were provided and the information sheet on sugar gum left with those when appropriate. For those not familiar with sugar gum, there is little doubt that some sample loads would soon provide the consumer confidence and reputation required for market acceptance especially when marketed as plantation-grown firewood. It was premature to talk about a premium price for plantationgrown wood with most of the woodyard owners. Photo on right holding sugar gum on left and red gum on the right 5. What are the preferred species? Red gum (but at least one owner commented on the slow ignition of red gum being a problem and considered it over rated) and SA blue gum and sugar gum (but both were in very short supplies). 1
plantation forestry in the Great Southern region (WA)
") socioeconomic impacts of plantation forestry in the Great Southern region (WA) introduction This information booklet summarises the key findings of a recent study conducted by the Bureau of Rural Sciences,
socioeconomic impacts of plantation forestry in the Great Southern region (WA) introduction This information booklet summarises the key findings of a recent study conducted by the Bureau of Rural Sciences,
Plantations for Australia: The 2020 Vision. Presentation to the. Workshop on Forestry. Strategic Planning in the. Asia-Pacific Region
 Plantations for Australia: The 2020 Vision Presentation to the Workshop on Forestry Strategic Planning in the Asia-Pacific Region Ben Mitchell, International Forest Policy 3 November 2013 Overview Introduction
Some highlights of the Victoria study include: A large untapped resource: The modelling results show strong growth in
 Victoria has enough clean energy potential to power homes remove pollution equivalent to cars create 1,500,000 1,600,000 6,500 new jobs Australia is in the early stages of a clean energy boom, with tens
Community attitudes to plantations
 Community attitudes to plantations SURVEY OF THE VIEWS OF RESIDENTS OF TASMANIA, 2008 science for sustainable forest landscapes Author Kathryn Williams ISBN 978-0-9805903-5-7 2 Introduction Plantations
Sensis e-business Report
 September 2010 Sensis e-business Report The Online Experience of Small and Medium Enterprises Table of Contents INTRODUCTION... 1 ABOUT THE SURVEY... 2 EXECUTIVE SUMMARY... 4 LEVELS OF COMPUTER OWNERSHIP...
NSW RURAL LAND PERFORMANCE:
 Australasian Agribusiness Review - Vol.18-2010 Paper 6 ISSN 1442-6951 NSW RURAL LAND PERFORMANCE: 1990-2008 Professor Chris Eves Queensland University of Technology, School of Urban Development, 2 George
B-triple Road Network. NFF Submission
 B-triple Road Network NFF Submission August 2007 Table of Contents The National Farmers Federation... 3 Introduction... 3 B-triple Network Expansion Needs... 4 North South-Railway... 4 Grain Lines... 4
Upland forestry WALES study - Welsh Analysis of Land-use Economics & Subsidies
 Upland forestry WALES study - Welsh Analysis of Land-use Economics & Subsidies Executive Summary Comparisons - The purpose of this study is to make a specific economic comparison between surveyed established
QLD Total 1,631, , , , , ,455 66,075 26,441 % 27% 26% 10% 15% 17% 4% 2% $50 $40 $30 $20 $10 -$10 -$20
 '000 MT 19 August, 2013 Mackay Fcast Prod: 94,893t 12/13 (ACF EST): 106,375t Fitzroy : 214,652t 12/13: 224,673t Wide Bay Burnett : 13,825t 12/13: 13,789t South West : 449,423t 12/13: 493,703t Darling Downs
Analysing Options for the Red Gum Forests Along the Murray River
 Analysing Options for the Red Gum Forests Along the Murray River Jeff Bennett 1 Rob Dumsday 2 and Rob Gillespie 3 Abstract The Victorian Environmental Assessment Council is conducting an investigation
Australian Pine Log Price Index Updated to June 2003 ADVISORY
 Australian Pine Log Price Index Updated to June 23 ADVISORY Australian Pine Log Price Index Updated to June 23 This report contains 22 pages Contents 1 About the Pine Log Index 2 2 Growers and regions
INTEGRATED PROCESSING OF OIL MALLEE TREES FOR ACTIVATED CARBON, EUCALYPTUS OIL AND RENEWABLE ENERGY
 INTEGRATED PROCESSING OF OIL MALLEE TREES FOR ACTIVATED CARBON, EUCALYPTUS OIL AND RENEWABLE ENERGY Paper presented at: Oil Mallees - Profitable Landcare Perth, Friday 19th March 1999 Paper presented by
ACCC Review of Proposed Timber Transaction
 28 October 2009 Company Announcements Platform Australian Securities Exchange ACCC Review of Proposed Timber Transaction Please find attached a release to the market. Yours sincerely Wayne Chapman Company
Why cutting Australia s greenhouse gases will be good for regional jobs
 Why cutting Australia s greenhouse gases will be good for regional jobs It is often claimed that reducing Australia greenhouse gas emissions to meet our commitments under the Kyoto Protocol would cause
Agribusiness Index. Australia. December Quarter 2009
 Agribusiness Index Australia. December Quarter 2009 Aus stra lia. What happened? EPI +0.04 Up 0.02 from the September Driven up by increased levels of capital expenditure and employment Best performer
Forestry and related products
 Percentage of Tasmanian total Sector summary 2014 Forestry and related products The trade and investment sectors contained in the sector summary series have been compiled from Australian and New Zealand
research report The Impact of a Carbon Price on Australian Farm Businesses: Grain Production Australia s Independent Farm Policy Research Institute
 research report June 2011 The Impact of a Carbon Price on Australian Farm Businesses: Grain Production A report prepared by the Australian Farm Institute with funding from GrainCorp Operations Limited
Controlled Wood Risk Assessment. Version 2.0
 Controlled Wood Risk Assessment Page 1 of 8 Contents 1 Introduction... 3 2 Approach for assessing HCV risk... 4 2.1 Assessing HCV risk for SLIMF suppliers:... 4 2.2 Assessing HCV risk for large corporate
Water Accounts. Building physical flow accounts with actual data. Presented by: Lauren Binns
 Water Accounts Building physical flow accounts with actual data Presented by: Lauren Binns Building Accounts with Data Introduction Presents annual flows of water from the environment to the economy, within
Comparing the economics of agroforestry versus traditional grazing in steep country Torwood 2018
 Comparing the economics of agroforestry versus traditional grazing in steep country Torwood 2018 Page 0 of 16 A case study comparing the economics of agroforestry versus traditional grazing in steep country
Economics, agriculture and native vegetation in NSW
 Economics, agriculture and native vegetation in NSW October 2014 ISSN 1836-9014 Roderick Campbell, Andrew Scarlett About The Australia Institute The Australia Institute is an independent public policy
The impact of a carbon price on Australian farm businesses: Grain production
 The impact of a carbon price on Australian farm businesses: Grain production Australian Farm Institute, May 2011. Summary Farm level modelling was carried out of the impact of an economy-wide carbon price
GrassGro 3 easier, faster analysis of grazing systems
 GrassGro is a decision support tool developed by CSIRO to assist decisionmaking by farmers and managers of grassland resources. GrassGro helps analyse opportunities and risks that variable weather imposes
research report The Impact of a Carbon Price on Australian Farm Businesses: Cotton Farming Australia s Independent Farm Policy Research Institute
 research report June 2011 The Impact of a Carbon Price on Australian Farm Businesses: Cotton Farming A report prepared by the Australian Farm Institute with funding from Cotton Australia 2011 Australian
RICS Roots 2006, Wadham College Oxford, 4 th to 5 th April 2006 THE ROLE OF TIMBER PLANTATIONS IN U.K. INVESTMENT PORTFOLIOS
 RICS Roots 2006, Wadham College Oxford, 4 th to 5 th April 2006 THE ROLE OF TIMBER PLANTATIONS IN U.K. INVESTMENT PORTFOLIOS * : Contact author evesa@lincoln.ac.nz PROFESSOR CHRIS EVES* Lincoln University,
Evaluating the economic benefits of salinity management in irrigated agriculture
 Evaluating the economic benefits of salinity management in irrigated agriculture Dailin Kularatne Paper presented at the 45th Annual Conference of the Australian Agricultural and Resource Economics Society,
SOUTH AUSTRALIA S WASTE AND RESOURCE RECOVERY INFRASTRUCTURE PLAN Companion Report: Modelling Assumptions
 SOUTH AUSTRALIA S WASTE AND RESOURCE RECOVERY INFRASTRUCTURE PLAN Companion Report: Modelling Assumptions Contents 1. Assumptions for Waste Flow Projection Modelling...04 1.1 Baseline waste volumes estimates...04
AUSTRALIAN AGRIBUSINESS GROUP MARKET OVERVIEW THE AUSTRALIAN SOFTWOOD PLANTATION INDUSTRY
 26/7 AUSTRALIAN AGRIBUSINESS GROUP MARKET OVERVIEW THE AUSTRALIAN SOFTWOOD PLANTATION INDUSTRY Independent Assessment May 27 Industry Snapshot Australia has 1.72 million hectares of timber plantations
Sensis e-business Report
 August 2005 Sensis e- Report The Online Experience of Small and Medium Enterprises Table of Contents Introduction... 1 About the surveys... 2 Executive summary... 4 Levels of computerisation... 6 Equipment
PLANTATION REVISION DATE DESCRIPTION PREPARED BY REVIEWED BY APPROVED BY. A. Archer W. Hammond
 PLANTATION Document No: MANUAL 011 REVISION DATE DESCRIPTION PREPARED BY REVIEWED BY APPROVED BY 00 Jul 2009 Initial issue 01 Jan 2010 02 Mar 2012 A. Archer W. Hammond R. Breidahl R. Breidahl Reviewed
Renewable Energy Index. October 2018
 Renewable Energy Index October 2018 Green Energy Markets, November 2018 Key highlights The recent rapid rate of wind and solar installations puts Australia s main grids on track to have three-quarters
INTERNATIONAL COTTON ADVISORY COMMITTEE. Abidjan, Ivory Coast 2 6 December 2018 AUSTRALIAN COUNTRY REPORT
 INTERNATIONAL COTTON ADVISORY COMMITTEE 77 th PLENARY MEETING "Cotton Challenges: Smart and Sustainable Solutions" Abidjan, Ivory Coast 2 6 December 2018 AUSTRALIAN COUNTRY REPORT Prepared by the Australian
Australian vegetable-growing farms An economic survey, and
 Australian vegetable-growing farms An economic survey, 2014 15 and 2015 16 Dale Ashton and Aruni Weragoda Research by the Australian Bureau of Agricultural and Resource Economics and Sciences Research
THE ANALYSIS OF NSW RURAL PROPERTY:
 22 ND ANNUAL PACIFIC-RIM REAL ESTATE SOCIETY CONFERENCE SUNSHINE COAST, AUSTRALIA, 17-20 JANUARY 2016 THE ANALYSIS OF NSW RURAL PROPERTY: 1990-2014 PROF CHRIS EVES 1 Queensland University of Technology,
Analysing vegetable growers' financial performance by state Contents
 1 Analysing vegetable growers' financial performance by state Contents Introduction... 3 Australian vegetable growers financial performance... 3 New South Wales vegetable growers financial performance...
Farm businesses, wool production and biodiversity
 Extension note 1 Farm businesses, wool production and biodiversity More than half of woolgrowers in Victoria have native vegetation on their land. Most native vegetation is in the form of native bush,
Variability in weather: what are the consequences for grazing enterprises? Libby Salmon and John Donnelly
 74 Variability in weather: what are the consequences for grazing enterprises? Libby Salmon and John Donnelly CSIRO Plant Industry, GPO Box 1600, Canberra, ACT 2601 Email: libby.salmon@csiro.au Abstract
Joint Submission from Beef + Lamb New Zealand and Deer Industry New Zealand to:
 Joint Submission from Beef + Lamb New Zealand and Deer Industry New Zealand to: The New Zealand Productivity Commission on the Low-emissions economy draft report - April 2018 21 June 2018 About the submitters
Market Outlook: December 2010
 Market Outlook: December 2010 The Changing Landscape of China s Domestic Forestry Sector Do Growing Supply-Demand Imbalances Set the Stage for Institutional Investment Opportunities? The Changing Landscape
2017 GLOBAL SUSTAINABILITY REPORT AUSTRALIA
 207 GLOBAL SUSTAINABILITY REPORT AUSTRALIA Research RMS has established a ten year partnership with seed growers to improve the volume and quality of the mature trees we produce. In 207, we developed a
Risk Beyond Farmers Control: Grain-Sheep Mixed Farming Systems under Rainfall and Commodity Price Variability. Rukman Wimalasuriya
 Risk Beyond Farmers Control: Grain-Sheep Mixed Farming Systems under Rainfall and Commodity Price Variability Rukman Wimalasuriya Farm Management Economist Department of Natural Resources & Environment,
NSWIC NEW SOUTH WALES IRRIGATORS COUNCIL
 NSWIC NEW SOUTH WALES IRRIGATORS COUNCIL PO Box R1437 Royal Exchange NSW 1225 Tel: 02 9251 8466 Fax: 02 9251 8477 info@nswic.org.au www.nswic.org.au ABN: 49 087 281 746 Briefing Note Australian Crop Report
The Domestic Fuelwood Sector in Whangarei and Northland and the Role of Manuka as a Fuelwood and a Forest.
 The Domestic Fuelwood Sector in Whangarei and Northland and the Role of Manuka as a Fuelwood and a Forest. Ecologic, P 0 Box 56126, Dominion Road, Auckland 6. ISSN 1171-9834 1995 Department of Conservation
Off to a cautious start hot, dry summer tests Aussie farmer confidence about the year ahead
 Off to a cautious start hot, dry summer tests Aussie farmer confidence about the year ahead Results at a glance: Australian farmers adopt cautious outlook on year ahead, as confidence falls back from recent
Sourcing timber: what resource is available and how is it managed? Jim Burgess Resource and Environment Manager Timber Queensland
 Sourcing timber: what resource is available and how is it managed? Jim Burgess Resource and Environment Manager Timber Queensland Presentation Outline Queensland hardwood & cypress resource Other Australian
Forest industries. National Association of Forest Industries. and climate change
 Forest industries National Association of Forest Industries and climate change A publication produced by the National Association of Forest Industries (NAFI) 2007 The carbon life-cycle ATMOSPHERE FOREST
CONTENTS 2. PROJECT DESCRIPTION NEED FOR THE PROJECT ABOUT THE PROPONENT SITE SELECTION OVERVIEW OF THE PROJECT 2 5
 CONTENTS 2. PROJECT DESCRIPTION 2-2 2.1 NEED FOR THE PROJECT 2 2 2.2 ABOUT THE PROPONENT 2 4 2.3 SITE SELECTION 2 4 2.4 OVERVIEW OF THE PROJECT 2 5 Figure 2.1: Provisional wind profile for the Jeffrey
Land Accounts. Linking people, p the economy and environment. Mark Lound, Director, Environmental Accounts
 ABS Environmental Accounts Land Accounts Linking people, p the economy and environment Mark Lound, Director, Environmental Accounts Environmental accounting in Australia Environmental Accounting in Australia
Adapting to Change, Forming New Habits
 1 Adapting to Change, Forming New Habits Community Summary of the Climate Change Adaptation Plan for the RDA Barossa Region 1 The region The Barossa RDA (Regional Development Australia) Region is famous
Land management practice trends in Australia s northern and remote agricultural industries
 Land management practice trends in Australia s northern and remote agricultural industries Introduction Northern and remote Australia includes 11 Natural Resource Management (NRM) regions in Western Australia,
National Meeting on Future Plantation Investment. Report & Action Plan
 National Meeting on Future Plantation Investment Summary Report & Action Plan Lyndall Bull, Rod Keenan, Howard Parry-Husbands To meet future wood demand, the global area of tree plantations may need to
THE ANALYSIS OF NSW RURAL PROPERTY:
 22 ND ANNUAL PACIFIC-RIM REAL ESTATE SOCIETY CONFERENCE SUNSHINE COAST, AUSTRALIA, 17-20 JANUARY 2016 THE ANALYSIS OF NSW RURAL PROPERTY: 1990-2014 PROF CHRIS EVES 1 Queensland University of Technology,
Australian Carbon Policy: What it means for agriculture and agribusiness
 Australian Carbon Policy: What it means for agriculture and agribusiness Australian carbon policy Agriculture sector impacts The Carbon Farming Initiative (CFI) Implications There is no such thing as a
Construction and Housing:
 Construction and Housing: Softwood Timber Sector Overview March 2017 Disclaimer New Forests 2017. This presentation is issued by and is the property of New Forests Asset Management Pty Ltd (New Forests)
The Negative Effects of Electricity Cost Increases on Sugar Cane Production in the Bundaberg Mill area. CASE STUDY
 The Negative Effects of Electricity Cost Increases on Sugar Cane Production in the Bundaberg Mill area. CASE STUDY Rapidly increasing costs of irrigation, mainly energy used on-farm and by the SunWater
Heading to Presentation
 Heading to Presentation Carbon Sequestration Forestry Project Pollution stems from a fundamental failure of markets to incorporate the full cost of economic activities G Hardin (1968) CO2 Australia: A
Live Sheep Export Brief Report
 Live Sheep Export Brief Report 20 th April 2018 Commissioned by WA Farmers Federation with support of Sheep Producers Australia Key findings: The current live sheep export trade volume represents a third
SOME ASPECTS OF AGRICULTURAL POLICY IN AUSTRALIA
 SOME ASPECTS OF AGRICULTURAL POLICY IN AUSTRALIA R. A. Sherwin, Agricultural Attache Australian Embassy, Washington, D. C. Before discussing government programs relating to agriculture in Australia I propose
Assessment Of Irrigation Rehabilitation Options In The Lower Murray Reclaimed Irrigation Area
 Assessment Of Irrigation Rehabilitation Options In The Lower Murray Reclaimed Irrigation Area Sarah Wheeler 1, Doug Young 1, Stefan Hajkowicz 2, Andrew Manson 3. and Melissa Bright 1. 1 PIRSA Rural Solutions,
PORTER FOREST MAUNGAKOTUKUTUKU ROAD, PARAPARAUMU hectares - includes 81 hectares of Pinus radiata
 PORTER FOREST MAUNGAKOTUKUTUKU ROAD, PARAPARAUMU CentrePort, Wellington 50 km Masterton mills - 111 km 156.6752 hectares - includes 81 hectares of Pinus radiata Short to medium term investment opportunity
ATTACHMENTS UNDER SEPARATE COVER Monday 12 February 2018
 Item Town of Gawler Council Assessment Panel ATTACHMENTS UNDER SEPARATE COVER Monday 12 February 2018 Page No 5.3 Development Application: 490/9/2018 83 Applicant: Address: Nature of Development: Attachment
Innovations in Protecting Water Quality through Implementing a Nitrogen Cap and Trade System, Lake Taupo
 Innovations in Protecting Water Quality through Implementing a Nitrogen Cap and Trade System, Lake Taupo Jan Hania Environment Waikato Aotearoa, New Zealand International Rivers Symposium, Brisbane, Australia
The economics of farm level emissions
 The economics of farm level emissions Ross Kingwell Department of Agriculture & Food (WA) and University of Western Australia The Big Picture The economics of farm-level emissions crucially depend on how
Ways to reduce Australia s emissions by 60% Andrew Burge Sue MacAlpine
 Ways to reduce Australia s emissions by 60% Andrew Burge Sue MacAlpine Covering Climate Change and Greenhouse Gases Climate Science Stern IPCC Emission Targets Abatement Incentives Emissions Trading Abatement
The Common Agricultural Policy (CAP) is the first common policy adopted by the
 is the first common policy adopted by the") Evaluation of Agricultural Policy Reforms in the European Union OECD 2011 Executive Summary The Common Agricultural Policy (CAP) is the first common policy adopted by the European Community under the Treaty
Evaluation of Agricultural Policy Reforms in the European Union OECD 2011 Executive Summary The Common Agricultural Policy (CAP) is the first common policy adopted by the European Community under the Treaty
Assessing changes in social capacity: experience with the Most Significant Change technique
 Assessing changes in social capacity: experience with the Most Significant Change technique Richard Moore 1 and Leonie Offer 2 1 Forest Products Commission, PO Box 236, Bunbury, WA, 6230. richard.moore@fpc.wa.gov.au
For personal use only
 ABN 74 143 928 625 Registered Office 1 Level, 153 Yambil Street Griffith NSW 2680 Phone: +61 (02) 6962 5470 Fax: +61 (02) 6964 1546 ASX CODE: MCA ASX ANNOUNCEMENT 22 March 2017 Dear Shareholders, I am
Community perceptions of aquaculture:
 Community perceptions of aquaculture: Summary DEPARTMENT OF AGRICULTURE, FISHERIES AND FORESTRY Commonwealth of Australia 2005 This work is copyright. Apart from any use as permitted under the Copyright
The benefits and costs of alternative growth paths for Sydney
 The benefits and costs of alternative growth paths for Sydney Economic, social and environmental impacts Prepared for NSW Department of Planning Centre for International Economics Canberra & Sydney December
MAINSTREAMING SOLAR HOT WATER
 MAINSTREAMING SOLAR HOT WATER Ken Guthrie, Robert Hines, Sonja Ott, Katrina Woolfe Sustainability Victoria Level 28, 50 Lonsdale Street, Melbourne 3000 ken.guthrie@sustainability.vic.gov.au ABSTRACT Water
NEWSLETTER 5 JUNE 2008 PAGE 1. Newsletter INSIDE THIS ISSUE: Formation of Northern Poultry Cluster Ltd 1
 NEWSLETTER 5 PAGE 1 FORMATION OF NORTHERN POULTRY CLUSTER Ltd INSIDE THIS ISSUE: The Cluster is taking a new step towards its long term future as a vehicle for commercial collaboration, through the formation
SOUTH AUSTRALIA VICTORIA (HEYWOOD) INTERCONNECTOR UPGRADE
 INTERCONNECTOR UPGRADE") 26 October 2012 Hugo Klingenberg Senior Manager Network Development Electranet Pty Ltd consultation@electranet.com.au Ashley Lloyd Senior Manager Victorian Planning Australian Energy Market Operator planning@aemo.com.au
26 October 2012 Hugo Klingenberg Senior Manager Network Development Electranet Pty Ltd consultation@electranet.com.au Ashley Lloyd Senior Manager Victorian Planning Australian Energy Market Operator planning@aemo.com.au
Australian Beef Financial performance of beef farms, to
 Australian Beef Financial performance of beef farms, 2014 15 to 2016 17 Jeremy van Dijk, James Frilay and Dale Ashton Research by the Australian Bureau of Agricultural and Resource Economics and Sciences
Water Availability in the Namoi and Gwydir Murray-Darling Basin Sustainable Yields Project. 20 December 2007
 Water Availability in the Namoi and Gwydir Murray-Darling Basin Sustainable Yields Project 20 December 2007 Project terms of reference Water Summit: PM and First Ministers, Nov 2006 CSIRO to report progressively
The Cooperative Research Centre for Forestry
 The Cooperative Research Centre for Forestry science for sustainable forest landscapes EXTENSION Bid prospectus 2012 2017 B The Cooperative Research Centre for Forestry Australia is at a defining point
Chapter 13 Private Native Forestry: River Red Gum
 Chapter 13 Private Native Forestry: River Red Gum Mike Thompson State Forests NSW, Deniliquin Introduction Private native forestry in the Riverina mainly relates to River Red Gum (floodplain forests) box
Analysis of the Impact of Decoupling on Agriculture in the UK
 Analysis of the Impact of Decoupling on Agriculture in the UK Joan Moss, Seamus McErlean, Philip Kostov and Myles Patton Department of Agricultural and Food Economics Queen s University Belfast Patrick
Plantation water use research in South East South Australia
 Plantation water use research in South East South Australia Click to edit Master subtitle style Richard Benyon Tanya Doody CSIRO Forestry and Forest Products Introduction All use of natural resources (eg.
Understanding change in Basin communities
 Understanding change in Basin communities How to interpret the indicators of social and economic condition Through working with communities, industry and Basin governments, the MDBA has identified those
AUSTRALIAN CATTLE & BEEF
 AUSTRALIAN CATTLE & BEEF DECEMBER 2016 SUMMARY About the research The Australian Cattle and Beef Update includes data and outlooks on cattle herd and slaughter levels, beef production in Australia and
Making cents for Northland farms with the ETS John-Paul Praat 1 and Bob Thomson 2
 Making cents for Northland farms with the ETS John-Paul Praat 1 and Bob Thomson 2 1 P.A. Handford and Associates, PO Box 52, Paekakariki 2 AgFirst Northland, PO Box 1345, Whangarei Corresponding author
Integrity. Reliability. Sustainability.
 Integrity. Reliability. Sustainability. A New Leader in Plantation Timber Products New Forests Timber Products is the timber sales agent for New Forests Australian hardwood timber plantation estates. The
POTATO INDUSTRY LIMESTONE COAST
 POTATO INDUSTRY LIMESTONE COAST CONTENTS Introduction 1 Economic Contribution 4 Industry Trends 7 Industry Advantages 12 Industry Challenges 13 Further information 15 References 16 DOCUMENT DETAILS Owner
All too hard? What drivers of success are missing for a hardwood plantation industry in North Queensland?
 All too hard? What drivers of success are missing for a hardwood plantation industry in North Queensland? Alex Lindsay Institute of Foresters of Australia Biennial national conference Cairns, 15 August
Quick quarterly statistics
 Issue 22 ember 218 Quick quarterly statistics page 1 Economic activity quarterly page 2 Employment quarterly page 3 Household welfare quarterly page 4 Selected primary industries annual page 5 Spotlight
WIND FARM OPINION POLL. Conducted 11th 13th May 2015
 WIND FARM OPINION POLL Conducted 11th 13th May 2015 Abstract An insight into opinions regarding renewable energy and the environment in the Bournemouth area, and the feasibility of the Navitus Bay Wind
Eskdalemuir A comparison of forestry and hill farming; productivity and economic impact
 Eskdalemuir A comparison of forestry and hill farming; productivity and economic impact Contents Executive Summary 3 1.0 Introduction and Objectives 4 2.0 Forestry survey and model 6 3.0 Agricultural output
Agroforestry Survey: A Summary of Responses
 Agroforestry Survey: A Summary of Responses MAY 2011 Sophie Lewis Agroecology Intern, Elm Farm, Hamstead Marshall, Newbury, Berkshire, RG20 0HR Kindly Supported by funding from Agroforestry Survey: A Summary
Agricultural. Credit Conditions. Farmland Markets Show Signs of Cooling. SURVEY of TENTH DISTRICT
 SURVEY of TENTH DISTRICT Agricultural Credit Conditions S4 et hp tqeuma rb te err 22 00 1 30 FF ee dd ee rraall RReesseerrvvee BBa annk k o of f KKa an ns sa as s C Ci ti ty y Farmland Markets Show Signs
Farm Income Comparison IS FORESTRY WORTH IT FOR YOU?
 IS FORESTRY WORTH IT FOR YOU? 1 INTRODUCTION Forestry is a growth industry in Ireland, contributing to 1% of GDP in 2015. Changing land use from traditional farm systems to a permanent land use such as
Climate Risk Management through Structural Adjustment and Regional Relocation: A Case of Rice Industry in Australia Shahbaz Mushtaq
 Climate Risk Management through Structural Adjustment and Regional Relocation: A Case of Rice Industry in Australia Shahbaz Mushtaq Climate Risk Management Symposium Guayaquil, Ecuador October 10-12, 2011
[In]Sights for Competitive Regions: Labour Market Efficiency
![[In]Sights for Competitive Regions: Labour Market Efficiency](/thumbs/90/103027487.jpg "[In]Sights for Competitive Regions: Labour Market Efficiency") [In]Sights for Regions: Labour Market Efficiency [In]Sight: Australia s regional ness index is the lens regions need to make the most of their advantages. This report provides an analysis of Labour Market
[In]Sights for Regions: Labour Market Efficiency [In]Sight: Australia s regional ness index is the lens regions need to make the most of their advantages. This report provides an analysis of Labour Market
3 Forestry in Finland
 3 Forestry in Finland 3.1 Utilisation of Wood Resources Finland s abundant forest resources are sufficient to meet the Finnish forest industry s demand for roundwood, with the exception of birch. The industry
AUSTRALIA. The system of practices that identify forest lands subject to Forest Management;
 AUSTRALIA Submission to the SBI and SBSTA February 2011 Forest Management Reference Level Submission I. Overview This submission contains estimates of Forest Management reference levels for Australia as
Performance Audit Report
 Performance Audit Report Yield Forecasts hardwood plantations Issue The Auditor General s Performance Audit Sustaining Native Forest Operations: Forests NSW of April 2009 included an action item (Recommendation
LIFE-CYCLE ASSESSMENT OF GREENHOUSE GAS EMISSIONS FROM IRRIGATED MAIZE: THE LIFE-CYCLE ANALYSIS
 LIFE-CYCLE ASSESSMENT OF GREENHOUSE GAS EMISSIONS FROM IRRIGATED MAIZE: THE LIFE-CYCLE ANALYSIS T. Grant 1 and T. Beer 1 1 CSIRO Marine and Atmospheric Research, PMB1 Aspendale Vic. 3195 timothy.grant@csiro.au;
Chapter 4 Agricultural Resources of Juniata and Mifflin Counties
 Chapter 4 Agricultural Resources of Juniata and Mifflin Counties Agricultural Resources of Juniata and Mifflin Counties Introduction Juniata and Mifflin Counties have significant farmland nestled between
1 Yellow Social Media Report 2018 Businesses. Yellow Social Media Report Part Two Businesses.
 1 Yellow Social Media Report. Part Two Businesses. 02 Table of Contents. Executive Summary... 03 Methodology... 05 Australian businesses and social media... 06 Use of social media summary...08 Use of social
Investing in. building our portfolio. Macquarie Australia Conference. Annual General Meeting 17 November Costa Group Holdings Limited ASX:CGC
 Annual General Meeting 17 November 2016 Costa Group Holdings Limited ASX:CGC Investing in and building our portfolio Macquarie Australia Conference Investing in 1 Growth st May 2018 Costa The Costa business
Australian Electronic Game Industry Profile
 Australian Electronic Game Industry Profile November 2006 Prepared for Game Developers Association of Australia Insight Economics Pty Ltd ABN 65 118 264912 www.insighteconomics.com.au Melbourne Level 1,