Land use in Hardee County : prepared by Center for Economic Development Research, College of Business Administration, University of South Florida
|
|
|
- Florence Douglas
- 6 years ago
- Views:
Transcription

.")
1 University of South Florida Scholar Commons College of Business Publications College of Business Land use in Hardee County : prepared by Center for Economic Development Research, College of Business Administration, University of South Florida University of South Florida. Center for Economic Development Research Follow this and additional works at: Part of the Business Commons Scholar Commons Citation University of South Florida. Center for Economic Development Research, "Land use in Hardee County : prepared by Center for Economic Development Research, College of Business Administration, University of South Florida" (2003). College of Business Publications. Paper This Article is brought to you for free and open access by the College of Business at Scholar Commons. It has been accepted for inclusion in College of Business Publications by an authorized administrator of Scholar Commons. For more information, please contact scholarcommons@usf.edu.
2 Land Use in Hardee County Prepared By CENTER FOR ECONOMIC DEVELOPMENT RESEARCH College of Business Administration 1101 Channelside Dr., 2 nd Floor N., Tampa, Florida Office: (813) or Fax: (813) February, 2003
3 Table of Contents INTRODUCTION... 3 METHOD... 4 ANALYSIS... 4 CONCLUDING REMARKS... 8 APPENDIX A. FLORIDA LAND USE AND COVER CLASSIFICATION SYSTEM... 9 APPENDIX B. HARDEE COUNTY LAND USE: APPENDIX C. THEMATIC MAPS i
4 Preface Hardee County is located in south-central Florida within the region served by the Central Florida Regional Planning Council (CFRPC), a state-mandated planning organization. Besides Hardee, the CFRPC planning district is also comprised of DeSoto, Highlands, Polk, and Okeechobee counties. Cargill Crop Nutrition, Inc. commissioned this document to serve as a component of its campaign to better understand the economic and demographic structure of Hardee County and the south-central Florida region. This study is the second in a series of economic development studies designed to increase our understanding of the economic impacts of the phosphate industry in Hardee County. CEDR provides information and conducts research on issues related to economic growth and development in the Nation, in the state of Florida, and particularly in the central Florida region. The Center serves the faculty, staff, and students of the College of Business Administration, the University, and individuals and organizations in the University s service area. CEDR s activities are designed to further the objectives of the University and specifically the objectives of the College of Business Administration. Robert Anderson, Dean, College of Business Administration (COBA), USF Dennis G. Colie, Dircetor, Center for Economic Development Research (CEDR), COBA, USF Danny R. Hughes, Research Associate, CEDR, COBA, USF ii
5 INTRODUCTION In an effort to better understand the economic and demographic structure of Hardee County and the south-central Florida region, Cargill Crop Nutrition, Inc. commissioned the Center for Economic Development Research (CEDR), College of Business Administration (COBA), University of South Florida (USF), to perform an analysis of land use in Hardee County. Predominantly a rural, agricultural county since its settlement, Hardee County has largely escaped the rapid urbanization experienced by its neighbors to the north and west. As Hardee County prepares to fuel the engines of growth, it is important to examine how land use has evolved in the county. This information is useful for supporting policy development in land use decisions, which are often critical to the foundations of sustained economic growth. 3
6 METHOD Actual land use in Hardee County was determined by Geographical Information System (GIS) overlays of Hardee County from the Southwest Florida Water Management District (SWFWMD). These overlays are 1:24,000 scale United States Geological Survey images that have been photointerpreted according to the Florida Land Use and Cover Classification System (FLUCCS). SWFWMD verification of the photo-interpretation was conducted by pre- and post-interpretation helicopter overflights of selected areas. This analysis covers 1974, 1988, 1995, and 1999, the only years currently available. Due to advances in digital aerial photography that permit increased accuracy and changes in the FLUCCS over time, the 1974 images are not adequately comparable to later images. Thus, the 1974 land use images are not considered in the broader analysis. For completeness, land use patterns for Hardee County in 1974 are examined in Appendix B of this report. The Florida Land Use and Cover Classification System supports three levels of detail which are described in Appendix A. Level 1 FLUCCS classifications are sufficiently detailed for this analysis and were used throughout except for the identification of property used for resource extraction. As the SWFWMD GIS overlays of Hardee County were only photo-interpreted at the Level 2 classifications, property indicated as extraction includes all property used for strip mines, sand and gravel pits, rock quarries, oil and gas fields, and holding ponds. Calculation of the total coverage for each land use category was performed using the ArcView 3.2 GIS software s X-Tools extension. Thematic maps detailing land use in Hardee County for each study year are included in Appendix C. ANALYSIS Hardee County, carved out of Desoto County in 1921, covers 408,536 acres in southwest Florida. A map of Hardee County and its major roads and cities can be found in Appendix C (page 14). In this section, we examine the changes in Hardee County land use over three distinct points in time: 1988, 1995, and Land use is classified into nine broad categories for this analysis: Extraction, Urban and Built-up, Agriculture, Rangeland, Upland Forests, Water, Wetlands, Barren Land, and Transportation, Communication, and Utilities (TCU). As indicated previously in the report, this study examines actual land use as captured by aerial photography as opposed to zoned, planned, or appraised uses at each point in time. Table 1 provides the total quantity of acres actually engaged by each land use and what percentage it comprises of Hardee County land. 4
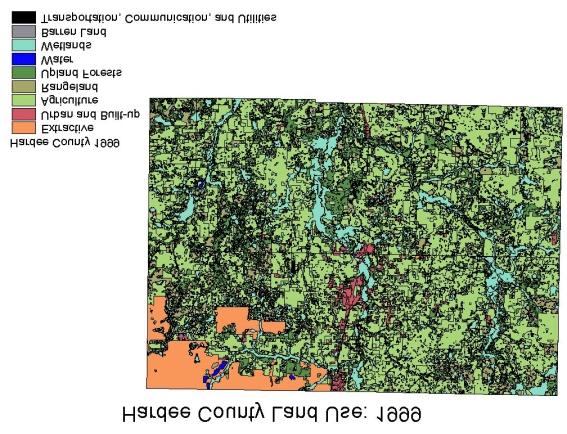
7 Table 1. Hardee County Land Use Land Use Acres % of Total Acres % of Total Acres % of Total Extraction 6, % 10, % 22, % Urban and Built-up 5, % 7, % 7, % Agriculture 229, % 227, % 220, % Rangeland 39, % 34, % 30, % Upland Forests 47, % 48, % 48, % Water % 1, % 1, % Wetlands 79, % 78, % 76, % Barren Land % % % Transportartion, Communication, and Utilities % % As Table 1 indicates, Hardee County is predominantly agricultural in nature with substantial portions of forests, range, and wetlands. Figures 1-3 below present the data in Table 1 for each year. In Figure 1 we see that 57% of Hardee County s land area is used for agricultural purposes. In 1988, less than 2% of the county s land area is developed (including infrastructure). Possessing no natural lakes, less than ½% of Hardee County is covered by water with a majority deriving from the winding Peace River, which bisects the county. Figure 1. Hardee County Land Use: 1988 Rangeland 1 Upland Forests 12% Agriculture 57% Wetlands 19% Other 4% Extraction 1% Urban and Built-up 1% Water Barren Land Transportartion, Communication, and Utilities Figure 2 shows modest changes in land use from 1988 to While agriculture and rangeland use fell 1% and 2% respectively, land covered by wetlands and forests were largely unchanged. Although, water still comprised less than ½% of the county s land area, the number of acres underwater increased 72.1%. This increase occurred due to the creation of four man-made lakes on land previously used for resource extraction. As shown on the 1995 land use map in Appendix C (page 17), increasing development to the east and northeast of Wauchula largely produced the 1% increase in urban and built-up land. Intensification of the mining industry in the 5
8 four-corners region led to a 2% increase in extraction land uses in the county. Figure 2. Hardee County Land Use: 1995 Rangeland 8% Upland Forests 12% Agriculture 56% Wetlands 19% Other 5% Extraction 3% Urban and Built-up 2% Water Barren Land Transportartion, Communication, and Utilities Figure 3 details Hardee County land use in Again, forest and wetland acreage experienced very slight declines, maintaining their share of Hardee County s land. Extraction land use doubled from 1995, increasing their share to 6%. This resulted in additional declines in agricultural and rangeland, which saw declines of 2% and 1%, respectively. Developed and water acres increased slightly, leaving their shares uncxhanged. Figure 3. Hardee County Land Use: 1999 Upland Forests Rangeland 12% 7% Wetlands 19% Agriculture 54% Other 2% Extraction 6% Urban and Built-up 2% Water Barren Land Transportartion, Communication, and Utilities 6
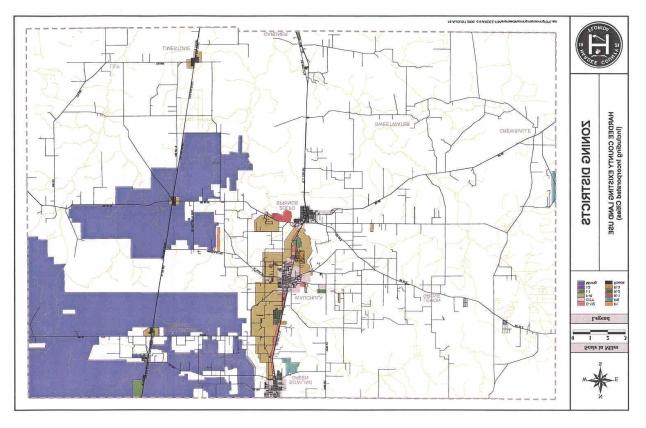
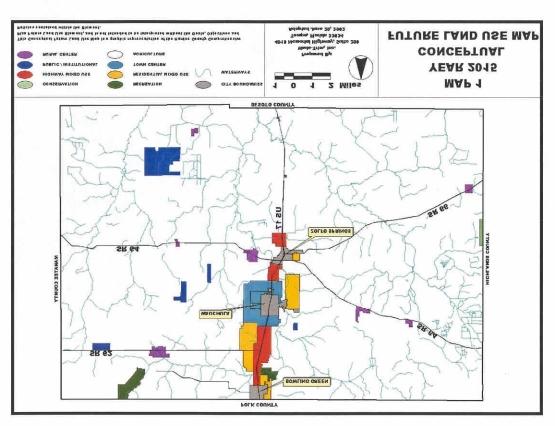
9 Table 2 displays the total and percentage change in acres for each of the land use categories in Hardee County from 1988 to 1999, as well as the change in each land uses share of Hardee County s total land area. Table 2. Changes in Land Use by Category Land Use Acres % Change in Coverage Change in Share of Total Land Area Extraction 16, % 4.09% Urban and Built-up 2, % 0.51% Agriculture (8,401) -3.66% -2.06% Rangeland (9,213) % -2.26% Upland Forests % Water % 0.19% Wetlands (2,860) -3.61% -0.7 Barren Land % 0.04% Transportartion, Communication, and Utilities % 0.04% As indicated above, with the exception of extraction, agriculture, and rangeland, Hardee County s land use has changed very little from 1988 to While we see large percentage changes in the total acres used for water and barren land, they actually represent miniscule changes in their share of the county s total land area due to the small amount of acres these uses originally covered. The only uses to lose acres over the period, agriculture, rangeland, and wetlands, have largely done so due to increased mineral extraction in the county. While an examination of historical land use can provide indications of land use trends and development patterns, future land use may be better determined when this information is combined with current zoning and land use plans, which typically indicate the desired land uses for a community. In Appendix C, we have included a map of Zoning Districts in Hardee County (page 19) as well as the Year 2015 Conceptual Future Land Use Map (page 20) from the Hardee County Comprehensive Plan adopted on June 20, Of particular interest, land currently zoned for mineral extraction greatly exceeds the area covered by this use in 1999 and then is expected to disappear by Substantial increases in developed acreage are also foreseen with development clustered along the US 17 corridor north of Wauchula. 7
10 CONCLUDING REMARKS Examining actual land use as captured by United States Geological Survey images, we find that Hardee County land use patterns are slowly evolving from predominantly undeveloped uses, i.e. agriculture, rangeland, forests, and wetlands, which comprised approximately 92% of the county in 1999, to more developed uses. From 1988 to 1999, land used for natural resource extraction has increased 273.9%, or 22,820 acres, resulting in decreases in the share of land used for agriculture and rangeland. Wetlands have also fallen from 19.4% of Hardee County s total area to 18.7%. Urban land uses have increased 36.5% over this period, primarily along the US 17 corridor and to the east of Wauchula. Land used for infrastructure, defined as transportation, communication, and utilities in this study, has also increased during this period (60.2%) reflecting increasing growth and development in the county. A look at Hardee County s current zoning and 2015 conceptual land use corroborate these findings. While resource extraction is expected to intensify in the near future before eventually receding as the land is reclaimed for alternative uses, further urban development is anticipated, again, along the US 17 corridor north of Wauchula. While these visions of an increasingly urbanized Hardee County may yet unfold, it is likely that Hardee County shall retain its rural, agricultural character for the foreseeable future. 8
11 APPENDIX A. FLORIDA LAND USE AND COVER CLASSIFICATION SYSTEM Level 1/Level 2/Level 3 Description 1000 Urban and Built-up 1100 Residential, low density 1120 Mobile home units, low density 1200 Residential, medium density 1220 Mobile home units, medium density 1300 Residential, high density 1320 Mobile home density, high density 1400 Commercial and services 1420 Junk Yards 1440 Cultural and entertainment 1460 Tourist services 1480 Cemeteries 1500 Industrial 1560 Other heavy Industrial 1600 Extractive 1610 Strip Mines 1620 Sand and gravel pits 1630 Rock quarries 1640 Oil and gas fields 1660 Holding ponds 1700 Institutional 1710 Educational facilities 1720 Religious 1730 Military 1740 Medical and Health care 1760 Correctional 1790 Institutional under construction 1800 Recreational 1810 Swimming Beach 1820 Golf Courses 1830 Race Tracks 1840 Marinas and Fish camps 1850 Parks and zoos 1860 Community recreational facilities 1870 Stadiums 1880 Historic sites 1890 Other recreational 1900 Open land (Urban) 9
12 2000 Agriculture 2100 Cropland and pastureland 2200 Tree crops 2300 Feeding operations 2400 Nurseries and vineyards 2500 Specialty farms 2540 Aquaculture 2600 Other open land (Rural) 3000 Rangeland 3200 Shrub and brushland 3220 Coastal shrub 3300 Mixed rangeland 4000 Upland Forests 4100 Upland coniferous forests 4130 Sand pines 4200 Upland hardwood forests 4340 Mixed coniferous/hardwood 4350 Dead trees 4400 Tree plantations 4410 Coniferous plantations 4430 Forest regeneration areas 5000 Water 5100 Streams and watersways 5200 Lakes 5300 Reservoirs 5400 Bays and estuaries 5410 Embayments opening directly into the Gulf 5420 Embayments not opening directly into the Gulf 5600 Slough waters 5700 Oceans, Seas, and Gulf s 6000 Wetlands 6100 Wetland hardwood forests 6110 Bay swamps 6120 Mangrove swamps 6130 Gum swamps 6150 Stream and lake swamps 6160 Inland ponds and swamps 6200 Wetland coniferous forests 6210 Cypress 6230 Atlantic cedar 6300 Wetland forest mixed 6400 Vegetated non-forested wetlands 10
13 6410 Freshwater marshes 6420 Saltwater marshes 6440 Emergent aquatic vegetation 6500 Non-vegetated 6530 Intermittent ponds 6900 Wetland shrub 7000 Barren land 7100 Beaches 7200 Sand other than beaches 7300 Exposed rock 7400 Disturbed land 7420 Borrow lakes 7450 Burned areas 7500 Riverine sandbars 8000 Transportation, communications, and utilities 8100 Transportation 8110 Airports 8120 Railroads 8140 Roads and highways 8150 Port facilities 8160 Canals and docks 8170 Oil, water, or gas transmission lines 8180 Auto parking facilities 8200 Communications 8210 Transmission towers 8220 Communication facilities 8300 Utilities 8310 Electrical power facilities 8320 Electrical power transmission lines 8330 Water supply lines 8340 Sewage treatment 8350 Solid waste disposal 11
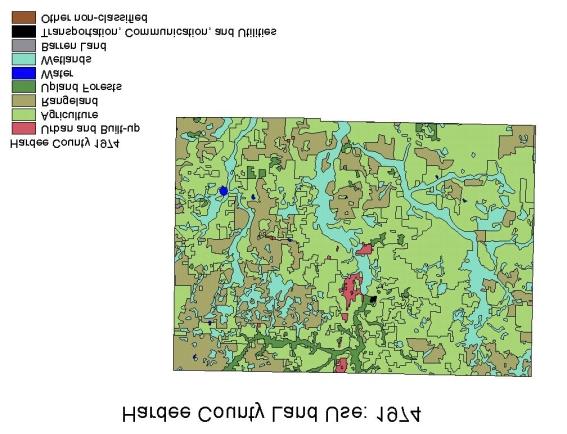
14 APPENDIX B. HARDEE COUNTY LAND USE: 1974 Table B displays the distribution of property by land use in Hardee County in Consistent with our previous analysis, agriculture is the dominant land use in Hardee County followed by rangeland. At 3,225 acres, Urban and Built-up property comprise less than 1% of the county. Table B Land Use Acres % of Total Other non-classified % Urban and Built-up 3, % Agriculture 239, % Rangeland 87, % Upland Forests 11, % Water % Wetlands 65, % Barren Land % Transportartion, Communication, and Utilities % This information is shown graphically in Figure B below. Appendix C (page 15) contains a thematic map detailing 1974 land use throughout the county. Figure B Rangeland 21% Upland Forests 3% Wetlands 16% Other non-classified Other 1% Urban and Built-up 1% Water Agriculture 59% Barren Land Transportartion, Communication, and Utilities 12
15 APPENDIX C. THEMATIC MAPS This section contains thematic maps displaying historical land use patterns within Hardee County. Information regarding the data and creation of these maps is detailed within the body of this report. Map Title Page Hardee County: Cities and Major Roads 14 Hardee County Land Use: Hardee County Land Use: Hardee County Land Use: Hardee County Land Use: Hardee County Zoning Districts: Hardee County Conceptual Land Use:
16 14
17 15
18 16
19 17
20 18
21 19
22 20
c Name a Name b Scrubby Flatwoods 82, Scrubby Flatwoods Pine Rockland 16, Pine Rockland 1330
 c Name a Name b 1000 1000000 1 Terrestrial - - - 1100 1100000 11 Hardwood Forested Uplands - - - 1110 1110000 111 Upland Hardwood Forest 273,406 1100000 Hardwood Forested Uplands 1111 1111000 1111 Dry
Analysis of the Vulnerability of Southeast Florida to Sea Level Rise
 Analysis of the Vulnerability of Southeast Florida to Sea Level Rise South Florida Regional Climate Change Compact Mapping and Vulnerability Assessment Work Group April, 2011 Contents Vulnerability to
DOR LAND USE CODES. Residential
 DOR LAND USE CODES USE CODE PROPERTY TYPE Residential 000 Vacant Residential with/without extra features(field 50 Special Features 001 Single Family 002 Mobile Homes 003 Multi-family - 10 units or more
The Parker River Watershed: An Assessment of Recent Trends in Salt Marshes, Their Buffers, and River-Stream Buffer Zones ( )
") U.S. Fish and Wildlife Service. The Parker River Watershed: An Assessment of Recent Trends in Salt Marshes, Their Buffers, and River-Stream Buffer Zones (1985-1999) National Wetlands Inventory Northeast
U.S. Fish and Wildlife Service. The Parker River Watershed: An Assessment of Recent Trends in Salt Marshes, Their Buffers, and River-Stream Buffer Zones (1985-1999) National Wetlands Inventory Northeast
Chapter 6: Land Use/Land Cover
 Chapter 6: Land Use/Land Cover The general historic land use pattern that emerged in Burt Township is similar to many other communities across the Upper Peninsula. Commercial fishing and lumbering were
Subject Property GULF OF MEXICO. Cope Family Property Location Map Acres (approximately) Pasco County Environmental Lands
 Pasco County Environmental Lands") GULF OF MEXICO COPE FAMILY PROPERTY Location Map 652.516 Acres (approximately) 0 2 4 6 Conservation Linkages Public Lands Miles PASCO COUNTY GIS 03.07.12 JMH The data contained herein is not reflected
GULF OF MEXICO COPE FAMILY PROPERTY Location Map 652.516 Acres (approximately) 0 2 4 6 Conservation Linkages Public Lands Miles PASCO COUNTY GIS 03.07.12 JMH The data contained herein is not reflected
Appendix I. Potential Adverse Change to Wetland Function Methodology and Results
 Appendix I Potential Adverse Change to Wetland Function Methodology and Results Technical Memorandum North Florida Regional Water Supply Plan Potential Adverse Change to Wetland Function January 3, 2017
CHAPTER SIX: LAND USE
 CHAPTER SIX: LAND USE An evaluation of land use is critical to community planning. Planning for future use of land, when done in an objective and thoughtful manner, can help communities balance the competing
Coastal Wetlands. About Coastal Wetlands. Contact Us. Water: Wetlands. You are here: Water Our Waters Wetlands Coastal Wetlands
 Contact Us Water: Wetlands You are here: Water Our Waters Wetlands Coastal Wetlands Coastal Wetlands About Coastal Wetlands Coastal Wetlands Initiative Managing Stressors Tools & Links About Coastal Wetlands
Image Classification I
 Image Classification I Classification is the process of labeling image pixels using predetermined categorical classes. Components: Image features Classification scheme Signatures Training Classifiers Classification
Natural & Cultural Resources
 II. Natural & Cultural Resources Hydrology/Water Management The North Thousand Islands is located within the Banana River and within the Indian River Lagoon system. Significant waterbodies within the region
RECOMMENDATION REPORT
 SARPY COUNTY PLANNING & BUILDING DEPARTMENT RECOMMENDATION REPORT TEXT AMENDMENTS TO SARPY COUNTY ZONING REGULATIONS SECTION 9 AGRICULTURAL FARMING DISTRICT SECTION 10 AGRICULTURAL DEVELOPMENT DISTRICT
Country fact sheet. Land cover Kosovo* September Photo: Toni García, My City/EEA. *Under UNSCR 1244/99.
 Country fact sheet Land cover 2012 Kosovo* September 2017 Photo: Toni García, My City/EEA *Under UNSCR 1244/99. Land cover 2012 Overview of land cover & change The overall pace of land cover development
Freshwater ecosystems
 Aquatic Ecosystems Aquatic Ecosystems The types of organisms in an aquatic ecosystem are determined by the water s salinity. Salinity - Amount of salt in the water. Freshwater ecosystems do not have any
Country fact sheet. Land cover Finland. September Photo: Toni García, My City/EEA
 Country fact sheet Land cover 2012 Finland September 2017 Photo: Toni García, My City/EEA Land cover 2012 Overview of land cover & change The land cover development in Finland has similar intensity and
Chapter 4 - Land Use Characteristics
 Chapter 4 - Land Use Characteristics Land Divisions and Ownership Most of the private ownership is divided into tracts 10 acres or larger. Large hunt clubs, owning several sections of land are common in
Country fact sheet. Land cover Denmark. September Photo: Toni García, My City/EEA
 Country fact sheet Land cover 2012 Denmark September 2017 Photo: Toni García, My City/EEA Land cover 2012 Overview of land cover & change The overall land cover change rate in Denmark, which has been below
Country fact sheet. Land cover Malta. September Photo: Toni García, My City/EEA
 Country fact sheet Land cover 2012 Malta September 2017 Photo: Toni García, My City/EEA Land cover 2012 Overview of land cover & change Concerning the land cover development, there occurs no significant
Beverly. Produced in This report and associated map provide information about important sites for biodiversity conservation in your area.
 CONSERVING THE BIODIVERSITY OF MASSACHUSETTS IN A CHANGING WORLD Beverly Produced in 2012 This report and associated map provide information about important sites for biodiversity conservation in your
Country fact sheet. Land cover Romania. September Photo: Toni García, My City/EEA
 Country fact sheet Land cover 2012 Romania September 2017 Photo: Toni García, My City/EEA Land cover 2012 Overview of land cover & change The Romanian landscape is characterised by its low dynamics of
Country fact sheet. Land cover Luxembourg. September Photo: Toni García, My City/EEA
 Country fact sheet Land cover 2012 Luxembourg September 2017 Photo: Toni García, My City/EEA Land cover 2012 Overview of land cover & change The small country of Luxembourg shows significant decrease of
VEGETATIVE, WATER, FISH AND WILDLIFE RESOURCES POLICIES
 VEGETATIVE, WATER, FISH AND WILDLIFE RESOURCES POLICIES The County will: GOALS AND OBJECTIVES 1.1 Conserve, Enhance, Protect, Maintain and Manage Vegetative, Water, Fish and Wildlife Resources Promote
4.2.3 Regulatory Setting
 4.2.3 Regulatory Setting Federal State Farmland Protection Policy Act (7 U.S.C. Section 4201) The purpose of the Farmland Protection Policy Act (FPPA) is to minimize the extent to which federal programs
Charlotte Harbor SWIM Plan Update Proposed Quantifiable Objectives and Management Actions, January 2019
 Management Actions One of the goals of this SWIM plan is to identify strategic initiatives that will address the major issues and drivers and provide management actions that will improve and maintain the
Country fact sheet. Land cover Austria. September Photo: Toni García, My City/EEA
 Country fact sheet Land cover 2012 Austria September 2017 Photo: Toni García, My City/EEA Land cover 2012 Overview of land cover & change 2006-2012 Despite its significant acceleration, compared to the
Country fact sheet. Land cover Norway. September Photo: Toni García, My City/EEA
 Country fact sheet Land cover 2012 Norway September 2017 Photo: Toni García, My City/EEA Land cover 2012 Overview of land cover & change The Norwegian landscape is characterized by very low intensity of
Country fact sheet. Land cover Switzerland. September Photo: Toni García, My City/EEA
 Country fact sheet Land cover 2012 Switzerland September 2017 Photo: Toni García, My City/EEA Land cover 2012 Overview of land cover & change In the long term, the Swiss landscape shows very low intensity
New Jersey Forest Stewardship Program Spatial Analysis Project Map Products And Data Layers Descriptions
 New Jersey Forest Stewardship Program Spatial Analysis Project 2007 Map Products And Data Layers Descriptions 01/07 NJ Forest Stewardship Program (FSP) Spatial Analysis Project (SAP) Methodology Project
Country fact sheet. Land cover Liechtenstein. September Photo: Toni García, My City/EEA
 Country fact sheet Land cover 2012 Liechtenstein September 2017 Photo: Toni García, My City/EEA Land cover 2012 Overview of land cover & change As in previous periods, the land cover development in the
Country fact sheet. Land cover Hungary. September Photo: Toni García, My City/EEA
 Country fact sheet Land cover 2012 Hungary September 2017 Photo: Toni García, My City/EEA Land cover 2012 Overview of land cover & change With a mean annual land cover change rate of 0.5%, the overall
Final Report: Appendix A. Water Balance Analysis Assumptions
 Bridgewater State University Virtual Commons - Bridgewater State University Phase I Final Report Taunton River Watershed Project 2008 Final Report: Appendix A. Water Balance Analysis Assumptions Recommended
Regional Economic Development Planning Initiatives
 Regional Economic Development Planning Initiatives presented to Florida Department of Economic Opportunity Strategic Plan Regional Stakeholder Forum presented by Shannon Brett Program Manager Central Florida
SOUTHERN WATER USE CAUTION AREA REVIEW
 COMPONENT Water Supply Mission Components The Southern Water Use Caution Area (SWUCA) was designated in 1992 to address declines in aquifer levels occurring throughout the groundwater basin. Due to growing
Shoreland Protection Innovative Model Ordinance
 Shoreland Protection Innovative Model Ordinance Southern New Hampshire Planning Commission September 14, 2007 Innovative Land Use Guide Training Presented By: Jack Munn, Senior Planner, SNHPC For Questions
Country fact sheet. Land cover Germany. September Photo: Toni García, My City/EEA
 Country fact sheet Land cover 2012 Germany September 2017 Photo: Toni García, My City/EEA Land cover 2012 Overview of land cover & change Characterized by the annual land cover change rate of 0,1, the
Country fact sheet. Land cover Slovakia. September Photo: Toni García, My City/EEA
 Country fact sheet Land cover 2012 Slovakia September 2017 Photo: Toni García, My City/EEA Land cover 2012 Overview of land cover & change With the overall land cover change rate of 0.3 of total area,
Country fact sheet. Land cover Poland. September Photo: Toni García, My City/EEA
 Country fact sheet Land cover 2012 Poland September 2017 Photo: Toni García, My City/EEA Land cover 2012 Overview of land cover & change The comparison of annual change rates for the last three observing
Bosnia and Herzegovina
 Country fact sheet Land cover 2012 Bosnia and Herzegovina September 2017 Photo: Toni García, My City/EEA Land cover 2012 Overview of land cover & change The overall pace of land cover development in Bosnia
Country fact sheet. Land cover Italy. September Photo: Toni García, My City/EEA
 Country fact sheet Land cover 2012 Italy September 2017 Photo: Toni García, My City/EEA Land cover 2012 Overview of land cover & change Italy is a country with a relatively stable landscape, compared to
Country fact sheet. Land cover Albania. September Photo: Toni García, My City/EEA
 Country fact sheet Land cover 2012 Albania September 2017 Photo: Toni García, My City/EEA Land cover 2012 Overview of land cover & change With an annual land cover change rate of 0.1, the overall pace
Country fact sheet. Land cover Sweden. September Photo: Toni García, My City/EEA
 Country fact sheet Land cover 2012 Sweden September 2017 Photo: Toni García, My City/EEA Land cover 2012 Overview of land cover & change Landscape development in Sweden is very intensive in the 2006-2012
Country fact sheet. Land cover Spain. September Photo: Toni García, My City/EEA
 Country fact sheet Land cover 2012 Spain September 2017 Photo: Toni García, My City/EEA Land cover 2012 Overview of land cover & change The overall annual land cover change rate in Spain is 0,2, which
Country fact sheet. Land cover Cyprus. September Photo: Toni García, My City/EEA
 Country fact sheet Land cover 2012 Cyprus September 2017 Photo: Toni García, My City/EEA Land cover 2012 Overview of land cover & change In the period, there has been observed significant decrease of intensity
Micro Land Use. Rick Copeland Watershed Monitoring Section
 Micro Land Use Rick Copeland Watershed Monitoring Section Micro Land Use Micro Land Use WATERSHED MONITORING STATUS AND TREND NETWORK FEATURES & MICRO gfffgd LAND USE SHEET Status Random ID Station DDDDDFDDD
The former Yugoslav Republic of Macedonia
 Country fact sheet Land cover 2012 The former Yugoslav Republic of Macedonia September 2017 Photo: Toni García, My City/EEA Land cover 2012 Overview of land cover & change The period in the former Yugoslav
The Aviary at Rutland Ranch. Phase 1. Manatee County FSP
 The Aviary at Rutland Ranch Phase 1 Manatee County FSP Environmental Narrative Prepared for: ROWE VENTURES, LLC Prepared by: 1 8 th Avenue West Suite B Palmetto, FL 34221 941.722.0901 fax 941.722.4931
Lake of the Pines. Watershed TMDL. Depressed DO conditions in 3,700 acres of upper reservoir; declining
 Lake O O the Pines Watershed TMDL Presented at: 15 th National NPS Monitoring Workshop August 27, 2007 Vernon D. Rowe, P.E. Pilgrim s Pride Corporation Corporate Environmental Manager Lake of the Pines
Peninsular Florida Landscape Conservation Cooperative. Priority Resources
 Peninsular Florida Landscape Conservation Cooperative Priority Resources Draft Priority Resources Hardwood Forested Uplands High Pine & Scrub Pine Flatwoods & Dry Prairie Freshwater Forested Wetlands Freshwater
Appendix A SUMMARY OF EXISTING ZONING DISTRICTS FOR THE CIVIL DIVISIONS ADJACENT TO THE VILLAGE OF HARTLAND AND WITHIN THE STUDY AREA: 1998
 Appendix A SUMMARY OF EXISTING ZONING DISTRICTS FOR THE CIVIL DIVISIONS ADJACENT TO THE VILLAGE OF HARTLAND AND WITHIN THE STUDY AREA: 1998 The following tables are summaries of existing zoning ordinances
CONSERVATION OF ENVIRONMENT ENACTMENT 1996 CONSERVATION OF ENVIRONMENT (PRESCRIBED ACTIVITIES) ORDER 1999
 ORDER 1999") (No. JPBN. 1509/27 Vol. II CONSERVATION OF ENVIRONMENT ENACTMENT 1996 CONSERVATION OF ENVIRONMENT (PRESCRIBED ACTIVITIES) ORDER 1999 In exercise of the powers conferred by section 5 of the Conservation
(No. JPBN. 1509/27 Vol. II CONSERVATION OF ENVIRONMENT ENACTMENT 1996 CONSERVATION OF ENVIRONMENT (PRESCRIBED ACTIVITIES) ORDER 1999 In exercise of the powers conferred by section 5 of the Conservation
4.2 AGRICULTURAL RESOURCES
 4.2 AGRICULTURAL RESOURCES 4.2.1 PHYSICAL SETTING The Project traverses a 2.9-mile area within the 290,000-acre Santa Maria Valley which consists of the largest amount of agricultural acreages in the County
Comprehensive Statewide Forest Inventory Analysis Study
 Comprehensive Statewide Forest Inventory Analysis Study JIM KARELS, DIRECTOR FLORIDA FOREST SERVICE FLORIDA FORESTRY ASSOCIATION ANNUAL MEETING AND TRADE SHOW SEPTEMBER 3-5, 2013 The Comprehensive Statewide
Hillsborough County s E.L.A.P.P Program
 Hillsborough County s E.L.A.P.P Program What is E.L.A.P.P? Environmental Lands Acquisition and Protection Program History of E.L.A.P.P. - Voter-approved program initiated in 1987; extended in 1990 and
Country fact sheet. Land cover Bulgaria. September Photo: Toni García, My City/EEA
 Country fact sheet Land cover 2012 Bulgaria September 2017 Photo: Toni García, My City/EEA Land cover 2012 Overview of land cover & change The overall change rate in Bulgaria is very low, compared to other
1.2. Net change in land cover [ha]
![1.2. Net change in land cover [ha]](/thumbs/72/67518217.jpg "1.2. Net change in land cover [ha]") Land cover 2006 Overview of land cover & change After the large political and economical changes in Slovakia during 90 s, the period is characterised by stabilization - rapid decrease of overall intensity
Land cover 2006 Overview of land cover & change After the large political and economical changes in Slovakia during 90 s, the period is characterised by stabilization - rapid decrease of overall intensity
Country fact sheet. Land cover Serbia. September Photo: Toni García, My City/EEA
 Country fact sheet Land cover 2012 September 2017 Photo: Toni García, My City/EEA Land cover 2012 Overview of land cover & change The development of the n landscape seems to remain stable compared to previous
WEST VILLAGES IMPROVEMENT DISTRICT PLAN OF IMPROVEMENTS FOR UNIT 3 REFINANCING
 WEST VILLAGES IMPROVEMENT DISTRICT PLAN OF IMPROVEMENTS FOR UNIT 3 REFINANCING Prepared for: West Villages Improvement District c/o Special District Services, Inc. 2501A Burns Road Palm Beach Gardens,
WETLANDS AND OPEN WATERS Compensatory Mitigation Definitions of Factors
 Adverse effects as used in this section of the SOP means any adverse ecological effect on wetlands or areas of open water. Those effects, or impacts, include filling, excavating, flooding, draining, clearing,
NWI 2007 NEW TOOLS AND TECHNOLOGIES. Ralph Tiner Wetland Ecologist U.S. Fish & Wildlife Service National Wetlands Inventory Program
 NWI 2007 NEW TOOLS AND TECHNOLOGIES Ralph Tiner Wetland Ecologist U.S. Fish & Wildlife Service National Wetlands Inventory Program WHERE WE ARE GOING Improved mapping Expanded wetland classification Preliminary
Center for Urban Rural Interface Studies. Pearl River County, Mississippi Land Cover Analysis
 Center for Urban Rural Interface Studies Pearl River County, Mississippi Land Cover Analysis Introduction The Center for Urban Rural Interface Studies (CURIS) created land cover maps for its focus area
7 Mineral and Energy Resources
 7 Mineral and Energy Resources This chapter examines Humboldt County s mineral (including sand and gravel extraction) and energy (oil, gas, and geothermal) resources. Existing General Plan policies and
Country fact sheet. Land cover Slovenia. September Photo: Toni García, My City/EEA
 Country fact sheet Land cover 2012 Slovenia September 2017 Photo: Toni García, My City/EEA Land cover 2012 Overview of land cover & change 2006-2012 In the long term, Slovenia is a country with one of
Measuring and Forecasting Total Ecosystem Services Values (TEV) from Habitat Condition Analyses of Habitats in Southwest Florida : The ECOSERVE Method
 from Habitat Condition Analyses of Habitats in Southwest Florida : The ECOSERVE Method") Measuring and Forecasting Total Ecosystem Services Values (TEV) from Habitat Condition Analyses of Habitats in Southwest Florida : The ECOSERVE Method James Beever III, Planner IV Southwest Florida Regional
Measuring and Forecasting Total Ecosystem Services Values (TEV) from Habitat Condition Analyses of Habitats in Southwest Florida : The ECOSERVE Method James Beever III, Planner IV Southwest Florida Regional
Town of Huntsville Official Plan Section 9 Rural Area Page 104
 Section 9 Rural Area Page 104 9 RURAL AREA 9.1 Definition and Function Location Rural Settlements 9.1.1 The Rural Area includes those lands located outside any other land use designation identified in
1.a.1. Wetlands, Including Artificial and Degraded Systems None
 Conservation Supporting Data The purpose of the Conservation Element is to ensure the conservation, protection, and wise use of all natural ecosystem and natural resources on the Main campus, the Southwest
Aquatic Communities Aquatic communities can be classified as freshwater
 Aquatic Communities Aquatic communities can be classified as freshwater or saltwater. The two sets of communities interact and are joined by the water cycle. Gravity eventually returns all fresh water
ENVIRONMENTAL SETTING
 R. AGRICULTURE AND FOREST RESOURCES Section 4.R, Agriculture and Forest Resources, examines the effects of the Proposed Project related to agricultural and forest resources. The Environmental Setting discussion
Yamhill County Comprehensive Land Use Plan
 Yamhill County Comprehensive Land Use Plan Revised Goals And Policies - Adopted December 30, 1996 Incorporating Goal and Policy amendments through Ordinance 618 SECTION II. The Land and Water A. Agricultural
1.2. Net change in land cover [ha] 15
![1.2. Net change in land cover [ha] 15](/thumbs/88/115381486.jpg "1.2. Net change in land cover [ha] 15") Land cover 2006 Overview of land cover & change The Irish landscape (dominated by pastures and peatlands) shows to be less dynamic during this period as average yearly land cover change rate decreased
Land cover 2006 Overview of land cover & change The Irish landscape (dominated by pastures and peatlands) shows to be less dynamic during this period as average yearly land cover change rate decreased
Town of Fremont Wetland Evaluation Report
 University of New Hampshire University of New Hampshire Scholars' Repository PREP Reports & Publications Institute for the Study of Earth, Oceans, and Space (EOS) 9-2007 Town of Fremont Wetland Evaluation
Follow this and additional works at: Part of the Business Commons
 University of South Florida Scholar Commons College of Business Publications College of Business 9-1-2002 The wage and productivity impacts of new jobs on the Hillsborough County economy : job-creation
6 TH. Most of the Earth Is Covered with Water (2) Most Aquatic Species Live in Top, Middle, or Bottom Layers of Water (1)
 Most Aquatic Species Live in Top, Middle, or Bottom Layers of Water (1)") A Healthy Coral Reef in the Red Sea MILLER/SPOOLMAN ESSENTIALS OF ECOLOGY 6 TH Chapter 8 Aquatic Biodiversity Fig. 8 1, p. 168 Most of the Earth Is Covered with Water (2) Aquatic life zones Saltwater life
A Healthy Coral Reef in the Red Sea MILLER/SPOOLMAN ESSENTIALS OF ECOLOGY 6 TH Chapter 8 Aquatic Biodiversity Fig. 8 1, p. 168 Most of the Earth Is Covered with Water (2) Aquatic life zones Saltwater life
SECTION 3.322: NESKOWIN LOW DENSITY RESIDENTIAL ZONE (NeskR-1)
") SECTION 3.322: NESKOWIN LOW DENSITY RESIDENTIAL ZONE (NeskR-1) (1) PURPOSE: The purpose of the NeskR-1 zone is to designate areas for lowdensity single-family residential development and other, compatible,
SECTION 3.322: NESKOWIN LOW DENSITY RESIDENTIAL ZONE (NeskR-1) (1) PURPOSE: The purpose of the NeskR-1 zone is to designate areas for lowdensity single-family residential development and other, compatible,
Country fact sheet. Land cover Portugal. September Photo: Toni García, My City/EEA
 Country fact sheet Land cover 2012 Portugal September 2017 Photo: Toni García, My City/EEA Land cover 2012 Overview of land cover & change In the long term, Portugal is a country with the highest dynamics
Tampa Port Authority
 McKay Bay Restoration (McKay Bay Mitigation Site and McKay Bay Dredge Hole Restoration) Tampa Port Authority 2014 AAPA Environmental Awards Competition June 2014 Contact: Andy Fobes, Director of Public
terms of sections 24(2), 24(5), 24D and 44, read with section 47A(1)(b) of the
, 24(5), 24D and 44, read with section 47A(1)(b) of the") 325 National Environmental Management Act (107/1998): Amendment of the Environmental Impact Assessment Regulations Listing Notice 2 of 2014 40772 194 No. 40772 GOVERNMENT GAZETTE, 7 APRIL 2017 DEPARTMENT
325 National Environmental Management Act (107/1998): Amendment of the Environmental Impact Assessment Regulations Listing Notice 2 of 2014 40772 194 No. 40772 GOVERNMENT GAZETTE, 7 APRIL 2017 DEPARTMENT
Fecal and Total Coliform TMDL for Baker Creek (WBID 1522C)
") FINAL FLORIDA DEPARTMENT OF ENVIRONMENTAL PROTECTION Division of Water Resource Management, Bureau of Watershed Management Southwest District Tampa Bay Tributaries Basin TMDL Report Fecal and Total Coliform
FINAL FLORIDA DEPARTMENT OF ENVIRONMENTAL PROTECTION Division of Water Resource Management, Bureau of Watershed Management Southwest District Tampa Bay Tributaries Basin TMDL Report Fecal and Total Coliform
CHAPTER AGRICULTURAL ZONES
 Agricultural Zones 35.21.020 CHAPTER 35.21 - AGRICULTURAL ZONES Sections: 35.21.010 - Purpose 35.21.020 - Purposes of the Agricultural Zones 35.21.030 - Agricultural Zones Allowable Land Uses 35.21.040
OPERATIONAL GUIDLINES OF BOAD
 Coastal and Littoral Management 1. There is no precise definition of coastal areas. All definitions include coastal waters, marine waters and estuaries, and some portions of the land along the coast where
Kevin L. Erwin CE PWS Kevin L. Erwin Consulting Ecologist, Inc Bayside Parkway Ft. Myers, Florida USA
 Kevin L. Erwin CE PWS Kevin L. Erwin Consulting Ecologist, Inc. 2077 Bayside Parkway Ft. Myers, Florida 33901 USA The Lee County DR/GR: Implications for future restoration and management Estero Bay Watershed
2008 Source Water Assessment MISHNOCK WELLHEAD PROTECTION AREA SUMMARY
 2008 Source Water Assessment MISHNOCK WELLHEAD PROTECTION AREA SUMMARY The Kent County Water Authority (KCWA) maintains three wellfields: the Mishnock Wellfield, the Spring Lake Wellfield and the East
Country fact sheet. Land cover Czech Republic. September Photo: Toni García, My City/EEA
 Country fact sheet Land cover 2012 Czech Republic September 2017 Photo: Toni García, My City/EEA Land cover 2012 Overview of land cover & change According to the annual change rate (0.40%), the overall
CHAPTER 7 PHYSICAL INVENTORY OF THE CITY
 CHAPTER 7 PHYSICAL INVENTORY OF THE CITY Chapter 7: Physical Inventory of the City 39 This page intentionally left blank. Chapter 7: Physical Inventory of the City 40 SECTION 1 PHYSICAL SETTING While communities
Climate Change Vulnerability Assessment and Adaptation Opportunities for Salt Marsh Types in Southwest Florida
 Climate Change Vulnerability Assessment and Adaptation Opportunities for Salt Marsh Types in Southwest Florida James Beever III, Principal Planner IV, Southwest Florida Regional Planning Council 239-338-2550,
Valuing New Jersey s Natural Capital:
 Valuing New Jersey s Natural Capital: An Assessment of the Economic Value of the State s Natural Resources April 2007 State of New Jersey New Jersey Department of Environmental Protection Jon S. Corzine,
County of San Mateo Planning and Building Department
 County of San Mateo Planning and Building Department Coastal Development Permit EXEMPTION/EXCLUSION WORKSHEET (Categorical Exclusion Order E-81-1) (This is not a Certificate of Exemption) To be used by
Legal Perspectives on Florida Wetland Jurisdiction
 Legal Perspectives on Florida Wetland Jurisdiction Timothy J. Perry, Esq. Oertel, Fernandez, Bryant & Atkinson, P.A. Tallahassee, Florida tperry@ohfc.com History 1993 Florida Environmental Reorganization
Digital Georgia Law
 Digital Commons @ Georgia Law Land Use Clinic Student Works and Organizations 8-27-2007 City of Jefferson Curry Creek Water Supply Watershed: Estimate of Existing and Projected Impervious Cover and Assessment
Subject Property. Conservation Linkages Public Lands FLAIQ PROPERTY LOCATION MAP Acres (approximately) Pasco County Environmental Lands
 Pasco County Environmental Lands") GULF OF MEXICO FLAIQ PROPERTY 0 2 4 6 Miles jkappa 3/5/2013 G:\PCM_Jorge\ELAMP\PROJECT\FLAIQ\0-MAPS\FLAIQ_ARROWS.mxd 59.5 Acres (approximately) Conservation Linkages Public Lands FLAIQ PROPERTY LOCATION
GULF OF MEXICO FLAIQ PROPERTY 0 2 4 6 Miles jkappa 3/5/2013 G:\PCM_Jorge\ELAMP\PROJECT\FLAIQ\0-MAPS\FLAIQ_ARROWS.mxd 59.5 Acres (approximately) Conservation Linkages Public Lands FLAIQ PROPERTY LOCATION
Enclosed farmland: Arable and Horticultural, Improved and Neutral Grasslands
 executive summary Executive summary 1 Countryside Survey 2000 (CS2000) and the Northern Ireland Countryside Survey 2000 (NICS2000) have been designed to provide detailed information about the habitats
Three levels of potential mining activities are identified in the DAEIS:
 IC&R Intergovernmental Coordination and Review 4000 Gateway Centre Boulevard, Suite 100, Pinellas Park, FL 33782 Phone (727) 570-5151 FAX (727) 570-5118 www.tbrpc.org Consent Agenda 8/13/12 Agenda Item
Country fact sheet. Land cover Turkey. September Photo: Toni García, My City/EEA
 Country fact sheet Land cover 2012 Turkey September 2017 Photo: Toni García, My City/EEA Land cover 2012 Overview of land cover & change The overall pace of land cover development in Turkey has increased,
Prioritizing restoration activities for salmonid habitat within a watershed
 Prioritizing restoration activities for salmonid habitat within a watershed Author: Lisa Lackey Co-author: Laurel Marcus Abstract Maacama Creek, a tributary of the Russian River has 45 miles of tributary
SW-71 BOYD HILL NATURE PRESERVE MITIGATION PLAN
 SW-71 BOYD HILL NATURE PRESERVE MITIGATION PLAN BACKGROUND INFORMATION Project SWIM? Aquatic Control? Exotic Control? Mitigation Bank? Type No No Yes No Mitigation Wetland and upland enhancement Type Landowner
Provincial Policy Statement 2014 Training Aid
 This job aid has been developed for education and training purposes as a high-level summary of the policy changes in the PPS 2014. It should not be relied upon as a substitute for specialized legal or
TOTAL MAXIMUM DAILY LOAD (TMDL)
") TOTAL MAXIMUM DAILY LOAD (TMDL) For Nutrients In Black Point Channel (WBID 1637) Prepared by: US EPA Region 4 61 Forsyth Street SW Atlanta, Georgia 30303 September 2009 TABLE OF CONTENTS 1.0 INTRODUCTION...
TOTAL MAXIMUM DAILY LOAD (TMDL) For Nutrients In Black Point Channel (WBID 1637) Prepared by: US EPA Region 4 61 Forsyth Street SW Atlanta, Georgia 30303 September 2009 TABLE OF CONTENTS 1.0 INTRODUCTION...
Liberty Timberlands. At a Glance: Property Features
 Property Features Located an hour west of Tallahassee, Florida and five miles northeast of Bristol, the 4,256-acre Liberty Timberlands tract is bank-owned and enjoys a favorable location in the heart of
Center for Urban Rural Interface Studies. St. John the Baptist Parish, Louisiana Land Cover Analysis
 Center for Urban Rural Interface Studies St. John the Baptist Parish, Louisiana Land Cover Analysis Introduction The Center for Urban Rural Interface Studies (CURIS) created land cover maps for its focus
Appendix 5A Priority Landscapes GIS Analysis Methodology
 Appendix 5A Priority Landscapes GIS Analysis Methodology Overview This appendix describes the methodology used for Pennsylvania s Priority Landscapes GIS Analysis. The figure below is a conceptual diagram
Florida's Growth Management Act: An Introduction and Overview 1
 FE643 Florida's Growth Management Act: An Introduction and Overview 1 Roy R. Carriker 2 1.0 Introduction Table of Contents 2.0 Florida Growth Management Legislation: History 2.1 Environmental Land and