2017 Soybean Outlook & Strategies
|
|
|
- Melanie Stevens
- 5 years ago
- Views:
Transcription
1 2017 Soybean Outlook & Strategies Frayne Olson, PhD Crop Economist/Marketing Specialist Director Burdick Center for Cooperatives (o) (c) NDSU Extension Service ND Agricultural Experiment Station Dept. of Agribusiness & Applied Economics STUDENT FOCUSED LAND GRANT RESEARCH UNIVERSITY
2 Key Points USDA Production Report was a surprise, again. Picking the top is nearly impossible! Strategies: Make several smaller sales. Place sell orders in at key price levels in advance. Options (puts or calls) can be effective, but could be expensive. (short-term time line will work best)
3 U.S. Soybean Supply & Demand Table U.S. Soybean 2015/ /2017 (est.) 2017/2018 (Sep) Planted A Mill. A Mill. A Mill. A. Harvested A Mill. A Mill. A Mill. A. Yield/Harvest A bu bu bu. Beginning Stocks 191 Mill. Bu. 197 Mill. Bu. 345 Mill. Bu. Production 3,926 Mill. Bu. 4,307 Mill. Bu. 4,431 Mill. Bu. Imports 24 Mill. Bu. 25 Mill. Bu. 25 Mill. Bu. Total Supply 4,140 Mill. Bu. 4,528 Mill. Bu. 4,801 Mill. Bu. Crushings 1,886 Mill. Bu. 1,895 Mill. Bu. 1,940 Mill. Bu. Exports 1,942 Mill. Bu. 2,170 Mill. Bu. 2,250 Mill. Bu. Seed 97 Mill. Bu. 104 Mill. Bu. 101 Mill. Bu. Residual 18 Mill. Bu. 14 Mill. Bu. 35 Mill. Bu. Total Use 3,944 Mill. Bu. 4,183 Mill. Bu. 4,326 Mill. Bu. Ending Stocks 197 Mill. Bu. 345 Mill. Bu. 475 Mill. Bu. USDA WASDE Sep. 12, 2017
4 U.S. Soybean Supply & Demand Table U.S. Soybean 2015/ /2017 (est.) 2017/2018 (Sep) Planted A Mill. A Mill. A Mill. A. Harvested A Mill. A Mill. A Mill. A. Yield/Harvest A bu bu bu. Beginning Stocks 191 Mill. Bu. 197 Mill. Bu. 345 Mill. Bu. September USDA Farm Service Agency Crop Acreage Data suggests planted acreage may increase. Production 3,926 Mill. Bu. 4,307 Mill. Bu. 4,431 Mill. Bu. Imports 24 Mill. Bu. 25 Mill. Bu. 25 Mill. Bu. Total Supply 4,140 Mill. Bu. 4,528 Mill. Bu. 4,801 Mill. Bu. Crushings 1,886 Mill. Bu. 1,895 Mill. Bu. 1,940 Mill. Bu. Exports 1,942 Mill. Bu. 2,170 Mill. Bu. 2,250 Mill. Bu. Seed 97 Mill. Bu. 104 Mill. Bu. 101 Mill. Bu. Residual 18 Mill. Bu. 14 Mill. Bu. 35 Mill. Bu. Total Use 3,944 Mill. Bu. 4,183 Mill. Bu. 4,326 Mill. Bu. Ending Stocks 197 Mill. Bu. 345 Mill. Bu. 475 Mill. Bu. USDA WASDE Sep. 12, 2017
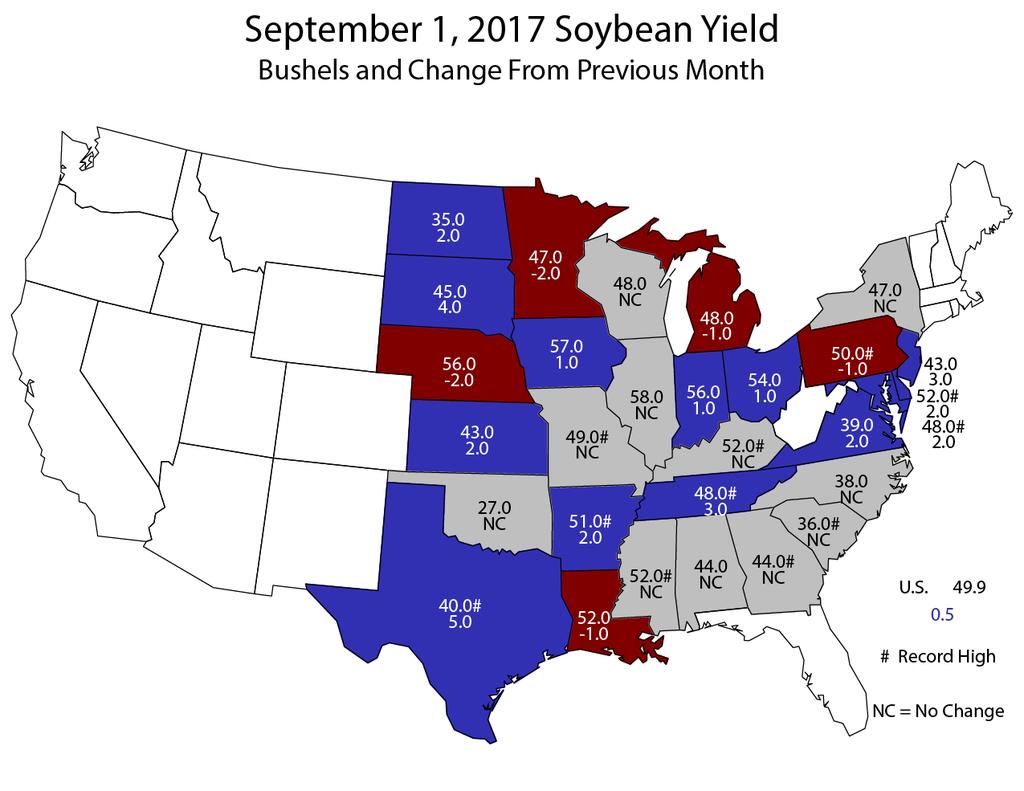
5 U.S. Soybean Supply & Demand Table U.S. Soybean 2015/ /2017 (est.) 2017/2018 (Sep) Planted A Mill. A Mill. A Mill. A. Harvested A Mill. A Mill. A Mill. A. Yield/Harvest A bu bu bu. Beginning Stocks 191 Mill. Bu. 197 Mill. Bu. 345 Mill. Bu. Production 3,926 Mill. Bu. 4,307 Mill. Bu. 4,431 Mill. Bu. Imports 24 Mill. Bu. 25 Mill. Bu. 25 Mill. Bu. Total Supply 4,140 Mill. Bu. 4,528 Mill. Bu. 4,801 Mill. Bu. September Production Report provided updated objective yield estimates. Crushings 1,886 Mill. Bu. 1,895 Mill. Bu. 1,940 Mill. Bu. Exports 1,942 Mill. Bu. 2,170 Mill. Bu. 2,250 Mill. Bu. Seed 97 Mill. Bu. 104 Mill. Bu. 101 Mill. Bu. Private estimates: Average = 48.8 High = 49.8 Low = 47.1 Residual 18 Mill. Bu. 14 Mill. Bu. 35 Mill. Bu. Total Use 3,944 Mill. Bu. 4,183 Mill. Bu. 4,323 Mill. Bu. Ending Stocks 197 Mill. Bu. 345 Mill. Bu. 475 Mill. Bu. USDA WASDE Sep. 12, 2017

 Farmers Actual Field Analysis Expected Yield Plant & Fruit")
6 Condition vs Yield Data Condition Ratings Yield Surveys How Many Reports? ~3,000 21,654 Farmers 4,544 Field Plots Who Reports? What is Reported? Extension Agents FSA Employees Overall Crop Condition (V Poor, Poor, Fair, Good, Excellent) Farmers Actual Field Analysis Expected Yield Plant & Fruit Counts/Fruit Weight
7
8
9
10
11
12
13
14
15
16 U.S. Soybean Supply & Demand Table U.S. Soybean 2015/ /2017 (est.) 2017/2018 (Sep) Planted A Mill. A Mill. A Mill. A. Harvested A Mill. A Mill. A Mill. A. Yield/Harvest A bu bu bu. Beginning Stocks 191 Mill. Bu. 197 Mill. Bu. 345 Mill. Bu. Production 3,926 Mill. Bu. 4,307 Mill. Bu. 4,431 Mill. Bu. Imports 24 Mill. Bu. 25 Mill. Bu. 25 Mill. Bu. Total Supply 4,140 Mill. Bu. 4,528 Mill. Bu. 4,801 Mill. Bu. Total Production is fifth record year in a row! (2.9% above last year s record) Crushings 1,886 Mill. Bu. 1,895 Mill. Bu. 1,940 Mill. Bu. Exports 1,942 Mill. Bu. 2,170 Mill. Bu. 2,250 Mill. Bu. Seed 97 Mill. Bu. 104 Mill. Bu. 101 Mill. Bu. Residual 18 Mill. Bu. 14 Mill. Bu. 35 Mill. Bu. Total Use 3,944 Mill. Bu. 4,183 Mill. Bu. 4,326 Mill. Bu. Will yield estimates hold? Ending Stocks 197 Mill. Bu. 345 Mill. Bu. 475 Mill. Bu. USDA WASDE Sep. 12, 2017
17 U.S. Soybean Use 2,000 Million Bushels 1,500 1, Crushings Exports Seed & Residual / / / / / / / / / / / / / / / / / /18 Sep. 12, 2017 WASDE Report & Oil Yearbook Table 3
18 U.S. Soybean Supply & Demand Table If correct, Crushings would be a another new record due to increased feed usage and strong export demand for meal. (2.4% increase) U.S. Soybean 2015/ /2017 (est.) 2017/2018 (Sep) Planted A Mill. A Mill. A Mill. A. Harvested A Mill. A Mill. A Mill. A. Yield/Harvest A bu bu bu. Beginning Stocks 191 Mill. Bu. 197 Mill. Bu. 345 Mill. Bu. Production 3,926 Mill. Bu. 4,307 Mill. Bu. 4,431 Mill. Bu. Imports 24 Mill. Bu. 25 Mill. Bu. 25 Mill. Bu. Total Supply 4,140 Mill. Bu. 4,528 Mill. Bu. 4,801 Mill. Bu. Crushings 1,886 Mill. Bu. 1,895 Mill. Bu. 1,940 Mill. Bu. Exports 1,942 Mill. Bu. 2,170 Mill. Bu. 2,250 Mill. Bu. Seed 97 Mill. Bu. 104 Mill. Bu. 101 Mill. Bu. Residual 18 Mill. Bu. 14 Mill. Bu. 35 Mill. Bu. Total Use 3,944 Mill. Bu. 4,183 Mill. Bu. 4,326 Mill. Bu. Ending Stocks 197 Mill. Bu. 345 Mill. Bu. 475 Mill. Bu. USDA WASDE Sep. 12, 2017
19 U.S. Soybean Supply & Demand Table U.S. Soybean 2015/ /2017 (est.) 2017/2018 (Sep) If correct, Exports would also be a new record (3.7% increase). Planted A Mill. A Mill. A Mill. A. Harvested A Mill. A Mill. A Mill. A. Yield/Harvest A bu bu bu. This is the third year that Exports will exceed Crushings Beginning Stocks 191 Mill. Bu. 197 Mill. Bu. 345 Mill. Bu. Production 3,926 Mill. Bu. 4,307 Mill. Bu. 4,431 Mill. Bu. Imports 24 Mill. Bu. 25 Mill. Bu. 25 Mill. Bu. Total Supply 4,140 Mill. Bu. 4,528 Mill. Bu. 4,801 Mill. Bu. Crushings 1,886 Mill. Bu. 1,895 Mill. Bu. 1,940 Mill. Bu. Exports 1,942 Mill. Bu. 2,170 Mill. Bu. 2,250 Mill. Bu. Seed 97 Mill. Bu. 104 Mill. Bu. 101 Mill. Bu. Residual 18 Mill. Bu. 14 Mill. Bu. 35 Mill. Bu. Total Use 3,944 Mill. Bu. 4,183 Mill. Bu. 4,326 Mill. Bu. Ending Stocks 197 Mill. Bu. 345 Mill. Bu. 475 Mill. Bu. USDA WASDE Sep. 12, 2017
20 U.S. Soybean Export Destinations (1,000 Metric Ton) Country 2011/ / / / / /17 China 23, , , , , ,148.3 Mexico 3, , , , , ,665.0 Indonesia 1, , , , , ,296.9 Japan 1, , , , , ,137.2 Netherlands , , , ,044.9 Taiwan , , , , , Soybean Exports by Country FAS Online
21 3,000,000 Weekly U.S. Soybean Export Sales (09/01/ /31/2017) 2,500,000 Metric Tons/Week 2,000,000 1,500,000 1,000, ,000 0 Sep Oct Nov Dec Jan Feb Mar Apr May Jun Jul Aug USDA-FSA Weekly Export Sales Report
22 U.S. Soybean Supply & Demand Table U.S. Soybean 2015/ /2017 (est.) 2017/2018 (Sep) Planted A Mill. A Mill. A Mill. A. Stocks-to-Use Ratio is forecast to increase from 8.2% to 11.0% Harvested A Mill. A Mill. A Mill. A. Yield/Harvest A bu bu bu. Beginning Stocks 191 Mill. Bu. 197 Mill. Bu. 345 Mill. Bu. Production 3,926 Mill. Bu. 4,307 Mill. Bu. 4,431 Mill. Bu. Total Production is increasing faster than Use. Imports 24 Mill. Bu. 25 Mill. Bu. 25 Mill. Bu. Total Supply 4,140 Mill. Bu. 4,528 Mill. Bu. 4,801 Mill. Bu. Crushings 1,886 Mill. Bu. 1,895 Mill. Bu. 1,940 Mill. Bu. Exports 1,942 Mill. Bu. 2,170 Mill. Bu. 2,250 Mill. Bu. Seed 97 Mill. Bu. 104 Mill. Bu. 101 Mill. Bu. Residual 18 Mill. Bu. 14 Mill. Bu. 35 Mill. Bu. Total Use 3,944 Mill. Bu. 4,183 Mill. Bu. 4,326 Mill. Bu. Ending Stocks 197 Mill. Bu. 345 Mill. Bu. 475 Mill. Bu. USDA WASDE Sep. 12, 2017
23 Billion Bushels U.S. Soybean Total Prod. & Use (Billion Bushels) Stocks-to-Use Total Production Total Use Stocks-to-Use Ratio Sep. 12, 2017 WASDE Report & Oil Yearbook Table 3
24 120.0 Historical Soybean Production (Million Metric Ton) Million Metric Ton United States Brazil Argentina Sep. 12, 2017 WASDE Report & PSD Tables 21, 22 and 23
25 Million Metric Ton Historical Soybean Production (Million Metric Ton) Brazil: 2016/ mmt 2017/ mmt Argentina: 2016/ mmt 2017/ mmt United States Brazil Argentina Sep. 12, 2017 WASDE Report & PSD Tables 21, 22 and 23
26 World Soybean Prod, Use & Stocks/Use (Million Metric Ton) Stocks-to-Use Total Production Total Use 0.60 Million Metric Tons Stocks-to-Use Ratio Sep. 12, 2017 USDA -WASDE & PSD Custom Query

27 Nov. CBOT Soybean Pricing Points DTN Prophet X pm

28 CBOT Soybean Futures Market Pricing DTN Prophet X pm

29 U.S. Dollar Index Euro = 57.6 % Japanese Yen = 13.6 % Pound Sterling = 11.9 % Canadian Dollar = 9.1 % Swedish Krona = 4.2 % Swiss Franc = 3.6 % DTN Prophet X pm
2017/18 Crop Market Outlook & Strategies
 2017/18 Crop Market Outlook & Strategies Frayne Olson, PhD Crop Economist/Marketing Specialist Director Burdick Center for Cooperatives frayne.olson@ndsu.edu 701-231-7377 (o) 701-715-3673 (c) NDSU Extension
2018/19 Crop Market Outlook & Strategies
 2018/19 Crop Market Outlook & Strategies November CBOT Soybean Futures Frayne Olson, PhD Crop Economist/Marketing Specialist Director Burdick Center for Cooperatives frayne.olson@ndsu.edu 701-231-7377
Crop Market Outlook: Where do we go from here?
 2012-13 Crop Market Outlook: Where do we go from here? Frayne Olson, PhD Crop Economist/Marketing Specialist NDSU Extension Service ND Agricultural Experiment Station Dept. of Agribusiness & Applied Economics
Crop Outlook: Now What?!
 Crop Outlook: Now What?! Frayne Olson, PhD Crop Economist/Marketing Specialist frayne.olson@ndsu.edu 701-231-7377 NDSU Extension Service ND Agricultural Experiment Station Dept. of Agribusiness & Applied
Developing a Marketing Plan
 Developing a Marketing Plan Frayne Olson, PhD Crop Economist/Marketing Specialist frayne.olson@ndsu.edu 701-231-7377 NDSU Extension Service ND Agricultural Experiment Station Dept. of Agribusiness & Applied
What are the risks? Crop Market Outlook
 What are the risks? 2012-13 Crop Market Outlook Frayne Olson, PhD Crop Economist/Marketing Specialist NDSU Extension Service ND Agricultural Experiment Station Dept. of Agribusiness & Applied Economics
2018/19 Soybean Market Outlook & Strategies
 2018/19 Soybean Market Outlook & Strategies Frayne Olson, PhD Crop Economist/Marketing Specialist Director Burdick Center for Cooperatives frayne.olson@ndsu.edu 701-231-7377 (o) 701-715-3673 (c) NDSU Extension
Crop Outlook: Now What?!
 Crop Outlook: Now What?! Frayne Olson, PhD Crop Economist/Marketing Specialist frayne.olson@ndsu.edu 701-231-7377 NDSU Extension Service ND Agricultural Experiment Station Dept. of Agribusiness & Applied
2018/19 Crop Market Outlook & Strategies
 2018/19 Crop Market Outlook & Strategies Frayne Olson, PhD Crop Economist/Marketing Specialist Director Burdick Center for Cooperatives frayne.olson@ndsu.edu 701-231-7377 (o) 701-715-3673 (c) NDSU Extension
Overview of Trade, Tariffs and Crop Marketing Strategies
 Overview of Trade, Tariffs and Crop Marketing Strategies Frayne Olson, PhD Crop Economist/Marketing Specialist Director Burdick Center for Cooperatives frayne.olson@ndsu.edu 71-231-7377 (o) 71-715-3673
Market Outlook. David Reinbott.
 Market Outlook David Reinbott Agriculture Business Specialist P.O. Box 187 Benton, MO 63736 (573) 545-3516 http://extension.missouri.edu/scott/agriculture.aspx reinbottd@missouri.edu Trending Issues China,
Corn and Soybean Market Update, August 9, 2017
 Corn and Soybean Market Update, August 9, 2017 Aaron Smith Assistant Professor Department of Agricultural and Resource Economics University of Tennessee Extension https://ag.tennessee.edu/arec/pages/cropeconomics.aspx
2012 Farm Outlook. Highlights
 2012 Farm Outlook Office of the Chief Economist USDA Highlights A promising spring planting was followed by historic drought. Record high commodity prices followed. Farm incomes are expected to be near
2017 Crop Market Outlook
 2017 Crop Market Outlook Presented at the Row Crop Short Course Jackson County Agriculture Conference Center March 2, 2017 Adam N. Rabinowitz, PhD Assistant Professor and Extension Specialist Agricultural
Fundamental Shifts Impacting U.S. Agriculture
 Fundamental Shifts Impacting U.S. Agriculture Richard Brock California Grain & Feed Association San Diego, CA April 28, Game Changers 3 fundamental shifts Long term Impact $2 cotton in 2011 industry will
World Agricultural Supply and Demand Estimates
 World Agricultural Supply and Demand Estimates Report of Interagency Commodity Estimates Committee Forecasts World Agricultural Outlook Board, Chairing Agency Economic Research Service Foreign Agricultural
Ag Outlook Webinar. Chris Hurt, Professor, Department of Agricultural Economics
 Ag Outlook Webinar Chris Hurt, Professor, Department of Agricultural Economics Michael Langemeier, Associate Director, Center for Commercial Agriculture James Mintert, Director, Center for Commercial Agriculture
Marketing Corn and Soybeans During the Growing Season Quarterly Zoom Marketing Meeting, June 13, 2018
 Marketing Corn and Soybeans During the Growing Season Quarterly Zoom Marketing Meeting, June 13, 2018 Dr. S. Aaron Smith Crop Marketing Specialist, Assistant Professor, and Extension Economist Department
Grains Outlook for 2014 SAEA Crops Outlook Organized Symposium Dallas, TX February 4, 2014
 Grains Outlook for 2014 SAEA Crops Outlook Organized Symposium Dallas, TX February 4, 2014 Dr. Nathan B. Smith (UGA) and Dr. Mark Welch (TAMU) Corn Corn Situation Record production. Leveling off of corn-starch
Market Outlook. David Reinbott.
 Market Outlook David Reinbott Agriculture Business Specialist P.O. Box 187 Benton, MO 63736 (573) 545-3516 http://extension.missouri.edu/scott/agriculture.aspx reinbottd@missouri.edu Trending Issues Pre-2007
Farming is a gamble, and 2018 looked like a year when soybean growers rolled snake eyes then doubled down and rolled them again.
 Take the money and run Good yields, forward sales and Sonny Money could mean a profit By Bryce Knorr, senior grain market analyst Farming is a gamble, and 2018 looked like a year when soybean growers rolled
Prospects for Corn Trade in 2018/19 and Beyond
 Prospects for Corn Trade in 2018/19 and Beyond Ben Brown Department of Agricultural, Environmental, and Development Economics The Ohio State University February 15, 2019 The agricultural industry is a
Commodity Outlook 2019: Corn and Soybeans Struggle to Find Strength
 Commodity Outlook 2019: Corn and Soybeans Struggle to Find Strength Wayne County 2019 Agricultural Outlook Ben Brown January 30, 2019 2018: A Tale of Two Halves January-May $4.00 corn and $10.50 soybean
Emerging Issues: Uncertainty in U.S. Ag Policy and Trade. Ohio Soybean Association- August 29, 2018 Ben Brown
 Emerging Issues: Uncertainty in U.S. Ag Policy and Trade Ohio Soybean Association- August 29, 2018 Ben Brown Most Common Questions The U.S. can sell more soybeans to other buyers, right? Example: would
Market Outlook. David Reinbott.
 Market Outlook David Reinbott Agriculture Business Specialist P.O. Box 187 Benton, MO 63736 (573) 545-3516 http://extension.missouri.edu/scott/agriculture.aspx reinbottd@missouri.edu Trending Issues Pre-2007
OUTLOOK FOR US AGRICULTURE
 Agricultural Outlook Forum 216 OUTLOOK FOR US AGRICULTURE Robert Johansson Chief Economist 25 February 216 Fig 2 Main themes for 216 1. The macroeconomy is weighing on trade, but there are reasons for
No lipstick for this pig USDA report bearish for soybeans -- period By Bryce Knorr, senior grain market analyst
 No lipstick for this pig USDA report bearish for soybeans -- period By Bryce Knorr, senior grain market analyst USDA s September reports were about as bearish for soybeans as you can get. A bigger than
Teucrium s Summary of the World Agricultural Supply and Demand Estimates for Corn, Wheat, and Soybeans
 Teucrium s Summary of the World Agricultural Supply and Demand Estimates for Corn, Wheat, and Soybeans 2018 WASDE Release Dates: June 12, 2018 Jan 12, Feb 8, Mar 8, Apr 10, May 10, Jun 12, Jul 12, Aug
Teucrium s Summary of the World Agricultural Supply and Demand Estimates for Corn, Wheat, and Soybeans
 Teucrium s Summary of the World Agricultural Supply and Demand Estimates for Corn, Wheat, and Soybeans 2018 WASDE Release Dates: February 8, 2018 Jan 12, Feb 8, Mar 8, Apr 10, May 10, Jun 12, Jul 12, Aug
Teucrium s Summary of the World Agricultural Supply and Demand Estimates for Corn, Wheat, and Soybeans
 Teucrium s Summary of the World Agricultural Supply and Demand Estimates for Corn, Wheat, and Soybeans 2018 WASDE Release Dates: April 10, 2018 Jan 12, Feb 8, Mar 8, Apr 10, May 10, Jun 12, Jul 12, Aug
Grain Market Outlook and Marketing Strategies
 Grain Market Outlook and Marketing Strategies Presented by: Brian Roach Dec 6 & 7, 2016 Roach Ag Marketing, Ltd. Disclaimer: Futures/options trading involves substantial risk of loss and trading may not
Teucrium s Summary of the World Agricultural Supply and Demand Estimates for Corn, Wheat, and Soybeans
 Teucrium s Summary of the World Agricultural Supply and Demand Estimates for Corn, Wheat, and Soybeans 2018 WASDE Release Dates: October 11, 2018 Jan 12, Feb 8, Mar 8, Apr 10, May 10, Jun 12, Jul 12, Aug
Teucrium s Summary of the World Agricultural Supply and Demand Estimates for Corn, Wheat, and Soybeans
 Teucrium s Summary of the World Agricultural Supply and Demand Estimates for Corn, Wheat, and Soybeans 2018 WASDE Release Dates: September 12, 2018 Jan 12, Feb 8, Mar 8, Apr 10, May 10, Jun 12, Jul 12,
World Agricultural Supply and Demand Estimates
 World Agricultural Supply and Demand Estimates Report of Interagency Commodity Estimates Committee Forecasts World Agricultural Outlook Board, Chairing Agency Economic Research Service Foreign Agricultural
Teucrium s Summary of the World Agricultural Supply and Demand Estimates for Corn, Wheat, and Soybeans
 Teucrium s Summary of the World Agricultural Supply and Demand Estimates for Corn, Wheat, and Soybeans 2018 WASDE Release Dates: July 12, 2018 Jan 12, Feb 8, Mar 8, Apr 10, May 10, Jun 12, Jul 12, Aug
Game Changers. Fundamental shifts Long term Impact
 Game Changers Fundamental shifts Long term Impact Over The Past Three Years The U.S. co-op system has been cut by more than 50%. The world s largest seed genetics and chemical firms have merged, cutting
Marketing Corn and Soybeans during the Growing Season: 2018 Outlook and Pricing Opportunities
 Marketing Corn and Soybeans during the Growing Season: 2018 Outlook and Pricing Opportunities Dr. S. Aaron Smith Assistant Professor, Crop Marketing Specialist, and Extension Economist Department of Agricultural
Crops Marketing and Management Update
 Crops Marketing and Management Update Department of Agricultural Economics Princeton REC Dr. Todd D. Davis Assistant Extension Professor -- Crop Economics Marketing & Management Vol. 2016 (3) March 9,
Grain and Cotton Economics. Mark Welch Extension Economist Grain Marketing (979)
") Grain and Cotton Economics Mark Welch Extension Economist Grain Marketing JMWelch@tamu.edu (979)845-8011 Marketing 2012, here we come! Tight supplies Grain Strong demand Yoked to outside markets 2012,
Grain and Cotton Economics Mark Welch Extension Economist Grain Marketing JMWelch@tamu.edu (979)845-8011 Marketing 2012, here we come! Tight supplies Grain Strong demand Yoked to outside markets 2012,
Cattle Market Situation and Outlook
 Cattle Market Situation and Outlook Rebuilding the Cow Herd Series March 28, 2007 Falls City, TX Coordinated by: Dennis Hale-Karnes CEA Ag & Charlie Pfluger-Wilson CEA Ag Prepared and presented by: Larry
Teucrium s Summary of the World Agricultural Supply and Demand Estimates for Corn, Wheat, and Soybeans
 Teucrium s Summary of the World Agricultural Supply and Demand Estimates for Corn, Wheat, and Soybeans 2019 WASDE Release Dates: February 8, 2019 Jan 11, Feb 8, Mar 8, April 9, May 10, Jun 11, Jul 11,
Teucrium s Summary of the World Agricultural Supply and Demand Estimates for Corn, Wheat, and Soybeans
 Teucrium s Summary of the World Agricultural Supply and Demand Estimates for Corn, Wheat, and Soybeans 2019 WASDE Release Dates: March 8, 2019 Jan 11, Feb 8, Mar 8, April 9, May 10, Jun 11, Jul 11, Aug
Crops Marketing and Management Update
 Crops Marketing and Management Update Vol. 2015 (10) December 14, 2015 Topics in this Month s Update: 1. December 9 th WASDE Update: Very Minor Adjustments Before January s Report 2. How do USDA s Production
March 2018 USDA SUPPLY/DEMAND ESTIMATES. Overview
 March 2018 USDA SUPPLY/DEMAND ESTIMATES Overview Corn: This month s 2017/18 U.S. corn outlook is for larger exports and increased corn used to produce ethanol. Corn used to produce ethanol was raised 50
World Agricultural Supply and Demand Estimates
 World Agricultural Supply and Demand Estimates Report of Interagency Commodity Estimates Committee Forecasts World Agricultural Outlook Board, Chairing Agency Economic Research Service Foreign Agricultural
Delmarva Feed Grain Overview and Forecast
 Delmarva Feed Grain Overview and Forecast 09/12/05 Delmarva Breeder, Hatchery and Grow Out Conference Salisbury, MD September 14, 2005 Marketing Sep 2005 Operating Organization Board of Directors Jim Perdue
Beef Cattle Outlook R. Curt Lacy, Ph.D. Extension Economist-Livestock University of Florida Beef Cattle Short Coourse
 Beef Cattle Outlook R. Curt Lacy, Ph.D. Extension Economist-Livestock 2012 University of Florida Beef Cattle Short Coourse MED. & LRG. #1 & 2 STEER CALF PRICES 400-500 Pounds, Georgia, Weekly $ Per Cwt.
FACTORS CREATING RISK IN U.S. GRAIN MARKETS
 FACTORS CREATING RISK IN U.S. GRAIN MARKETS WAY TOO EARLY GRAIN MARKET OUTLOOK TO 2050 22 ND NATIONAL WORKSHOP FOR DAIRY ECONOMISTS & POLICY ANALYSTS APRIL 30, 2015 JOHN NEWTON UNIV. OF ILLINOIS JCNEWT@ILLINOIS.EDU
LAGGING EXPORTS SLIGHTLY NEGATIVE TO CORN PRICES
 November 5, 2001 Ames, Iowa Econ. Info. 1825 LAGGING EXPORTS SLIGHTLY NEGATIVE TO CORN PRICES While current utilization projections show record corn use for the year ahead, the slow start for corn export
Corn & Soybeans. Corn (source WASDE) Soybean (source WASDE)
 Soybean (source WASDE)") Corn & Soybeans Corn (source WASDE) Estimate for the 2015-16 Season Global and US outlook Soybean (source WASDE) Estimate for the 2015-16 Season Global and US outlook Global ending stocks Corn and Soybeans
Corn & Soybeans Corn (source WASDE) Estimate for the 2015-16 Season Global and US outlook Soybean (source WASDE) Estimate for the 2015-16 Season Global and US outlook Global ending stocks Corn and Soybeans
Maize Average Monthly Price Trend
 EXECUTIVE SUMMARY: All maize cash markets traded firm during the month of September on the expectation of lower kharif crop production amid higher demand from south Indian feed makers as compared to last
2019 Grain Market Outlook
 2019 Grain Market Outlook Ness City, Kansas January 7, 2019 DANIEL O BRIEN EXTENSION AGRICULTURAL ECONOMIST Topics to be discussed.. 1) Macroconomic forces at work in the U.S. & where they are taking U.S.
Hog and Pork Situation and Outlook
 Hog and Pork Situation and Outlook September 3, 2013 Washington, Iowa Lee Schulz Department of Economics Iowa State University lschulz@iastate.edu (515) 294-3356 Feed Supply U.S. Corn Supply and Use 2009/10
August 10, USDA World Supply and Demand Estimates
 August 10, 2017 - USDA World Supply and Demand Estimates Corn Market Reaction: September 2017 corn futures closed down 15 cents at $3.57 ¼ with a trading range for the day of $3.56 ½ to $3.75 ½. December
December 12, USDA World Supply and Demand Estimates
 December 12, 2017 - USDA World Supply and Demand Estimates Corn Market Reaction: March 2018 corn futures closed down 1 ¼ cents at $3.47 ¾ with a trading range for the day of $3.47 ½ to $3.53. December
Steven D. Johnson. Presentation Objectives
 April 2014 Steven D. Johnson Farm & Ag Business Management Specialist (515) 957-5790 sdjohns@iastate.edu www.extension.iastate.edu/polk/farm-management Presentation Objectives Review the latest Corn &
Market Outlook & Price Projections: Corn, Wheat, Soy Complex & Palm Oil October 7 th, 2016
 Market Outlook & Price Projections: Corn, Wheat, Soy Complex & Palm Oil October 7 th, 2016 Patrick Sparks Global Risk Management, Inc. psparks@grmcorp.com 651-209-9503 www.grmcorp.com 1 Commodity trading
Hog and Pork Situation and Outlook
 Hog and Pork Situation and Outlook August 13, 2014 Lee Schulz Assistant Professor & Extension Livestock Economist Department of Economics Iowa State University lschulz@iastate.edu (515) 294-3356 2014 Midwest
2016 Economic Summit Iowa Farm Bureau Meat Export Outlook
 2016 Economic Summit Iowa Farm Bureau Meat Export Outlook Erin Borror USMEF Economist June 27, 2016 Des Moines USMEF s Global Offices and Representatives Membership Membership is comprised of nine sectors:
June 9, USDA World Supply and Demand Estimates
 June 9, 2017 - USDA World Supply and Demand Estimates Corn Market Reaction: July 2017 corn futures closed up 2 cents at $3.87 ¾ with a trading range for the day of $3.80 ¾ to $3.89 ½. December 2017 corn
Situation Analysis. Kathleen R. Brooks, Ph.D. Extension Livestock Economics Specialist
 Situation Analysis Kathleen R. Brooks, Ph.D. Extension Livestock Economics Specialist Department of Agricultural Economics University of Nebraska-Lincoln kbrooks4@unl.edu Agricultural Challenges More with
U.S. Ag Trade: Existing vs Emerging Markets. Ohio Grain Symposium Ben Brown December 18, 2018
 U.S. Ag Trade: Existing vs Emerging Markets Ohio Grain Symposium Ben Brown December 18, 2018 Today s Outline- Trade Policy Understanding the U.S. Trade Deficit Ohio Ag Trade World Soybean Impacts from
World Agricultural Outlook Board Interagency Commodity Estimates Committee Forecasts. May 9, 2014
 World Agricultural Outlook Board Interagency Commodity Estimates Committee Forecasts World Wheat Production Country or Region Million Tons 2014/15 World 714.0 697.0-2.4 United States 58.0 53.4-7.8 Foreign
Summary of WASDE and Production USDA
 Summary of WASDE and Production USDA The following information are summary and extracts from the latest, AUG 2016, WASDE and World Agricultural Production reports provided by the United States Department
Feed Grain Outlook. May 26, 2017 Volume 26, Number 29. Today s Newsletter Market Situation Crop Progress 1
 Today s Newsletter Market Situation Crop Progress 1 Grain Use 1 Outside Markets 5 Marketing Strategies Seasonality 7 2017 Feed Grain Marketing Plan 7 Upcoming Reports/Events 9 Market Situation Crop Progress.
Signs align for corn profit hopes Short crop in Brazil could be fix the market needs By Bryce Knorr, senior grain market analyst
 Signs align for corn profit hopes Short crop in Brazil could be fix the market needs By Bryce Knorr, senior grain market analyst Corn growers enjoyed an outbreak of optimism last week at Commodity Classic
Beef Cattle Outlook Dr. Curt Lacy Extension Economist-Livestock
 Beef Cattle Outlook Dr. Curt Lacy Extension Economist-Livestock Current Situation $ Per Cwt. 190 180 170 160 150 140 130 120 110 100 90 MED. & LRG. #1 & 2 STEER CALF PRICES 500-600 Pounds, Georgia, Weekly
Crops Marketing and Management Update
 Crops Marketing and Management Update Grains and Forage Center of Excellence Dr. Todd D. Davis Assistant Extension Professor Department of Agricultural Economics Vol. 2016 (10) October 16, 2016 Topics
Morning Comments
 Next USDA Reports: Friday April 8, 2011 WASDE & Crop Production Position Management: The table shows how the Model Farm is positioned at this time. Individual recommendations may vary. 2010 Crop 2011 Crop
May 10, USDA World Supply and Demand Estimates
 May 10, 2018 - USDA World Supply and Demand Estimates Corn Market Reaction: July 2018 corn futures closed down ¾ cent at $4.02 with a trading range for the day of $4.00 to $4.07. December 2018 corn futures
2016 Risk and Profit Conference General Session Speakers. GENERAL SESSION IV Grain Market Situation and Outlook
 2016 Risk and Profit Conference General Session Speakers GENERAL SESSION IV Grain Market Situation and Outlook Dan O Brien, Kansas State University Daniel O Brien was raised on a grain and livestock farm
Santa Claus rally could help corn Be ready to sell brief rallies when they come By Bryce Knorr, senior grain market analyst
 Santa Claus rally could help corn Be ready to sell brief rallies when they come By Bryce Knorr, senior grain market analyst Rallies are always possible in corn, even in down markets. Trouble is, they don
Commodity Outlook: September 2017 West Central Illinois: July 2017
 Commodity Outlook: September 2017 West Central Illinois: July 2017 William George Senior Agriculture Economist U.S. Department of Agriculture Foreign Agriculture Service Office of Global Analysis Commodity
January 12, USDA World Supply and Demand Estimates
 January 12, 2017 - USDA World Supply and Demand Estimates Corn This month s U.S. corn outlook is for lower production, reduced feed and residual use, increased corn used to produce ethanol, and smaller
2018 Corn & Soybean Market Outlook & Strategies Home, Kansas
 2018 Corn & Soybean Market Outlook & Strategies Home, Kansas DANIEL O BRIEN EXTENSION AGRICULTURAL ECONOMIST Topics to be discussed.. 1) Grain Market Analysis & Outlook for 2018 Corn & Grain Sorghum Soybeans
World Sorghum Grain Producers
 World Sorghum Grain Producers Million Metric Tons 18 16 14 12 12 10 8 6 7 7 6 6 4 4 4 3 2 2 2 2 0 14 MY 2014/15 MY 2015/16 MY 2016/17 Grain Sorghum Exporters Million Metric Tons 10 9 8 7 6 5 4 3 2 1 0
January 12, USDA World Supply and Demand Estimates
 January 12, 2018 - USDA World Supply and Demand Estimates Corn Market Reaction: March 2018 corn futures closed down 2 ½ cents at $3.46 ¼ with a trading range for the day of $3.45 ½ to $3.50. December 2018
SOYBEANS: LOW PRICES TO PERSIST
 SOYBEANS: LOW PRICES TO PERSIST JANUARY 2002 Darrel Good 2002 - NO. 2 Summary Soybean prices received some support from the USDA s January 11 final U.S. production estimate for the 2001 crop. At 2.891
Soybean Supply and Demand Forecast
 Soybean Supply and Demand Forecast U.S. soybean planted acreage is expected to increase 5.7 million acres over the forecast period. U.S. soybean yields are expected to increase 2.2 bushels per acre or
Morning Comments
 Position Management: The table shows how the Model Farm is positioned at this time. Individual recommendations may vary. 2010 Crop 2011 Crop 2012 Crop Corn 100% sold with basis set 50% sold HTA 30% sold
World Agricultural Outlook Board Interagency Commodity Estimates Committee Forecasts. Lockup Briefing July 11, 2014
 World Agricultural Outlook Board Interagency Commodity Estimates Committee Forecasts Lockup Briefing World Wheat Production Country or Region estimate 2014/15 forecast June 11 Million Tons Percent Percent
Revenue Components. Yield Government Programs Crop Insurance
 Farm Financial Conditions 25th Annual Crop Insurance Conference January 22, 2018 Fargo, ND Andrew Swenson Extension Farm Management Specialist Department of Agribusiness and Applied Economics North Dakota
World Agricultural Outlook Board Interagency Commodity Estimates Committee Forecasts. Lockup Briefing April 9, 2014
 World Agricultural Outlook Board Interagency Commodity Estimates Committee Forecasts Lockup Briefing World Wheat Production Country or Region Million Tons World 656.5 712.5 8.5 United States 61.7 58.0-6.0
USDA Agricultural Outlook
 USDA Agricultural Outlook December 216 World Agricultural Outlook Board Office of the Chief Economist U.S. Department of Agriculture Washington, D.C. The Office of the Chief Economist is Non Political
Crops Marketing and Management Update
 Crops Marketing and Management Update Grains and Forage Center of Excellence Dr. Todd D. Davis Assistant Extension Professor Department of Agricultural Economics Vol. 2017 (4) April 18, 2017 Topics in
SOUTH AMERICAN SOYBEAN CROP ESTIMATE INCREASED
 April 14, 2000 Ames, Iowa Econ. Info. 1787 SOUTH AMERICAN SOYBEAN CROP ESTIMATE INCREASED USDA s World Agricultural Outlook Board raised its estimate of combined Brazilian and Argentine soybean production
September 12, USDA World Supply and Demand Estimates
 September 12, 2018 - USDA World Supply and Demand Estimates Corn Market Reaction: December 2018 corn futures closed down 14 ¼ cents at $3.52 ½ with a trading range for the day of $3.50 ¾ to $3.66 ¼. December
Corn & Soybeans. Corn (source WASDE) Soybeans (source WASDE)
 Soybeans (source WASDE)") Corn & Soybeans Corn (source WASDE) Estimate for the 2014-15 Season Global and US outlook Production, utilization and stocks Soybeans (source WASDE) Estimate for the 2014-15 Season Global and US outlook
Corn & Soybeans Corn (source WASDE) Estimate for the 2014-15 Season Global and US outlook Production, utilization and stocks Soybeans (source WASDE) Estimate for the 2014-15 Season Global and US outlook
Fall Crop Outlook Webinar
 Fall Crop Outlook Webinar Chris Hurt, Professor, Department of Agricultural Economics Michael Langemeier, Associate Director, Center for Commercial Agriculture James Mintert, Director, Center for Commercial
State of U.S. Soybean Crushing Industry AG Supply Chain Asia 2018
 State of U.S. Soybean Crushing Industry AG Supply Chain Asia 2018 Thomas Hammer, President National Oilseed Processors Association Surabaya, Indonesia March 20-22, 2018 NOPA Members 13 NOPA member companies
Steve Freed Vice President ADMIS Research
 Steve Freed Vice President ADMIS Research Futures and options trading involve significant risk of loss and may not be suitable for everyone. Therefore, carefully consider whether such trading is suitable
Jeanne Reeves Cotton Incorporated June 4, 2013
 Jeanne Reeves Cotton Incorporated June 4, 2013 Cotton Incorporated s mission is to increase the demand for and profitability of cotton through research and promotion. Market Notes 2011, highest prices
Wednesday July 11, 2012 World Ag Supply & Demand Report
 World Ag Supply & Demand Report U.S. 2011/12 Old Crop Corn is neutral Global Old Crop Corn is neutral USDA estimates the 2011/12 U.S. corn carryout at 903 million bushels, up from 851 million bushels from
SOYBEANS: HIGHEST PRICES IN OVER SEVEN YEARS. January 2004 Darrel Good 2004 NO. 2
 SOYBEANS: HIGHEST PRICES IN OVER SEVEN YEARS January 2004 Darrel Good 2004 NO. 2 Summary At 2.418 billion bushels, the 2003 U.S. soybean crop was 34 million bushels smaller than the USDA s November forecast
PRX Grain Market Overview
 PRX The ProExporter Network Grain, Oilseed & Biofuel Fundamentals Updated 4/1/18 PRX Grain Market Overview US Major Grains Crop Years 217/18 & 218/19 with USDA Apr 1, 218 WASDE PRX_Overview, SDU, Apr-1-18
Can corn market think for itself? Fundamentals say prices should be higher By Bryce Knorr, senior grain market analyst
 Can corn market think for itself? Fundamentals say prices should be higher By Bryce Knorr, senior grain market analyst When supply and demand talk, markets are supposed to listen. But sometimes it can
SOYBEANS: AN EARLY WEATHER MARKET
 SOYBEANS: AN EARLY WEATHER MARKET January 2000 Darrel Good Summary 1999 U.S. Crop Estimate Revised Lower Soybean prices have made a modest rally from the mid-december lows, fueled by areas of dry weather
Crops Marketing and Management Update
 Crops Marketing and Management Update Department of Agricultural Economics Princeton REC Dr. Todd D. Davis Assistant Extension Professor -- Crop Economics Marketing & Management Vol. 2015 (7) September
Corn & Soybeans. Corn (source WASDE) Soybean (source WASDE)
 Soybean (source WASDE)") Corn & Soybeans Corn (source WASDE) Estimate for the 2016-17 Season Global and US outlook Soybean (source WASDE) Estimate for the 2016-17 Season Global and US outlook Corn and Soybeans prices (Source CME)
Corn & Soybeans Corn (source WASDE) Estimate for the 2016-17 Season Global and US outlook Soybean (source WASDE) Estimate for the 2016-17 Season Global and US outlook Corn and Soybeans prices (Source CME)
Is that it for 2018 corn rally? Demand is good, but gains depend on weather By Bryce Knorr, senior grain market analyst
 Is that it for 2018 corn rally? Demand is good, but gains depend on weather By Bryce Knorr, senior grain market analyst July weather is usually the key metric for determining corn yields, and most years,