Changing Dynamics of Tropical Deforestation and Atmospheric Carbon: Science Meets Policy PLEASE DO NOT USE GRAPHICS WITHOUT PERMISSIONS
|
|
|
- Randolph Cummings
- 5 years ago
- Views:
Transcription
1 Changing Dynamics of Tropical Deforestation and Atmospheric Carbon: Science Meets Policy R. DeFries, University of Maryland College Park Michigan State University, March 18, 2008
2 Collaborators G. Van der Werf, Vrije University, The Netherlands D. Morton, University of Maryland College Park Y. Shimabukuro, INPE G.J. Collatz, Goddard Space Flight Center J. Randerson, University of California Irvine P. Kasibhatla, Duke University S. Trigg, University of Cranfield J. Dempewolf, University of Maryland M. Hansen, South Dakota State University F. Achard, Joint Research Center M. Hansen, South Dakota State University N. Ramankutty, McGill University R. Houghton, Woods Hole Research Institute With funding from NASA LCLUC, LBA, and TE programs
3 PROPORTION OF LANDSCAPE FOREST COVER Greenhouse gases: wildlands frontier clearings Carbon dioxide Amazon countries Indonesia subsistence and small-scale farms India protected/ recreational lands urban settlements Costa Rica China intensive agriculture Methane, nitrous oxide 0 Pre-settlement Frontier Subsistence Intensifying Intensive STAGE IN LAND USE TRANSITION (From Mustard et al., 2004; DeFries et al, 2004; Foley et al., 2006)
 (from")
4 Historical Estimates of Carbon Emissions ( ) (from Houghton, WHRC)
5 UN FRAMEWORK CONVENTION ON CLIMATE CHANGE INCLUDED REDUCING EMISSIONS FROM DEFORESTATION AND DEGRADATION (REDD) IN BALI ROADMAP
6 Estimates of carbon emissions from deforestation are highly uncertain 1980 s (PgC/yr) 1990 s (PgC/yr) Spatial coverage Method for area Method for carbon flux Houghton (2003) Global, 9 regions FAO and inventories Bookkeeping Fearnside (2000) Pan-tropic, 6 regions FAO and inventories Bookkeeping McGuire et al (2001) DeFries at al (2002) Achard et al (2004) Global Cropland change Ecosystem models 0.6 ( ) 0.9 ( ) Pan-tropics AVHRR Bookkeeping ± 0.3 Pan-tropics, sample Landsat Bookkeeping Houghton et al (2000) Amazon Landsatderived Bookkeeping Fearnside (1997) Brazilian Amazon Landsatderived Bookkeping, committed flux Potter et al (2001) Van der Werf et al (2003) Legal Amazon Satellitederived fire fires decomposition ( ) Tropics and subtropics Satellitederived fire Fire emission and ecosystem model, gross flux Fire emission and ecosystem model, gross flux

7 C emissions = initial loss + respiration uptake in regrowth Annual balance vs committed flux approach (Ramankutty et al, 2006)

8 WHAT TOOLS ARE AVAILABLE FOR MONITORING DEFORESTATION AREA? LANDSAT like sensors MODIS AVHRR Spatial resolution 30m 250m - 1km 8km Repeat frequency 16 days daily daily Size of scene/tile 185x185 km 1000x1000km Global and subsets Length of record 1970 s present? intermittent present present
 1.8 1.6 1.4 1.2 1 0.8 0.6 0.4 0.2 0 1980 s 1990 s.6 (.3-.8).9 (.5-1.4) 1.7 (.6-2.5) 1980's 1990's 1.6 (.8-2.4).96 Circa 1980 Latin America Tropical Asia Africa Total Tropics IPCC Achard et al.")
9 Deforestation in South America derived from AVHRR data ( ) Estimated Carbon Flux from Tropical Deforestation and Regrowth based on Satellite Observations for Annual net carbon flux (Pg/yr) s 1990 s.6 (.3-.8).9 (.5-1.4) 1.7 (.6-2.5) 1980's 1990's 1.6 (.8-2.4).96 Circa 1980 Latin America Tropical Asia Africa Total Tropics IPCC Achard et al., 2002 Circa 1990 Tree cover (DeFries et al., PNAS, 2002: Hansen and DeFries, Ecosystems, 2004) Circa % 100%


10 CHANGING DYNAMICS IN 2000 s REFLECTED IN SPATIAL PATTERNS OF MODIS-DERIVED % TREE COVER AND FIRE EVENTS 2001 Tree cover 0% 100% active fire


11 Brazil could increase its total cultivated land area by 170 million ha if key legal, technical, and financial developments occur without any new deforestation in the Amazon basin. USDA 2003 (Naylor et al., 2005) PRIMARY Forest SECONDARY Pasture Cropland
12 CHANGING LAND USE DYNAMICS IN IN MATO GROSSO: TRACKING WITH MODIS 250m DATA PRIMARY SECONDARY Pasture Forest Cropland NDVI x 10, Time Series, Quality flag adjusted B1 B4 B7 B10 B13 B16 B19 B22 B25 B28 B31 B34 B37 B40 B43 B46 B49 B52 B55 B58 B61 B64 B67 B70 B73 B76 B79 B82 Cropland Expansion 16-day Periods ( to ) Deforestation Forest Not in Production 3,609 km Conversion Agriculture Forest Pasture Cerrado Crop 5,770 km 2 Pasture Crop 5,930 km 2 Forest Crop 4,670-5,463 km 2 Forest Pasture 23,463 km 2 (Morton et al., PNAS, 2006) Forest Small (<25ha) 5,562 km 2
13 km Year of Deforestation Brazilian Reais (R$) per 60 kg Soy Small (<25 ha) Pasture yr 2+ Pasture yr 1 Not in Production Crop yr 2+ Crop yr 1 Soy Price 100% 90% 80% POST CLEARING LAND USE IN MATO GROSSO n=2551 n=1475 n=990 n=671 n=340 Conversion dynamics by post-clearing land cover for deforestation events >25 ha in Mato Grosso State, Brazil from satellitebased phenology information: Clearing for mechanized cropland is associated with soy price 70% 60% 50% 40% 30% 20% 10% (Morton et al., PNAS, 2006) Fate of 2003 deforestation events by clearing size: Large clearings are associated with cropland 0% Hectares


14 IMPLICATIONS FOR CARBON EMISSIONS: VARYING AMOUNTS OF REMAINING BIOMASS FROM LAND USES FOLLOWING DEFORESTATION 1 % Deforestation Events NYIP Pasture Cropland Maximum Fire Days Forest to pasture Forest to crop Conversions of forest to cropland exhibit higherfrequency of MODISdetected fires than pasture conversions Pasture to crop Not in production (Morton et al., in press)

15 DECAF MODEL TO ESTIMATE GROSS CARBON FLUXES FROM DEFORESTATION FIRES AT 250m MODIS RESOLUTION LAND USE FOLLOWING DEFORESTATION FROM MODIS MODIS ACTIVE FIRES CASA LANDSAT-BASED DEFORESTATION BURN SCARS FROM PASTURE MAINTENANCE FIRES C EMISSIONS FROM FIRE C t = A t A=burned area E=combustion completeness M=mortality rate D=detritus B=biomass F=fuelwood d b E d D t,d + E b M b B t,b + E F F
16 Observation #1: Conversion fires are <50% of area but >80% of emissions 100% Percent area 80% 60% 40% 20% 0% NON-FOREST CONVERSION FOREST CONVERSION MAINTENANCE Percent C emissions 100% 80% 60% 40% 20% 0% NON-FOREST CONVERSION FOREST CONVERSION MAINTENANCE
17 Observation #2: Small deforestation events contribute little to overall emissions FRACTION IN SMALL CLEARING (<25ha) OF DEFORESTATION POLYGONS OF DEFORESTED AREA OF EMISSIONS


18 Observation #3: Emissions occur from deforestation fires over multiple years 2002 Deforestation 2,500 ha, 79 fire detections detections detections detections 4 km EMISSIONS (Tg C/yr) CARRYOVER FROM CLEARING IN PREVIOUS YEARS INITIAL YEAR OF CLEARING PLEASE DO NOT USE GRAPHICS WITHOUT 0.0 PERMISSIONS FRACTION OF ANNUAL EMISSION
19 Observation #4: Emissions are not proportional to area and depend on land use transition type % CROPLAND OF ALL FOREST CONVERSION EMISSIONS CONVERTED AREA Emissions from forest to cropland transition are in larger proportion than converted area EMISSIONS 100 CONVERTED AREA % FOREST OF ALL CROPLAND CONVERSION Secondary transition from pasture to cropland contributes substantial emissions
20 DECAF COMPARED WITH BOOKKEEPING APPROACH FOR MATO GROSSO COMMITTED CARBON FLUX (Tg C/yr) COMMITTED CARBON FLUX (Tg/yr) FOREST TO PASTURE 0 FOREST TO CROPLAND DECAF INITIAL DECAF RESPIRATION BOOKKEEPING INITIAL BOOKKEEPING RESPIRATION 2001 to to to to to to to to DECAF AVERAGE 5 YEAR COMMITTED C FLUX (Tg/yr) FOREST TO CROPLAND FOREST TO PASTURE BOOKKEEPING INITIAL DEFORESTATION EMISSIONS + 5-YR COMMITTED RESPIRATION
21 DECAF COMPARED WITH GLOBAL FIRE EMISSIONS DATA (GFED) FOR MATO GROSSO DECAF GFED Tg C/yr GFED DECAF (defor + maintenance) Mean annual emission (TgC/yr) GFED DECAF DEFORESTATION FIRE EMISSIONS + PASTURE MAINTENANCE FIRES GFED from
22 Conclusions from High Resolution Analysis Clearing for mechanized production requires new methods for estimating carbon fluxes Multiple methods lead to similar estimates for 5- year aggregated emissions Need to include land use transitions and multiyear fires for accurate interannual variability and attribution to land use actors Scaling up to pan tropics remains a challenge
23 SCALING TO PAN TROPICS FOR 2000 s DEFORESTATION HOTSPOTS FIRE EMISSIONS AEROSOL OPTICAL DEPTH MOPITT CO
24 WHICH LAND USE TRANSITION TYPES ARE CONTRIBUTING EMISSIONS? Percent of total LEGAL AMAZON ( ) < >100 size of clearing (ha) number of deforestation events deforested area HALF OF AREA DEFORESTED IN BRAZILIAN AMAZON OCCURS IN LESS THAN 5% OF CLEARINGS (data from INPE)


25 IS SOY EXPANSION PUSHING CATTLE RANCHING FURTHER INTO FRONTIER? PASTURE SOY Census data compiled by R. Walker, Michigan State U


26 IS THERE A POSITIVE FEEDBACK BETWEEN DROUGHT AND CLEARING? Number of MODIS fire detections (active fires through Nov 1, 2007)

27 DEFORESTATION INCREASED IN 2007 IN BRAZIL BBC News, Jan 24, 2008

28 THE POLICY PERSPECTIVE INTERGOVERNMENTAL PANEL ON CLIMATE CHANGE FOURTH ASSESSMENT REPORT Large range in estimates of carbon flux from tropical land use change

29 Reference: DeFries, Achard, Brown, Herold, Murdiyarso, Schlamadinger, De Souza, Reducing GHG Emissions from Deforestation in Developing Countries: Considerations for Monitoring and Measuring. Report of the Global Terrestrial Observing System (GTOS) # 46, 23 p. Available at:
30 Carbon stock estimates and dynamics more uncertain but existing IPCC guidelines can be applied Bottom Line Conclusions on Technical Aspects of REDD Various methods are available and appropriate to measure change in forest cover at national level Caveat: constraint of access to high resolution data and national capacity for analysis National examples exist Forest degradation important but more challenging

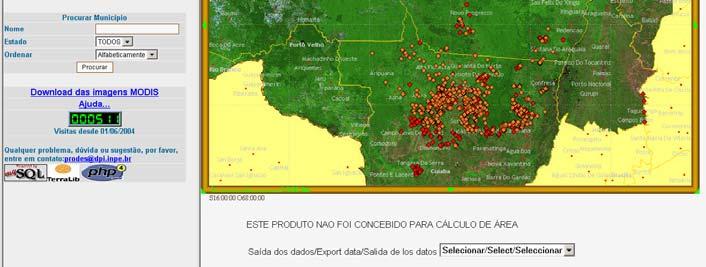
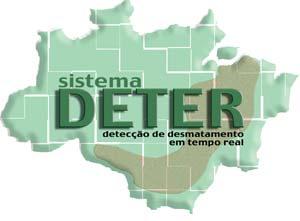
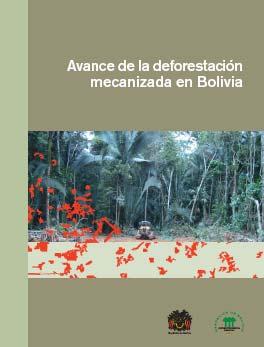
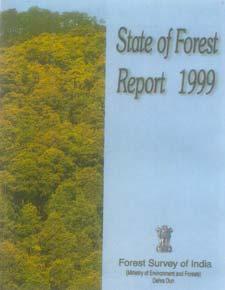
31 Some national forest monitoring systems are in place in tropical countries
32 PROPORTION OF LANDSCAPE - Should forest degradation be included in REDD? - Should countries get credit for reforestation and afforestation? - What is the baseline reference period? - Market mechanism or fund? - How to ensure permanence? - How to ensure against international leakage? - How to promote co-benefits? - How to ensure equitable distribution of benefits from REDD? FOREST COVER wildlands Amazon countries Indonesia frontier clearings subsistence and small-scale farms India protected/ recreational lands urban settlements Costa Rica China intensive agriculture 0 Pre-settlement Frontier Subsistence Intensifying Intensive STAGE IN LAND USE TRANSITION
33 Conclusions Changing dynamic towards mechanized production increasing per area C emissions from deforestation Open science questions Feedbacks Relative contributions of deforestation actors Scaling to pan tropics Policy challenges for REDD but technically feasible
34 SELECTED PUBLICATIONS DeFries, R., et al. (2007), Reducing greenhouse gas emissions from deforestation in developing countries: Considerations for monitoring and measuring, Environmental Science and Policy, 10, DeFries, R., et al. (2005), Monitoring tropical deforestation for emerging carbon markets, in Tropical Deforestation and Climate Change, edited by P. Mountinho and S. Schwartzman, pp , IPAM and Environmental Defense, Belem, Brazil and Washington, DC. DeFries, R., et al. (2002), Carbon emissions from tropical deforestation and regrowth based on satellite observations for the 1980s and 90s, Proceedings of the National Academy of Sciences, 99, Morton, D., et al. (in press), Agricultural intensification increases deforestation fire activity in Amazonia, Global Change Biology. Morton, D., et al. (in press), Cropland expansion in cerrado and transition forest ecosystems: Quantifying habitat loss from satellite-based vegetation phenology, in Cerrado Land Use and Conservation, edited by C. Klink, et al., Advances in Applied Biodiversity Science, Conservation International, Washington, D.C. Morton, D., et al. (2006), Cropland expansion changes deforestation dynamics in the southern Brazilian Amazon, Proceedings of the National Academy of Sciences, 103, Morton, D., et al. (2005), Rapid assessment of annual deforestation in the Brazilian Amazon using MODIS data, Earth Interactions, 9, 1-22.
35 THANK YOU
36