Maps to Help You Protect and Manage Lands: The Revised Wildlife Action Plan Maps. Emily Preston, Wildlife Biologist Katie Callahan, GIS specialist
|
|
|
- Ralf Perry
- 5 years ago
- Views:
Transcription


1 Maps to Help You Protect and Manage Lands: The Revised Wildlife Action Plan Maps Emily Preston, Wildlife Biologist Katie Callahan, GIS specialist


2 What is the Wildlife Action Plan? Restore rare wildlife and habitats. Keep common species common.


3 2015 Revision: Species and Habitats 169 Species 27 Habitats Current status and threats were assessed for each one. See Appendices A and B.


4 2015 Revision: Partners in Conservation Science

5 2015 Revision: Public Participation Engagement Sessions 166 Participants 79 Communities Online Survey 1,142 respondents Public Comment Period 123 comments

6 2015 Revision: Action! There are actions for everyone to do


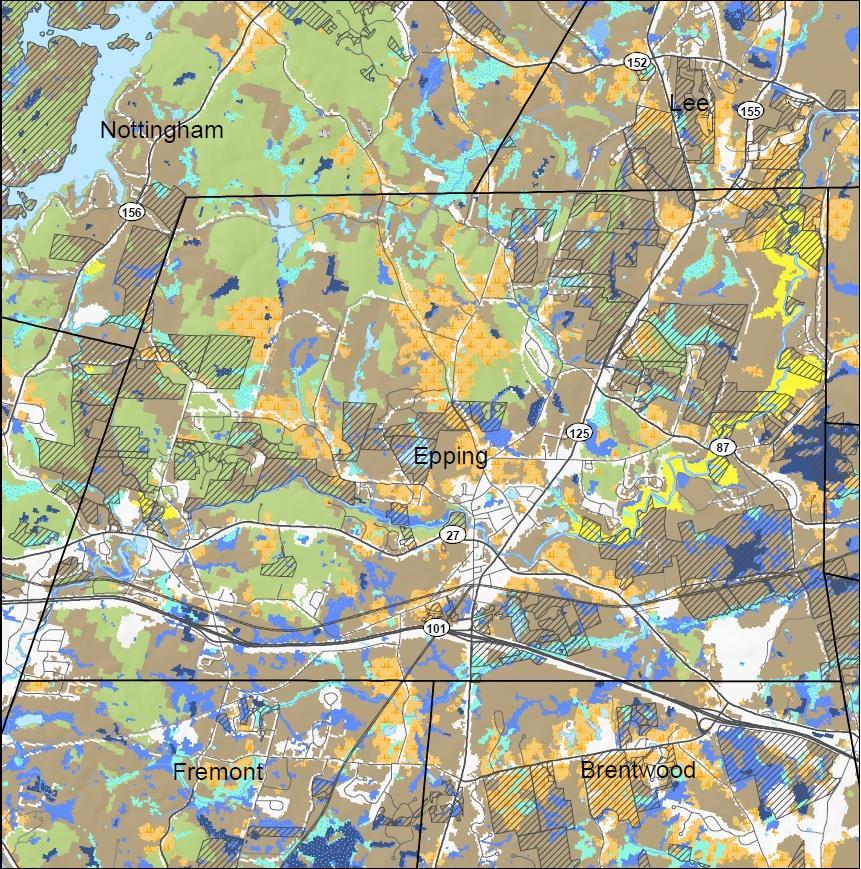
7 Wildlife Action Plan Maps Wildlife Habitat Land Cover Highest Ranked Wildlife Habitat by Ecological Condition


8 Habitat Mapping Potential Existing Condition

9 Northeastern Terrestrial Habitat Classification System (TNC, 2015) A flexible framework for characterizing wildlife habitat that works on two levels 1. Habitat systems 2. Structural modifiers Habitat system correspond to the ecological system units developed by NatureServe, with additional systems for altered habitats and land use types. Result: 143 habitat systems in the northeast, 40 in NH alone
 for species across a range of animal taxonomic groups, usually at some broad")
10 Northeast Terrestrial Habitat (NETH) TNC 2015 Habitat classification is the logical, repeatable grouping of ecological elements that approximate basic cover and context (space and surroundings) for species across a range of animal taxonomic groups, usually at some broad spatial scale.


11 Crosswalk TNC Terrestrial habitat to NH WAP habitat TNC HABITAT NH WAP Open Water (NLCD-NHD open water) Open Water Atlantic Coastal Plain Beach and Dune Dune North Atlantic Coastal Plain Maritime Forest Appalachian oak-pine North Atlantic Coastal Plain Hardwood Forest Appalachian oak-pine North Atlantic Coastal Plain Tidal Salt Marsh Salt marsh Acadian Sub-boreal Spruce Flat Lowland spruce-fir Acadian-Appalachian Montane Spruce-Fir-Hardwood Forest High-elevation spruce-fir Acadian-Appalachian Alpine Tundra Alpine Acidic Cliff and Talus Cliff and Talus Calcareous Cliff and Talus Cliff and Talus Acidic Rocky Outcrop Rocky ridge Calcareous Rocky Outcrop Rocky ridge Acadian-North Atlantic Rocky Coast Coastal island Boreal-Laurentian-Acadian Acidic Basin Fen Peatland Laurentian-Acadian Alkaline Fen Peatland Laurentian-Acadian Large River Floodplain Floodplain forest Northeastern Interior Pine Barrens Pine barren Central Appalachian Dry Oak-Pine Forest Appalachian oak-pine Central Appalachian Pine-Oak Rocky Woodland Rocky ridge Acidic Cliff and Talus Cliff and Talus Central Appalachian Alkaline Glade and Woodland Rocky ridge
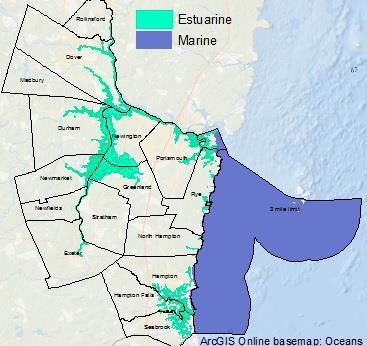
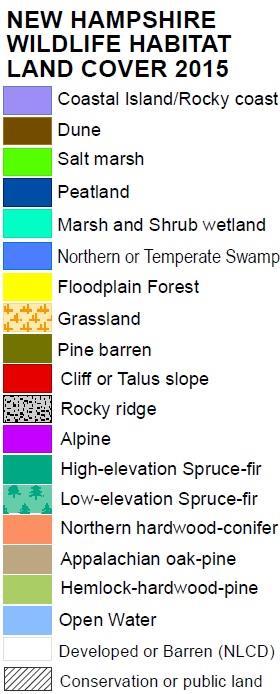
12 27 Key Habitat Types Forest High Elevation Spruce-Fir Forest Low Elevation Spruce-Fir Forest Northern Hardwood-Conifer Forest Hemlock-Hardwood-Pine Forest Appalachian Oak-Pine Forest Other Terrestrial Habitats Pine Barrens Grasslands Shrublands Alpine Rocky Ridge, Cliff, and Talus Cave Mines and Other Subterranean Not mapped, but potential NLCD or LANDFIRE source Mapped, but sensitive habitat, Do not distribute Freshwater Wetland Floodplain Forests Vernal Pools Northern Swamps Temperate Swamps Peatlands Marsh and Shrub Wetlands Not mapped VT model using LiDAR? Freshwater Aquatic Large Warmwater Rivers Warmwater Rivers and Streams Coldwater Rivers and Streams Warmwater Lakes and Ponds Lakes and Pond with Coldwater Habitat Coastal: Salt Marsh, Dunes, Coastal Islands, Estuarine, Marine
13 Terrestrial Habitat Modifications 1. Add NWI update 2. Add SLAMM salt marsh 3. Add TNC pine barrens 4. Use 2005 Peatlands 5. Add 2005 Dunes 6. Add 2005 Coastal islands 7. Select swamps added to large river floodplains

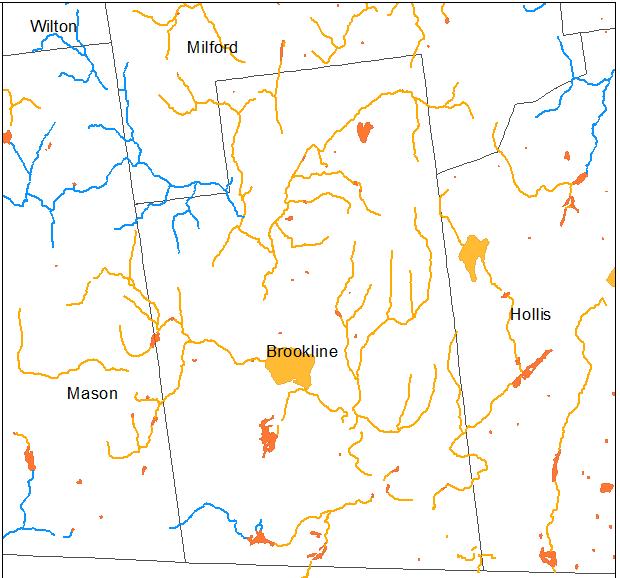
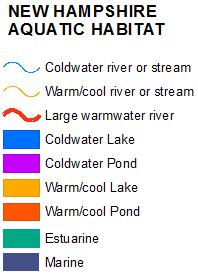
14 Freshwater Aquatic Habitat Northeastern Aquatic Habitat Classification System TNC: Eastern Div. new data coming end of 2015


15 Preliminary Stream and River Classification (TNC 100k NH 24k) Stream Size Temperature Gradient Geology - buffering

16 Used a coldwater model created by NH Department of Environmental Services and NHFG fish species occurrence data to reclassify temperatures more suitable for our northern location. NH Customization

17 Preliminary Pond and Lake Classification (TNC 100k NH 24k) NHFG cold water classification of lakes/ponds: 1. Lake Trout pond 2. Holdover EBT pond 3. Potential naturally reproducing EBT pond 4. Remote pond 5. Pond above 1900 ft elevation

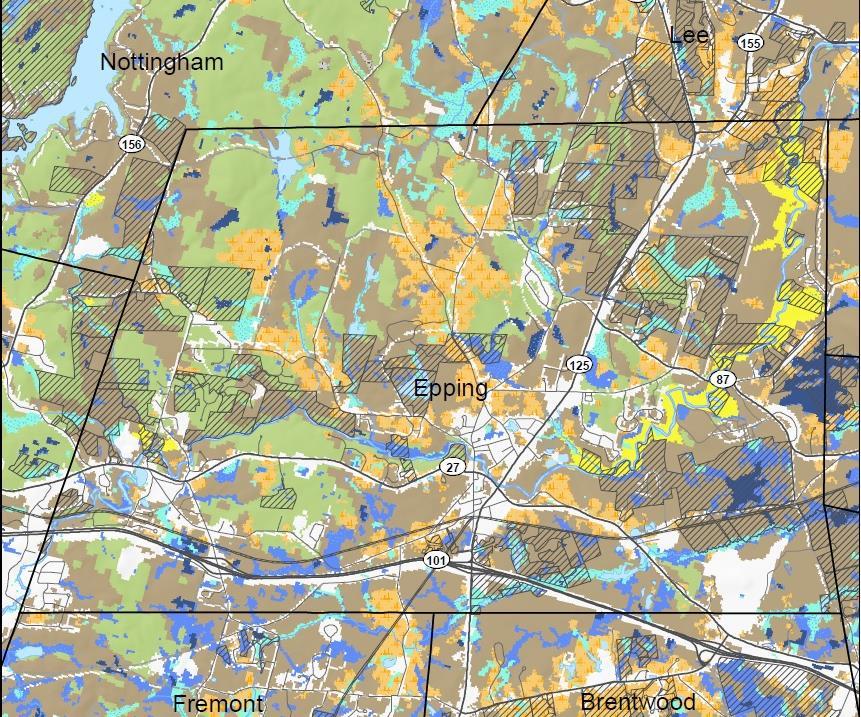
18 Habitat Mapping Terrestrial Freshwater
19
20
21 Habitat Condition Analysis Changes are due to Different underlying habitat layer More data on rare wildlife occurrences Use of better condition data
22 Habitat Condition Biological Diversity Landscape Integrity Minimum Human Impact COND = (BIO + LAND + HUMAN) / 3


23 What is a Biological Region? Matrix forest and small/patch habitats Wetlands and floodplain forest
24 BIO Biological Diversity Species richness of rare animals within polygon Species richness of rare animals within their dispersal distances from the polygon Species richness of rare plants in polygon Richness of rare and exemplary natural communities in polygon Vertebrate species richness (VT/NH GAP Analysis)

25 Regional Geospatial Condition Data is available for other analyses at a northeast regional scale or any smaller scale.
26 LAND Landscape Integrity Area (size of patch in hectares) Local Connectedness (TNC) Landscape Complexity (TNC) Similarity Unfragmented block size Number of wetlands in complex Largest wetland in the complex Vegetative richness (# dominant NWI veg classes)
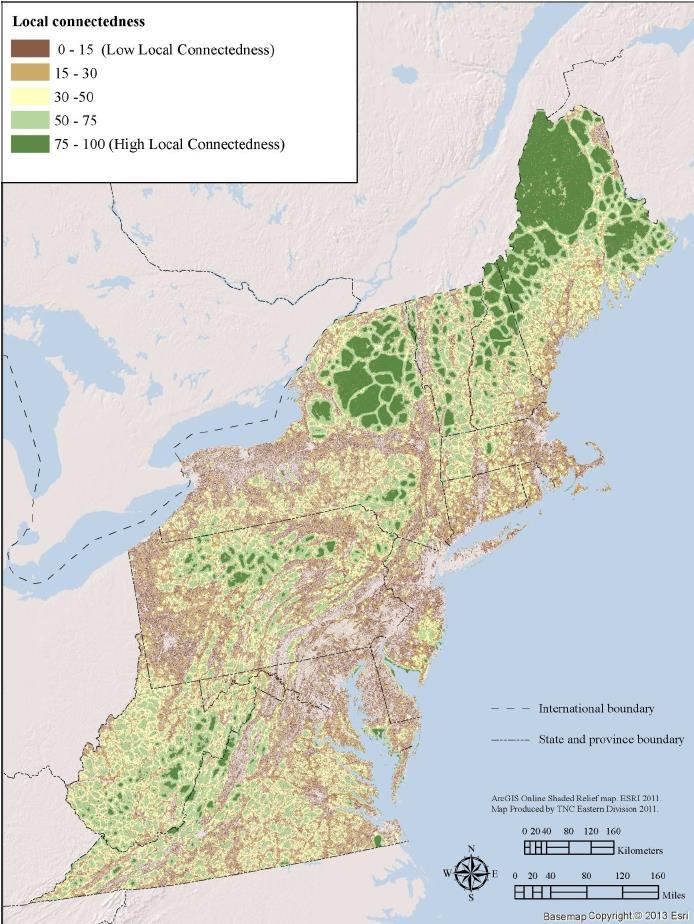
27 Local Connectedness (TNC 2013) An estimate of the degree of permeability surrounding each cell in the region. TNC summarized this metric into a habitat connectedness index, as a measure of landscape structure: the hardness of barriers, the connectedness of natural land cover, and the arrangement of land uses. A simplified land cover map, aggregated to a 90m cell size, was assigned resistance weights, lowest weight to natural land cover and highest weight to developed land. Roads were overlaid and added 10 points of resistance. A resistant kernel algorithm was applied (introduced by Compton et al. 2007)

28 Local Connectedness (TNC 2013)

29 Local Connectedness (TNC 2013) Area under the circle has an average score of: A pristine area would score 100
30
31 Landscape Complexity (TNC 2013) An estimate of the number of micro-climates in a 100 acre area surrounding each cell of habitat, based on variety of landforms, the elevation range, and the density of wetlands. The variety of landforms was the factor most directly related to the number of microclimates based on the current literature, and twice the weight was given to this factor in the combined score: Landscape Complexity= Flats (2*LV + 1* ER + 1 WD)/4) + Slopes (2*LV + 1* ER/3) Where LV = landform variety, ER = elevation range, and WD = wetland density.

32 Landscape Complexity (TNC 2013)
33 HUMAN Human Impacts Index of Ecological Integrity (UMass) Road density, distance to nearest road/trail EAME (UMass Eastern Meadowlark Landscape Capability) Ecological Integrity scores (NHDES wetland assessment) water quality degradation human activity Percent of drainage area that is impounded Distance to nearest dam
34 Index of Ecological Integrity (UMass 2015) The ability of an area to sustain ecological functions over the long term. An ecosystem-based assessment of ecological integrity, which is a measurement of relative intactness (the freedom from human impairment or anthropogenic stressors), and resiliency to environmental change (the capacity to recover from or adapt to disturbance and stress). The IEI is a composite of 19 different landscape metrics, and has been scaled to reflect relative ecological integrity within New Hampshire.
35 Index of Ecological Integrity (UMass 2015) Habitat loss Watershed habitat loss Traffic Mowing & Plowing Edges (microclimate altered) Salt application (watershed) Sediment (road class) Nutrients (land use class) Cats (domestic predators) Edge predators Badplants (non-native, invasive) Worms (non-native earthworms) Imperviousness (watershed) Dam intensity (watershed) Similarity (of neighbor cells) Connectedness (surrounding cells) Aquatic connectedness Sea rise (USGS Woods Hole) Climate alteration

36 Index of Ecological Integrity (UMass 2015)
37 Habitat Condition - Aquatic High Quality Streams and Rivers were identified by The Nature Conservancy and based on four attributes: 1.) linear connectivity (length of functional stream network) 2.) low riparian development and agriculture (100m) 3.) no active dams, and upstream dam water storage less than 10% of mean annual flow 4.) low impervious surfaces (less than 2%).
38 Habitat Condition - Aquatic Top-ranked Lakes and Ponds were also assessed by NHF&G for four attributes (based on TNC 2005 parameters): 1.) Local condition (200 meter shoreline buffer): percent natural land cover, no dams, distance to nearest road or trail 2.) Watershed condition (HUC12): intactness based on percent natural cover 3.) Index of Ecological Integrity (UMass) 4.) Size of the water body

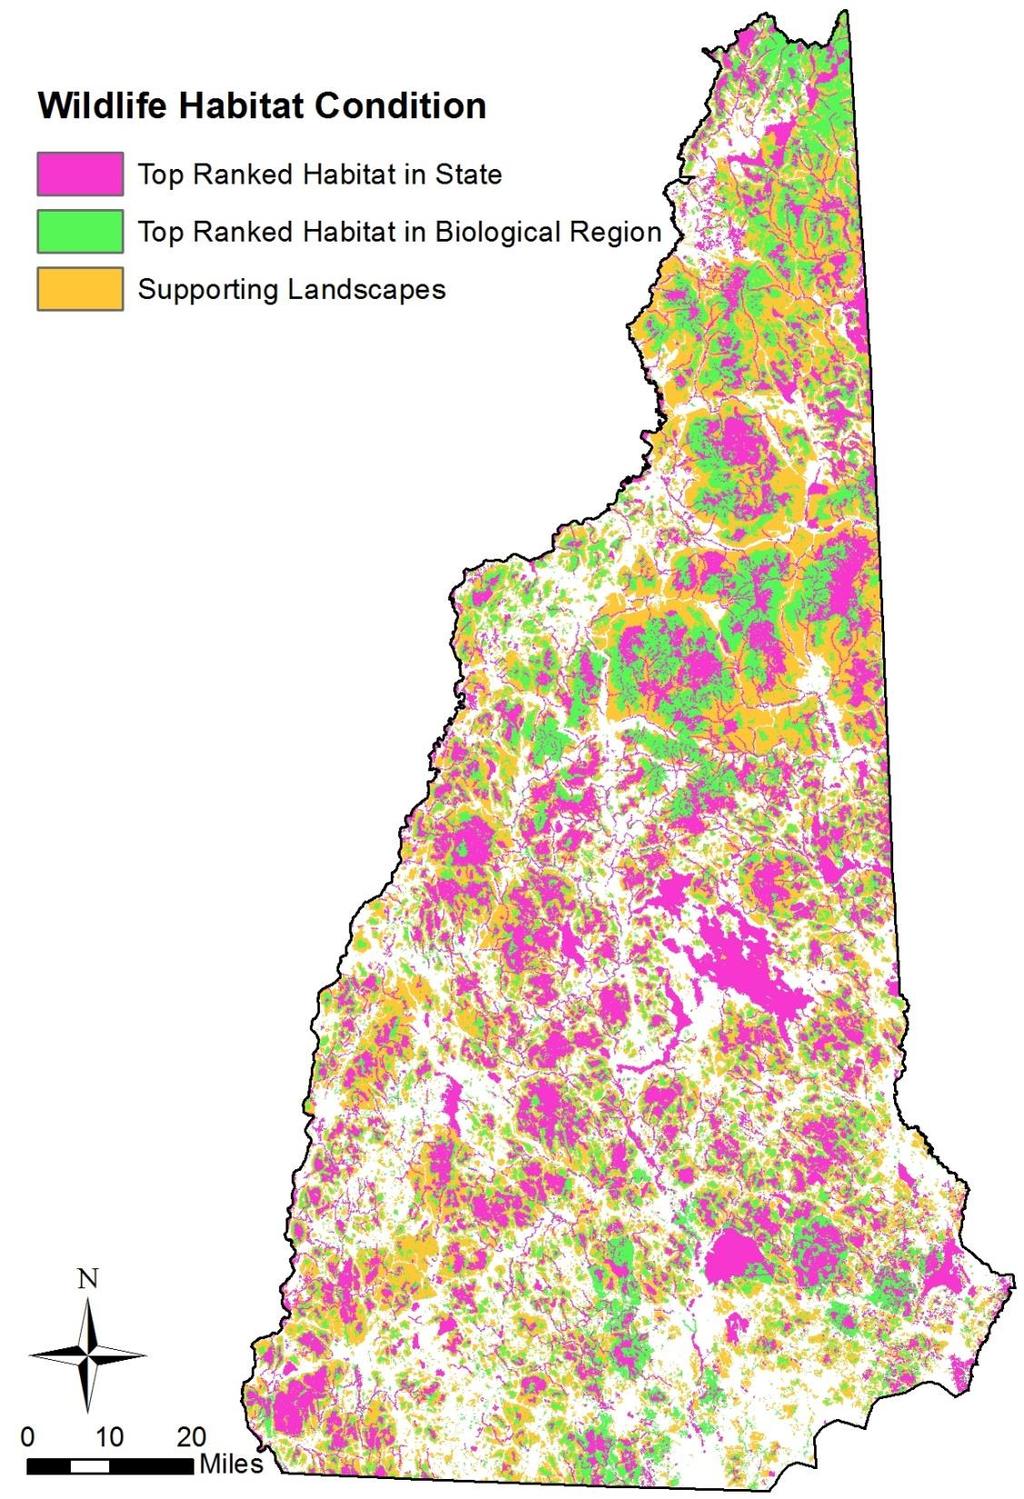
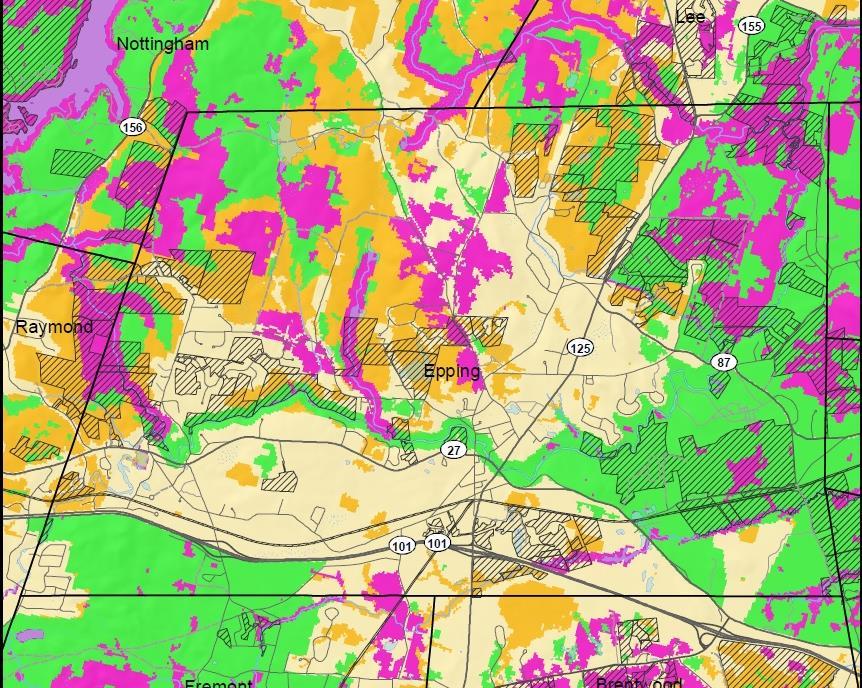
39 Highest Ranked Wildlife Habitat By Relative Ecological Condition Condition score + Rare element occurrences Tier 1 = top 15% in NH Tier 2 = top 30% in biological region Tier 3 = top 50% in biological region With exceptions

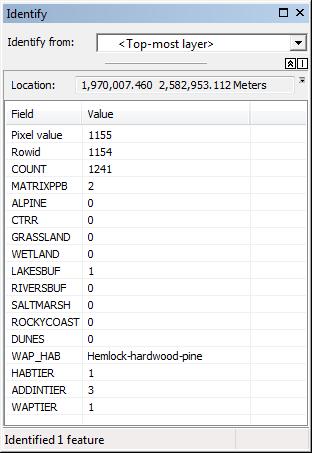
40 What attributes come with the habitat land cover? It is a raster dataset including: Attributes produced in the regional dataset Crosswalk to NH Wildlife Action plan habitats
41 What attributes come with the Condition Analysis (WAPTiers)? Habitat type Tier for each habitat type Whether there was an add-in, but not which kind NOTE: You cannot find exactly what made a spot highest ranked as it is a combination of all these factors unless it is just an add-in.
42

43 Community Actions! Plan for Wildlife
44

45 Community Actions! Plan for Wildlife
46

47 Landowner Actions! Plan for Wildlife How are habitats arranged on your land? What are the potential wildlife species? How would you manage for these habitats and/or species? Next step go out and look at what is there takingactionforwildlife.org Good Forestry in the Granite State
 Descriptions of habitat")


48 Entire Wildlife Action Plan (PDF) Descriptions of habitat mapping More to come: pages on species, habitats, risks and actions! GIS Data available on GRANIT and GRANITView II For more information on regional datasets: