Quantifying Ecosystem Service and Values of the Urban Forest. David J. Nowak USDA Forest Service Northern Research Station Syracuse, NY, USA
|
|
|
- Shanna Lang
- 5 years ago
- Views:
Transcription


1 Quantifying Ecosystem Service and Values of the Urban Forest David J. Nowak USDA Forest Service Northern Research Station Syracuse, NY, USA

2 Overview Ecosystem services Measuring services Top down Bottom up Telling the story New tools International limitations

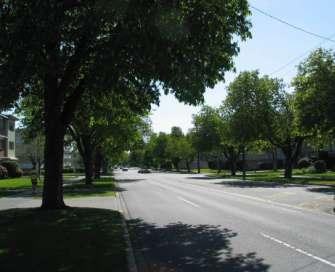
3 Urban Tree Effects / Benefits Air quality improvement Water quality improvement UV radiation reduction Cooler air temperature Building energy conservation Greenhouse gas reduction Aesthetics Noise reduction Wildlife habitat Social / physiological benefits Human health
4 Measurement is Critical Structure Function Value


5 Develop Management Plans Current State Future State (better)


 Measures Potential")
6 Help meet Environmental Regulations U.S. EPA Clean Air Act Incl. carbon Clean Water Act Australia - National Environment Protection Council (NEPC) National Environment Protection Measures Potential funding
7
8 What is i-tree? A suite of tools to assess urban vegetation and their ecosystem services and values i-tree Eco = UFORE v. 3.0 programs

9 Public-Private Partnership USDA Forest Service Davey Tree Expert Co. National Arbor Day Foundation Society of Municipal Arborists International Society of Arboriculture Casey Trees

10 i-tree Use Distributed to over 90 countries

11 Assessing Urban Forests Top-down approach Aerial-based Bottom-up approach Ground-based
 Hi-resolution (~1 m)")
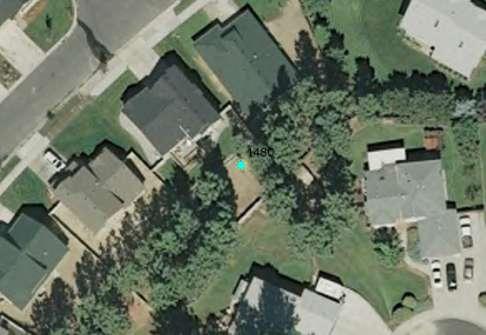
12 Top-down Approach Cover Data Landsat (30 m) Hi-resolution (~1 m) Photo-interpretation

13 Cover Maps
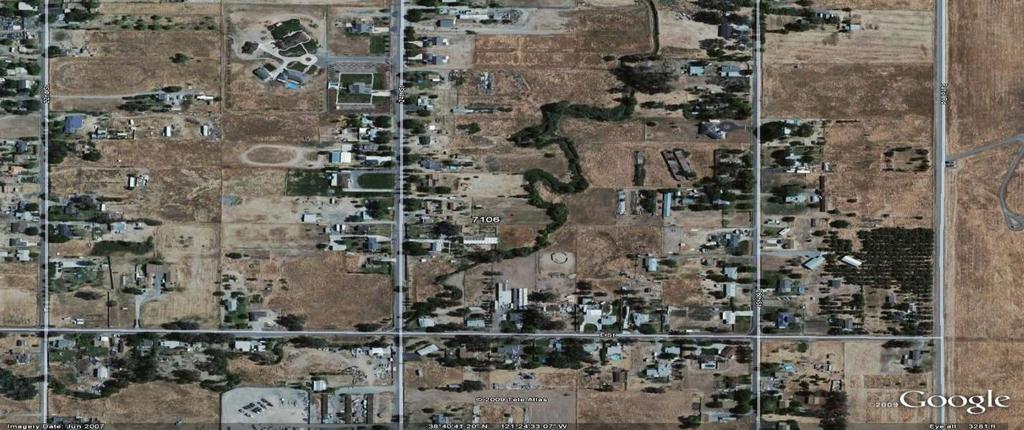
14 Photo Interpretation 14

15 PI Mapping 15

16 i-tree Canopy (v. 4.0)

17 You choose the cover classes
18 Classify random points

19 Melbourne results Tree Cover = 13.0% SE = 1.5% N = 500

20 Change Analysis

21 Tree Cover 60.0% Year 1 Year % 40.0% 30.0% 20.0% 10.0% 0.0%

22 Ground-based Approach: i-tree

23 Core Programs

24 The Foundation: Local Data Local Sample or Inventory Local information: Weather Pollution Environmental variables Hourly simulations
25 Assessing Urban Tree Populations i-tree Eco assesses: Structure Function Energy Air pollution Carbon VOC emissions Value Management needs Pest risk Tree health Exotic/invasive spp.


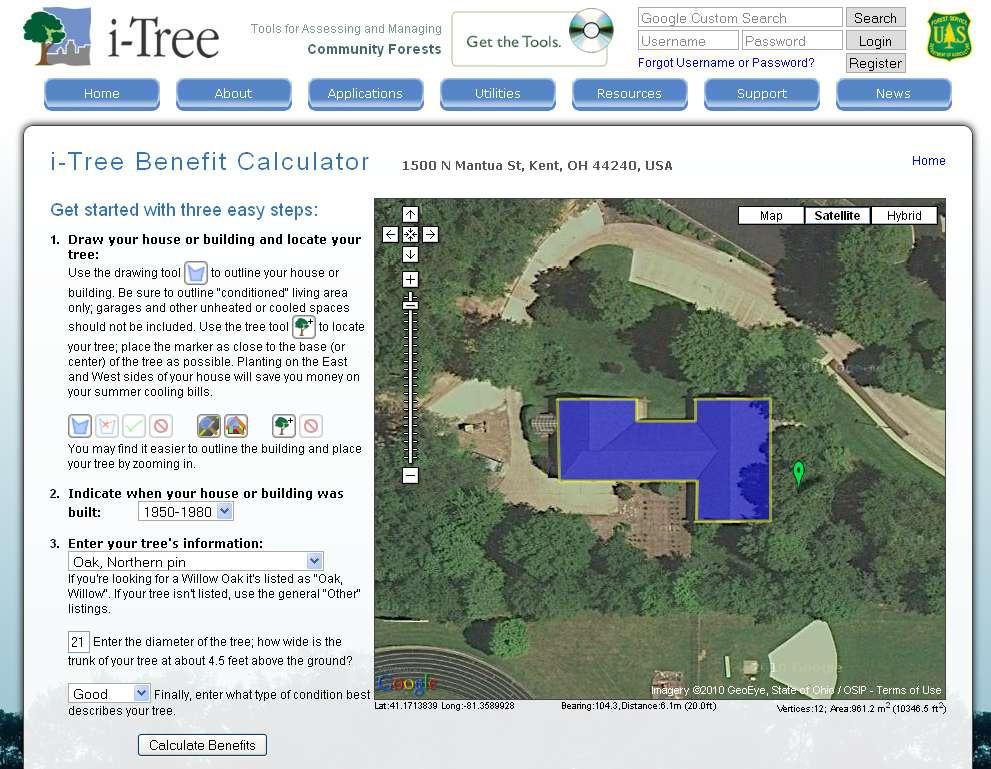
26 How is an assessment done? i-tree Step 1 Determine Study Area


27 i-tree Step 2 Determine if inventory or sample
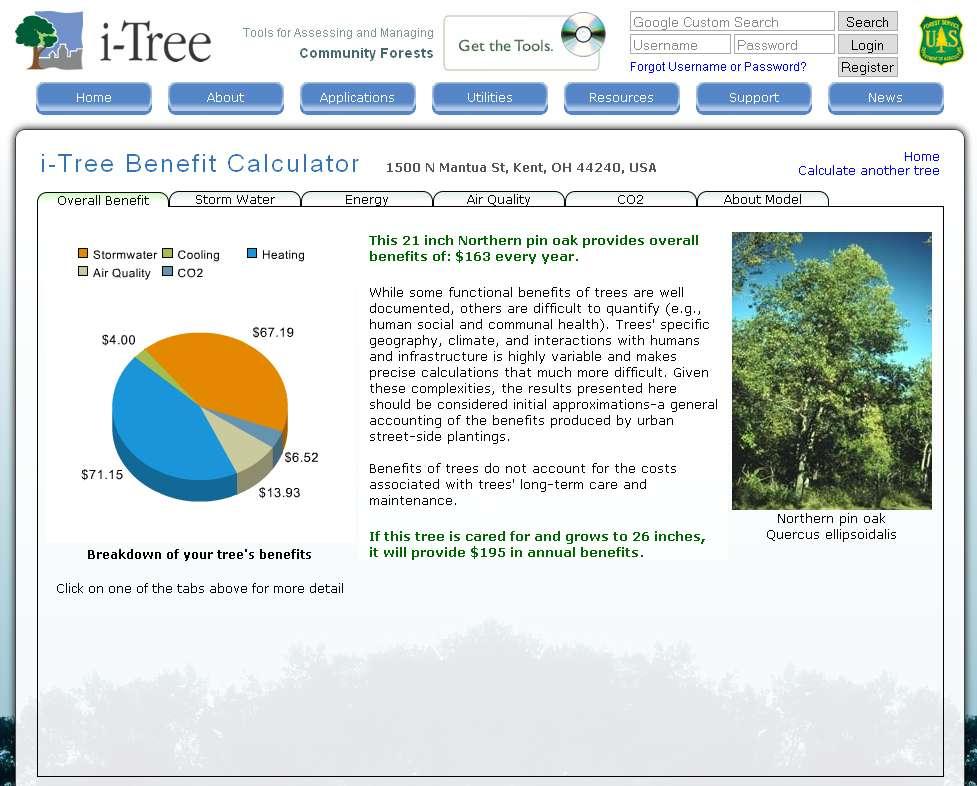
28 i-tree Step 2a Determine Number of Plots Typically 200 1/10 acre plots

29 i-tree Step 3 Determine what data to collect Required core variables (spp, dbh) Optional variables Crown parameters Tree health Distance to buildings Shrub data Ground cover data


30 i-tree Step 4 Lay sample points Random Pattern Random Grid Pattern Stratified by LU

31 Random with no Stratification

32 Random with Stratification

33 i-tree Step 5 Set up project


34 i-tree Step 6 Train crews and collect field data

35 i-tree Step 7 Enter data and analyze


36 i-tree analyses

37 i-tree Step 8 Use data and reports to make a difference Automatic Report Generator


38 i-tree: Demonstrating That Trees Pay Us Back! Street Tree Benefits in Minneapolis: $6.8 million in energy savings $9.1 million in reduced storm water runoff $7.1 million increase in property value $1 million improvements to air quality

39 Making Change in Casper, WY Hired first Urban Forester Started Pilot UF Forestry Program Established benchmarks for program evaluation Implement program to diversify plantings Administrative support

40 Chattanooga, Tennessee
41 Informed Management Decisions EAB Structural Impacts: 17.4% Canopy Loss Milwaukee Ecosystem Assessment (2008) $221 Million structural damage (citywide) EAB Functional Impacts: $243,785 less pollutant removal $138,000 less energy savings (cooling costs) $2.6 million reduction in storm water benefits (1996 study)

42 Oakville Management Advances Integration of UF with air quality and climate protection initiatives By-laws to protect large stature trees on public & private property Justified expense for tree inventory & UF management plan Canopy goals & guidelines for developments Compelling message

43 Strategic Marketing & Promotion
44 Demonstrating Tree Value

45 Demonstrating Tree Value

46 Demonstrating Trees are Assets

47 Public Relations Campaign
48 Current Model Version 3.0

49 Species Selection based on Ecosystem Services

50 v. 4.0 Improvement

51 Street Tree Storm Damage Estimates

52 Map and Project Cover and Ecosystem Services (NLCD data)
 5 New or")
53 i-tree Version 4.0 (March 10, 2011) 5 New or Enhanced Tools Canopy Pest

54 i-tree-hydro Separate GIS program Calibrates against stream flow data


55 Links NCLD to Google Maps Allows for Corrections


56 Pest Pest Detection Protocol Collect Pest & Disease Signs Symptoms Reports Associated pest & diseases Trends/patterns
57


58 Regional Scale Local Scale i-tree 2 nd Generation (Version 5.0+) On-line Mapping tools Growth / Mortality / Influx rates Land / Tree Cover Landscape Change

59 Priority Planting Index

60 Temperature Mapping On-line Mapping tools Heat Island Baltimore, Maryland Growth / Mortality / Influx rates Land / Tree Cover - - Landscape Change Source: Heisler et al., USFS

61 On-line Mapping tools Heat Island Baltimore, Maryland Growth / Mortality / Influx rates Land / Tree Cover - - Landscape Change Source: Heisler et al., USFS

62 On-line Mapping tools Heat Island Baltimore, Maryland Growth / Mortality / Influx rates Land / Tree Cover - - Landscape Change Source: Heisler et al., USFS


63 Regional Scale Local Scale Pollution Distribution Conc. Vd Temp. Flux
64 International Analyses Model designed work for U.S. e.g., species information, pollution data Data from other counties can have issues Looking for international partners to help build international versions
65 Updating data bases Field Data Species Data New species botanical info, shading coeff., range, dec/evergreen, growth rate (S,M,F), height, life span (S,M,L) Location Data New city lat/long, elevation, time zone, leaf on/off dates, albedo and terrain factors Weather Data Pollution Data Hourly concentration in proper format
66 Updating program information Carbon Biomass formulas, growth rates Air Pollution VOC emissions Energy Will not work outside U.S. Valuation CTLA formula spp factors, base values Local carbon and pollution values ($/t)

67 Conclusion Urban forests and their benefits can be assessed i-tree can help Australian version of i-tree is being developed

68 Questions? nrs.fs.fed.us/units/urban