Ecological Gap Assessment: An Overview
|
|
|
- Brooke Miles
- 5 years ago
- Views:
Transcription


1 Ecological Gap Assessment: An Overview
2 1. What is a gap assessment? 2. Why is it important? 3. What are some general principles? 4. What are the major steps? 5. What can we learn from gap analysis?
3 1. What is a Gap Assessment? In this case: a comparison between the distribution of biodiversity and the status of protection / conservation within a country

4 For example: this is the distribution of significant biodiversity in Grenada

5 compared with existing and planned protected areas comparison shows where biodiversity remains unprotected
 not adequately conserved")
6 2. Why conduct a gap assessment? To identify biodiversity (i.e., species, ecosystems and ecological processes) not adequately conserved within a protected area network or through other effective and long-term conservation measures.

7
8 2. Why conduct a gap assessment? Human population and pressure continue to increase Most of the pressure comes from people born in the rich countries

9 2. Why conduct a gap assessment? Human population and pressure continue to increase Biodiversity is in rapid decline

10 2. Why conduct a gap assessment? Human population and pressure continue to increase Biodiversity is in rapid decline Change is non-linear Fisheries collapse

11 2. Why conduct a gap assessment? Human population and pressure continue to increase Biodiversity is in rapid decline Change is non-linear Human well-being is linked to ecology Flood increases Although biodiversity is our starting point, protected areas offer important additional benefits
12


13 Gap analysis is important because although over 10% of the world s land surface is in protected areas it has proven easier to protect deserts and ice-caps than many high biodiversity areas such as lowland forests
14 A gap assessment lets us be more focused, strategic and efficient with our conservation investments
15 3. Principles for Gap Assessments
16 3. Principles for Gap Assessments 1. Representation is all of biodiversity represented in the PA system? 2. Resilience 3. Redundancy 4. Multiple gaps 5. Participation
17 3. Principles for Gap Assessments 1. Representation 2. Resilience are there enough high quality examples to withstand change? 3. Redundancy 4. Multiple gaps 5. Participation
18 3. Principles for Gap Assessments 1. Representation 2. Resilience 3. Redundancy are there multiple examples distributed across system? 4. Multiple gaps 5. Participation
19 3. Principles for Gap Assessments 1. Representation 2. Resilience 3. Redundancy 4. Multiple gaps are representation, functional & management gaps built in? 5. Participation
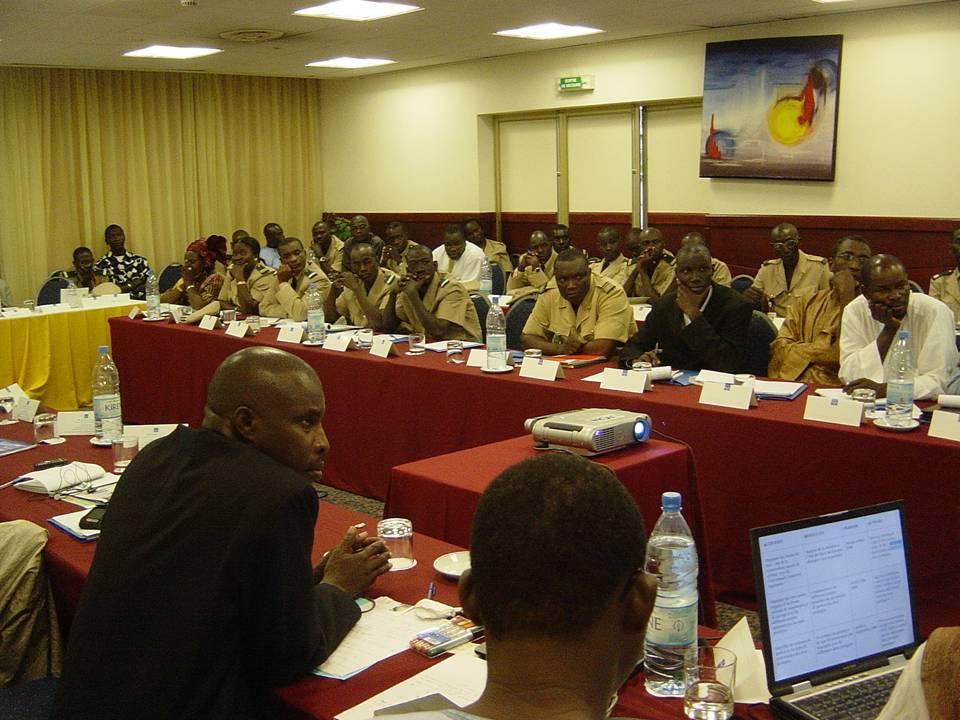
20 3. Principles for Gap Assessments 1. Representation 2. Resilience 3. Redundancy 4. Multiple gaps 5. Participation are stakeholders involved in an iterative process?
21

22 4. What are the major steps? A. Assess biodiversity status Identify focal biodiversity elements Assess current distribution Assess viability Map threats Set biodiversity and conservation goals B. Assess protection status Map distribution of all PAs by type and governance Map results of PA management effectiveness C. Analyze results Key data sets Critical questions D. Fill gaps Prioritize key gaps Develop strategies to fill gaps Develop cost estimates

23 4. Key Steps in Gap Assessment A. Assess biodiversity status Identify focal biodiversity elements Assess current distribution Assess viability Map threats Set biodiversity and conservation goals B. Assess protection status Map distribution of all PAs by type and governance Map results of PA management effectiveness C. Analyze results Key data sets Critical questions D. Fill gaps Prioritize key gaps Develop strategies to fill gaps Develop cost estimates

24 4. Key Steps in Gap Assessment A. Assess biodiversity status Identify focal biodiversity elements Assess current distribution Assess viability Map threats Set biodiversity and conservation goals B. Assess protection status Map distribution of all PAs by type and governance Map results of PA management effectiveness C. Analyze results Key data sets Critical questions D. Fill gaps Prioritize key gaps Develop strategies to fill gaps Develop cost estimates
25 4. Key Steps in Gap Assessment A. Assess biodiversity status Identify focal biodiversity elements Assess current distribution Assess viability Map threats Set biodiversity and conservation goals B. Assess protection status Map distribution of all PAs by type and governance Map results of PA management effectiveness C. Analyze results Key data sets Critical questions D. Fill gaps Prioritize key gaps Develop strategies to fill gaps Develop cost estimates
26 A.Assess biodiversity status Identify focal biodiversity elements Assess current distribution and viability Assess threats Map threats Set biodiversity and conservation goals
27 Identifying focal biodiversity elements Represent full suite of biological complexity Capture irreplaceable and vulnerable species Capture ecological functions Include all biological realms Include multiple spatial and biological scales


28 Capturing ecosystem elements in Ecuador 12 INTERTIDAL 27 SUBTIDAL SYSTEMS Rocky beaches Sandy beaches Muddy beaches Mangroves Rocky bottom Sandy bottom Grave bottom Muddy bottom Sea banks Coral reefs


29 Capturing species elements in Ecuador Selection criteria for species: Threatened Endemic Habitat builders Keystone species Migratory Total 53 species: mammals, fish, birds, crustaceans, molluscs, reptiles
30 Assessing current distribution and viability Factors include: a) Size (minimum dynamic area, minimum viable population) b) Condition c) Landscape context (fragmentation, isolation) d) Configuration
31 Assessing current distribution and viability Overall Viability Summary East Molokai - Hawaii Conservation Targets Landscape Context Condition Size Viability Rank 1 North Shore Forests & Cliffs Fair Good Fair Fair 2 Montane Wet Forest Fair Very Good Fair Good 3 South Slope Mesic Forest & Shrubland Poor Good Poor Fair Overall Biodiversity Health Rank Fair

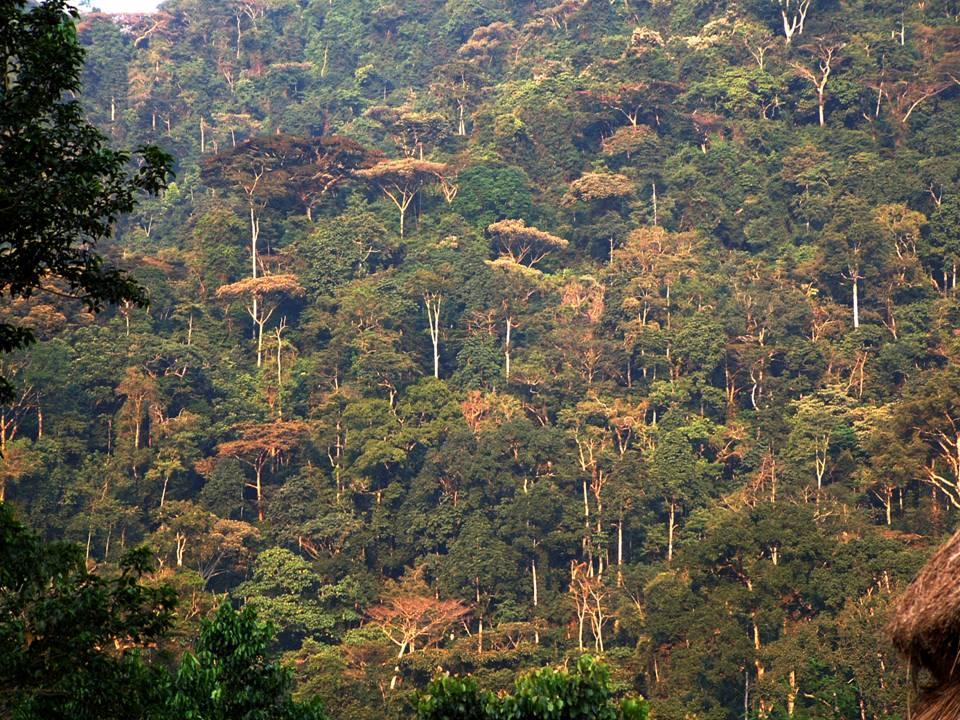
32 Viability of sparse and open forests in Sri Lanka

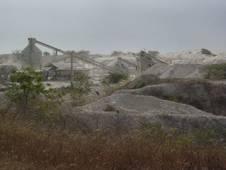
33 Assessing threats

 Consider restoration goals")
34 Setting biodiversity and conservation goals Factors in Setting Goals: Ecological needs and thresholds Threat status of biodiversity Distribution and rarity Protection goals may be categorical (e.g % of the ecosystem) Consider restoration goals
35 Example of setting goals from Grenada Level 1: Biome Level 2: Major Habitat Type Level 3: Ecoregions Level 4: Focal biodiversity elements Cloud Forest Tropical Moist Forest Windward Island Moist Forest Cloud Transitional Forest Evergreen Forest Terrestrial Mixed Wood Agriculture Dry Deciduous Forest Tropical Dry Forest Lesser Antillean Dry Forest Drought Deciduous Forest Semi Deciduous Forest Freshwater Tropical Island Fresh Water Systems Fresh Water Bodies Streams Emergent Wetlands Open Water Bodies Class 4-6 Streams Class 7-8 Streams
36 Example of setting goals from Grenada Level 1: Biome Level 2: Major Habitat Type Level 3: Ecoregions Goal: 25% Level 4: Focal biodiversity elements Individual Goals Cloud Forest : 99% Tropical Moist Forest Windward Island Moist Forest Cloud Transitional Forest : 85% Evergreen Forest 32% Terrestrial Mixed Wood Agriculture: 20% Dry Deciduous Forest : 25% Tropical Dry Forest Lesser Antillean Dry Forest Drought Deciduous Forest: 25% Semi Deciduous Forest : 25% Freshwater Tropical Island Fresh Water Systems Fresh Water Bodies Streams Emergent Wetlands: 50% Open Water Bodies: 75% Class 4-6 Streams: 75% Class 7-8 Streams: 100%
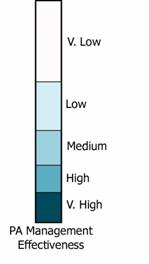
37 B. Assess protection status Map distribution of all protected areas by type and governance Map results of protected area management effectiveness if available
38 Distribution of existing protected areas in Jamaica
39

40 Mexico: 155 PAs under federal jurisdiction in seven regions
41
42


43
44 C. Analyze results key data and critical questions a) Biodiversity status for each element: a) Goals b) Distribution and viability c) Threat status Protection status for each element: Protected area type/governance Protected area management effectiveness

45 D. Fill gaps Prioritize key gaps Develop strategies to fill gaps Develop cost estimates and action plan

46 Prioritize key gaps All gaps cannot be filled at once. Prioritize areas based on threat, leverage, opportunity, irreplaceability, feasibility Consider early wins to build momentum and enthusiasm for protected areas locally and nationally

47 Forest reserves in Africa
48 Develop strategies to fill gaps Create new protected areas and corridors Expand or reconfigure existing protected areas Change designation Improve management Restore degraded protected areas Look at other options for filling gaps

49
50 IUCN matrix of protected areas categories and governance types Governance type A. Government Managed Protected Areas B. Co-managed Protected Areas C. Private Protected Areas D. Community Conserved Areas Category (management objective) Federal or national ministry or agency in charge Local/ municipal ministry or agency in change Government-delegated management (e.g. to an NGO) Trans-boundary management Collaborative management (various forms of pluralist influence) Joint management (pluralist management board) Declared and run by individual land-owner by non-profit organisations (e.g. NGOs, universities, etc.) by for profit organisations (e.g. corporate land-owners ) Declared and run by Indigenous Peoples Declared and run by Local Communities I - Strict Nature Reserve/ Wilderness Area II National Park (ecosystem protection; protection of cultural values) III Natural Monument IV Habitat/ Species Management V Protected Landscape/ Seascape VI Managed Resource

51
52 Within a single protected area, several zones with different management objectives can be agreed if this helps overall management
53 Temporary zones are also possible (e.g. to allow sustainable management of non-timber forest products by local communities)
54 A single protected area can have several categories and governance types Cat. IV private protected area Category II co-managed Cat. 1 community conserved area
55 A protected area can conserve biodiversity by using a range of management objectives. Cat. I Cat. V Core zones Cat. II Cat. III Sacred site Cat. VI Cat. II Cat. IV Cat. I Sustainable management zone
56

57 Develop cost estimates and an action plan

58
59 5. What can we learn from gap analysis? 1. What are the biases in the PA system? 2. What elements of biodiversity are most at risk? 3. How far are elements from their goals? 4. What is the significance of each PA? 5. Where should new PAs be added?

60 Mexico s Gap Assessment 11 Ecoregions with no formal PA. Deserts and shrublands with higher representation in existing PA. Tropical dry forests severely underrepresented.
61 3. What do gap assessments tell us? 1. What are the biases in the PA system? 2. What elements of biodiversity are most at risk? 3. How far are elements from their goals? 4. What is the significance of each PA? 5. Where should new PAs be added?
62
63 3. What do gap assessments tell us? 1. What are the biases in the PA system? 2. What elements of biodiversity are most at risk? 3. How far are elements from their goals? 4. What is the significance of each PA? 5. Where should new PAs be added?
64 0% 10% 20% 30% 40% 50% 60% 70% 80% 90% 100% Cloud Forest Transitional Cloud Forest Evergreen Forest Mixed Wood Agriculture Semideciduous Forest % Protected Dry Deciduous Forest Drought Deciduous Forest Emergent wetlands Fresh Water Bodies Streams Rivers
65 0% 10% 20% 30% 40% 50% 60% 70% 80% 90% 100% Cloud Forest Transitional Cloud Forest Evergreen Forest Mixed Wood Agriculture Semideciduous Forest Dry Deciduous Forest % Protected Goal Drought Deciduous Forest Emergent wetlands Fresh Water Bodies Streams Rivers
66 3. What do gap assessments tell us? 1. What are the biases in the PA system? 2. What elements of biodiversity are most at risk? 3. How far are elements from their goals? 4. What is the significance of each PA? 5. Where should new PAs be added?

67 PA EFFECTIVENESS, SIGNIFICANCE, THREAT
68 3. What do gap assessments tell us? 1. What are the biases in the PA system? 2. What elements of biodiversity are most at risk? 3. What is the significance of each PA? 4. Where should new PAs be added?
69 Proposed new protected areas in Jamaica

70 An effective system of protected areas is complete protects all key ecosystems and species (gap analysis) is biologically well connected if necessary by restoration initiatives conserves associated natural and cultural values

71 but an effective and equitable system of protected areas is also... socially welcome - merges with and benefits society cost effective - as resources are not infinite flexible and secure - as global change is ubiquitous and clearly under way

72

73